- Главная
- Разное
- Дизайн
- Бизнес и предпринимательство
- Аналитика
- Образование
- Развлечения
- Красота и здоровье
- Финансы
- Государство
- Путешествия
- Спорт
- Недвижимость
- Армия
- Графика
- Культурология
- Еда и кулинария
- Лингвистика
- Английский язык
- Астрономия
- Алгебра
- Биология
- География
- Детские презентации
- Информатика
- История
- Литература
- Маркетинг
- Математика
- Медицина
- Менеджмент
- Музыка
- МХК
- Немецкий язык
- ОБЖ
- Обществознание
- Окружающий мир
- Педагогика
- Русский язык
- Технология
- Физика
- Философия
- Химия
- Шаблоны, картинки для презентаций
- Экология
- Экономика
- Юриспруденция
Introduction to research methods in education презентация
Содержание
- 1. Introduction to research methods in education
- 2. Research Methods Why is it important to
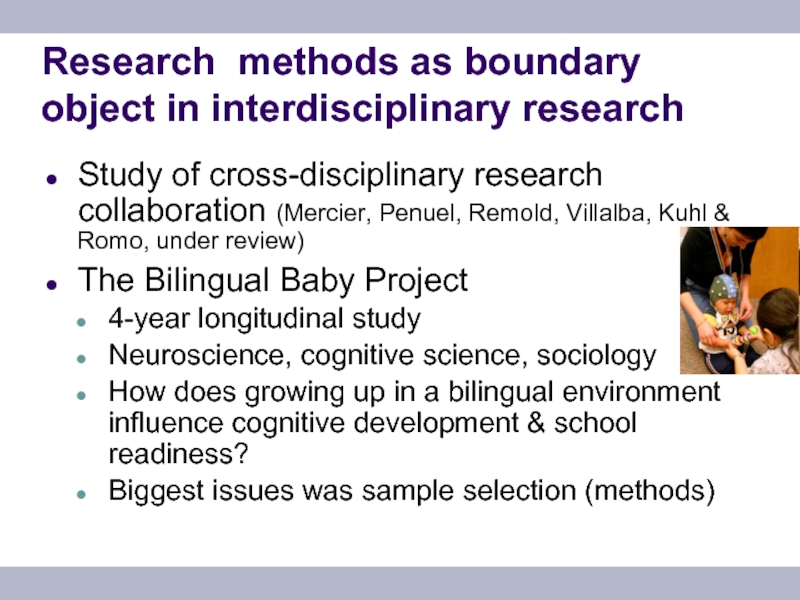
- 3. Research methods as boundary object in interdisciplinary
- 4. … [a child] was brought back for
- 5. It’s difficult because you do form close
- 6. Two Types of Research Quantitative Experimental
- 7. What do you want your data &
- 8. How do you measure learning experimentally?
- 9. How do you measure learning experimentally?
- 10. How do you measure learning experimentally?
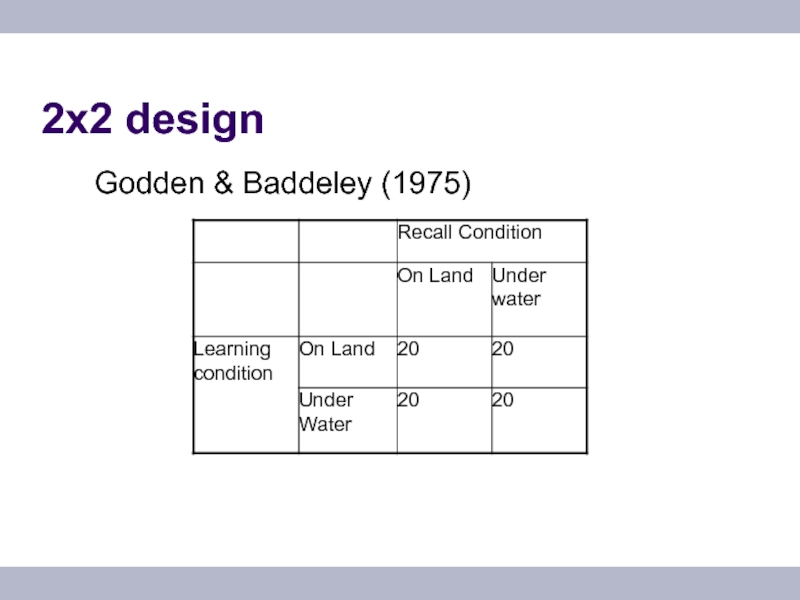
- 11. 2x2 design
- 12. But what are you measuring? Prerequisites for
- 13. But what are you measuring… Is it
- 14. What sort of learning will you measure?
- 15. Important statistical ideas Independent variables The thing
- 16. Important statistical ideas Level of measurement Nominal
- 17. Assumptions for parametric statistics Level of measurement
- 18. Questions?
- 19. Key things to look for: Are the
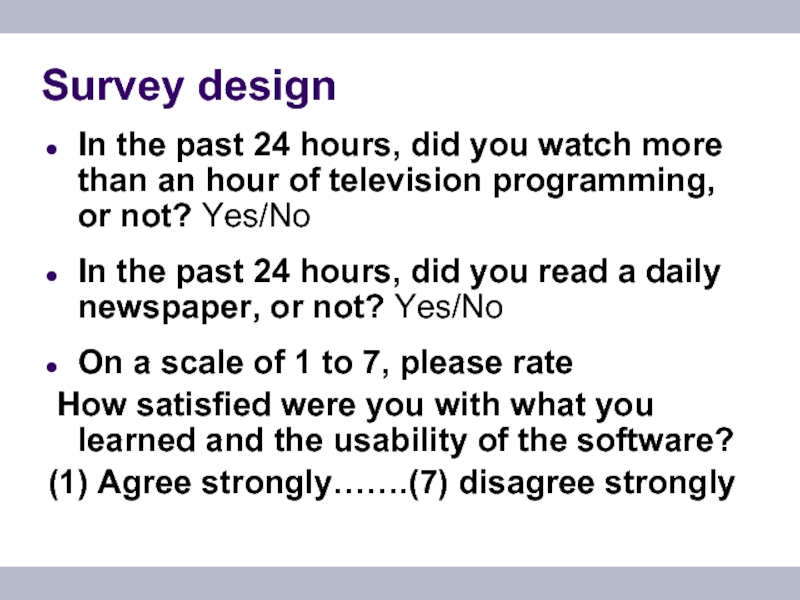
- 20. Survey design In the past 24 hours,
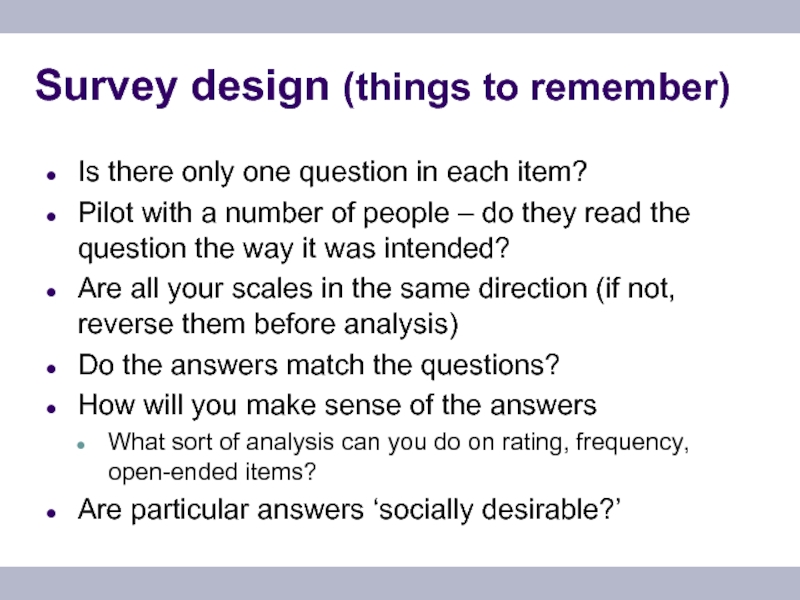
- 21. Survey design (things to remember) Is there
Слайд 2Research Methods
Why is it important to understand research methods for interdisciplinary
Types of research
How do you measure learning experimentally?
Within subjects design
Between subjects design
What are you measuring?
Important Statistical terms
[other methods]
Слайд 3Research methods as boundary object in interdisciplinary research
Study of cross-disciplinary research
The Bilingual Baby Project
4-year longitudinal study
Neuroscience, cognitive science, sociology
How does growing up in a bilingual environment influence cognitive development & school readiness?
Biggest issues was sample selection (methods)
Слайд 4… [a child] was brought back for me to test, and
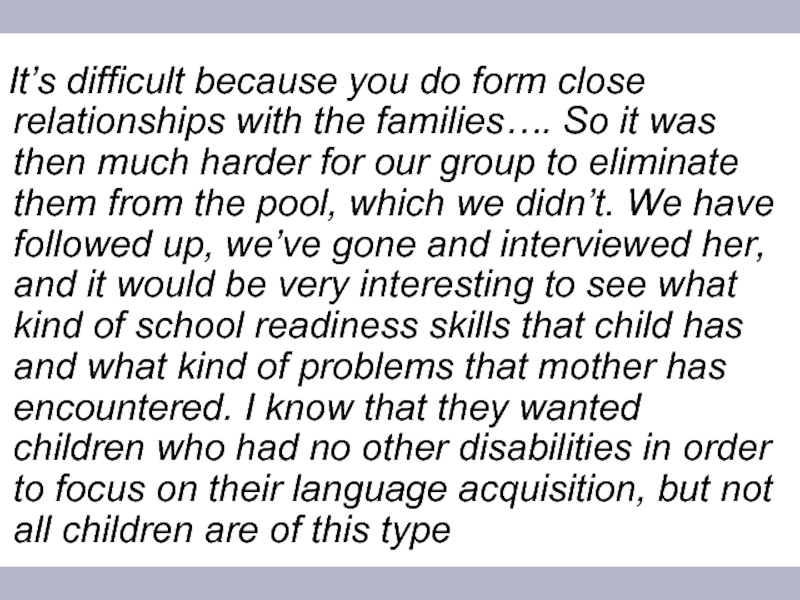
Слайд 5It’s difficult because you do form close relationships with the families….
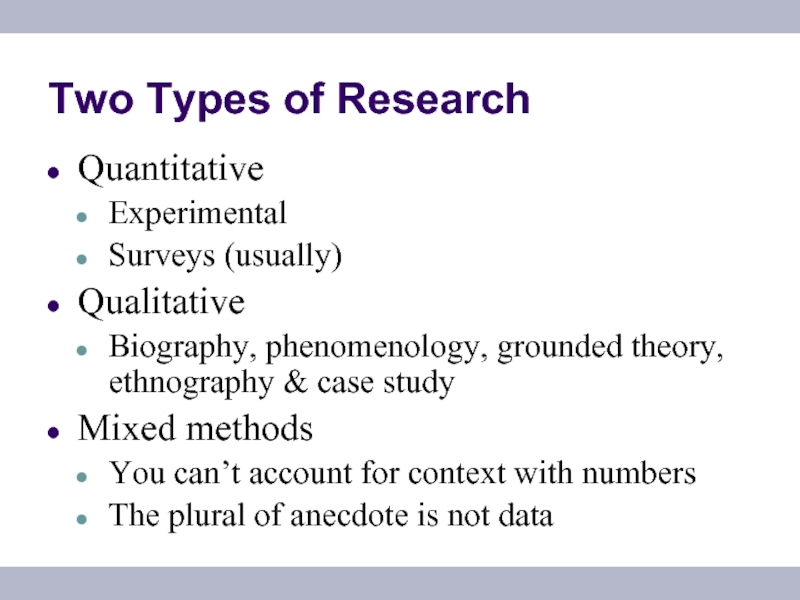
Слайд 6Two Types of Research
Quantitative
Experimental
Surveys (usually)
Qualitative
Biography, phenomenology, grounded theory, ethnography
Mixed methods
You can’t account for context with numbers
The plural of anecdote is not data
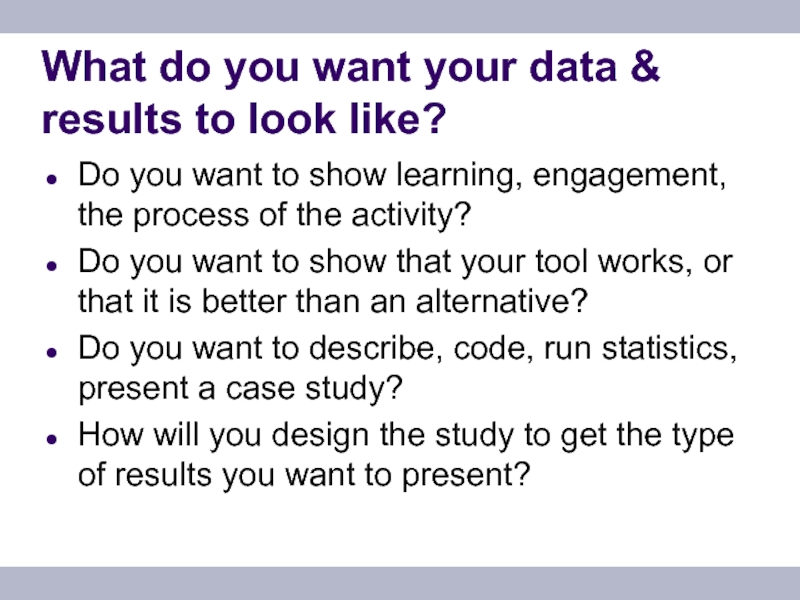
Слайд 7What do you want your data & results to look like?
Do
Do you want to show that your tool works, or that it is better than an alternative?
Do you want to describe, code, run statistics, present a case study?
How will you design the study to get the type of results you want to present?
Слайд 8How do you measure
learning experimentally?
Ecology lesson
Aim: to teach 5
Ten 1-hour long sessions over 5 weeks
“Embodied curriculum”
Technology; dancing; drawing
No way to know whether it was the curriculum, or just being taught that led to learning
CLAIM: Embodied curriculum is a good way to teach complex systems
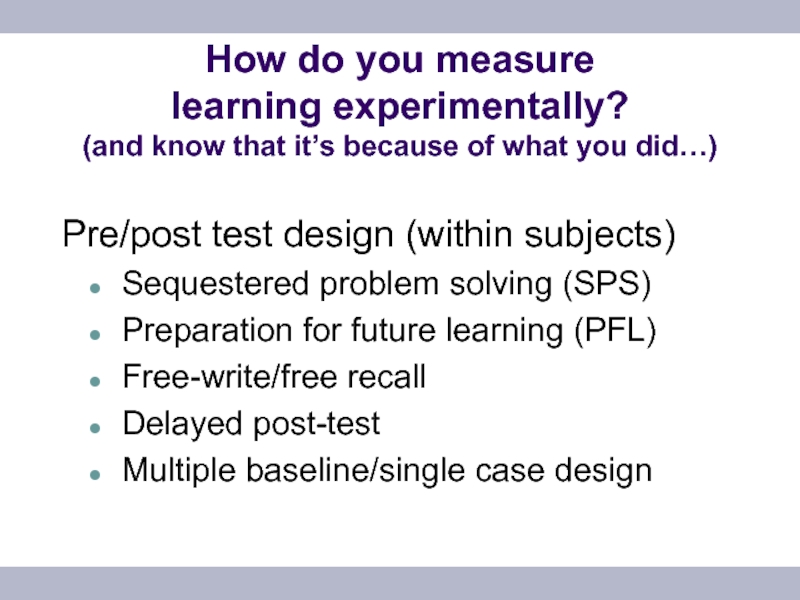
Слайд 9How do you measure learning experimentally? (and know that it’s because
Pre/post test design (within subjects)
Sequestered problem solving (SPS)
Preparation for future learning (PFL)
Free-write/free recall
Delayed post-test
Multiple baseline/single case design
Слайд 10How do you measure learning experimentally? (and know that it’s because
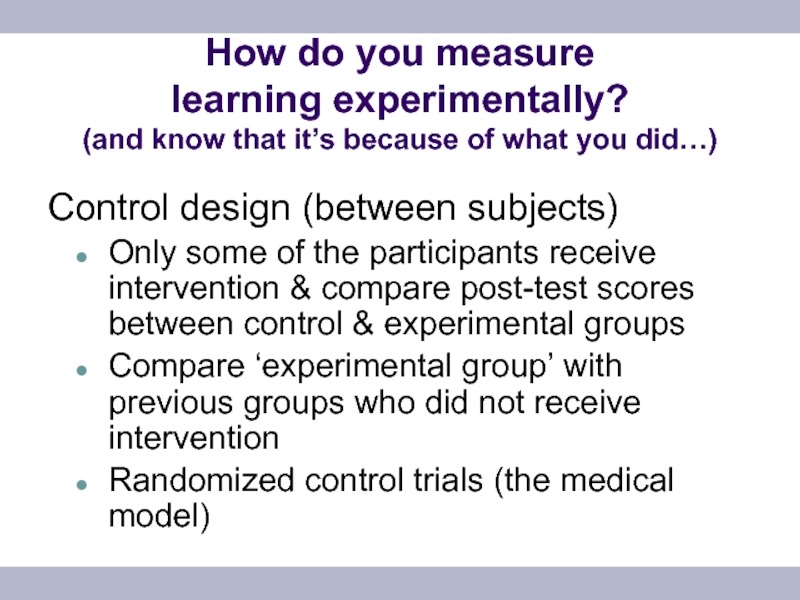
Control design (between subjects)
Only some of the participants receive intervention & compare post-test scores between control & experimental groups
Compare ‘experimental group’ with previous groups who did not receive intervention
Randomized control trials (the medical model)
Слайд 12But what are you measuring?
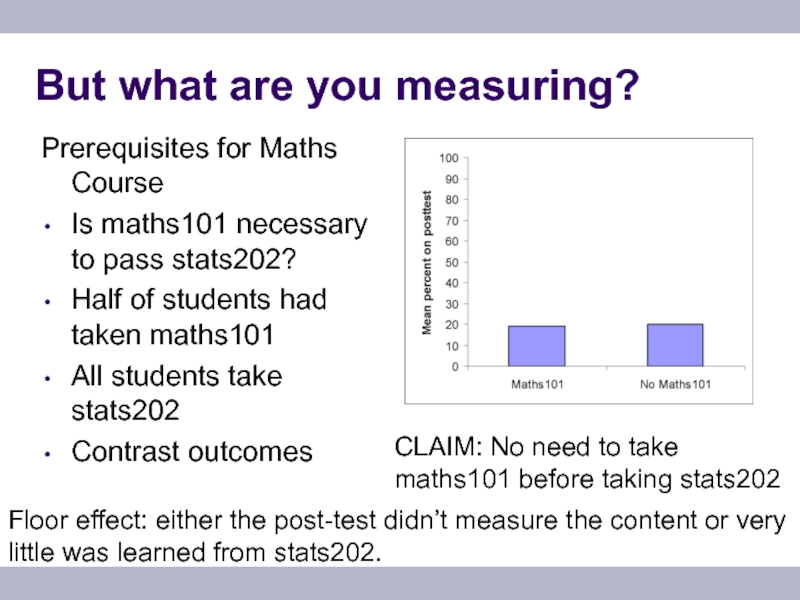
Prerequisites for Maths Course
Is maths101 necessary to
Half of students had taken maths101
All students take stats202
Contrast outcomes
Floor effect: either the post-test didn’t measure the content or very little was learned from stats202.
CLAIM: No need to take maths101 before taking stats202
Слайд 13But what are you measuring…
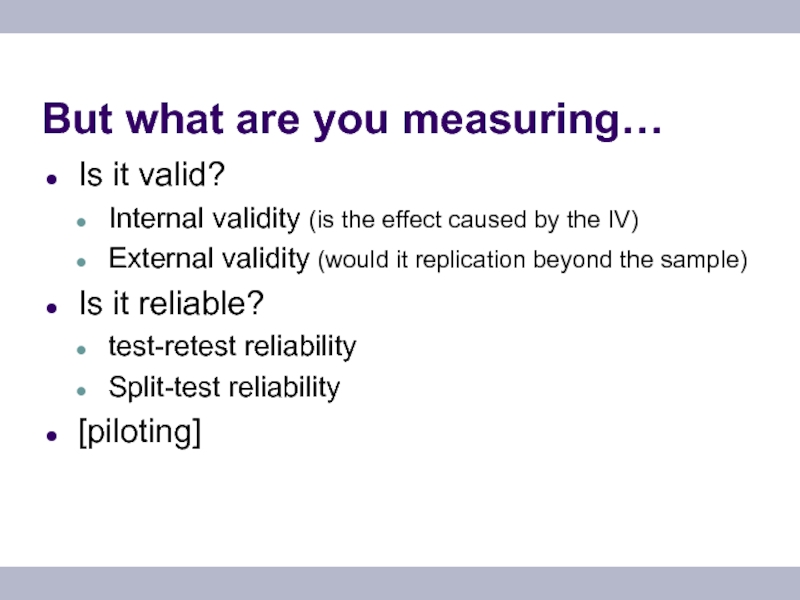
Is it valid?
Internal validity (is the
External validity (would it replication beyond the sample)
Is it reliable?
test-retest reliability
Split-test reliability
[piloting]
Слайд 15Important statistical ideas
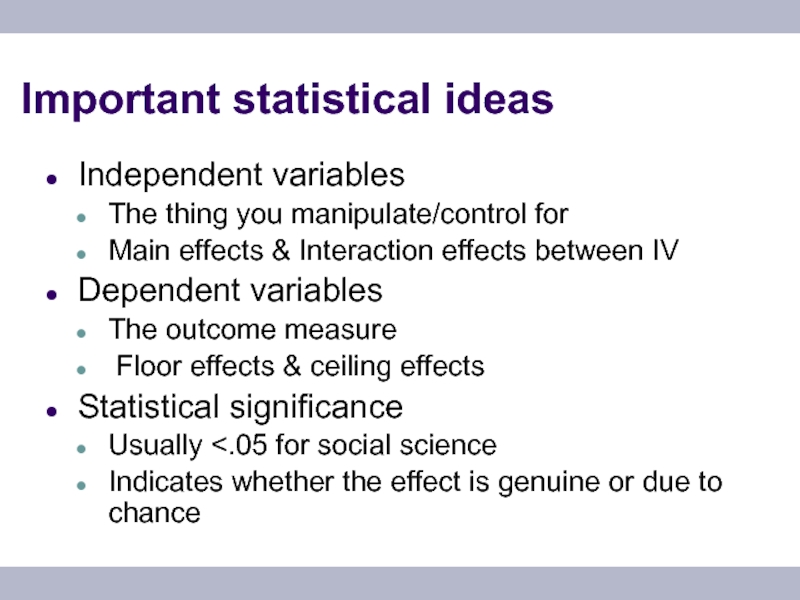
Independent variables
The thing you manipulate/control for
Main effects & Interaction
Dependent variables
The outcome measure
Floor effects & ceiling effects
Statistical significance
Usually <.05 for social science
Indicates whether the effect is genuine or due to chance
Слайд 16Important statistical ideas
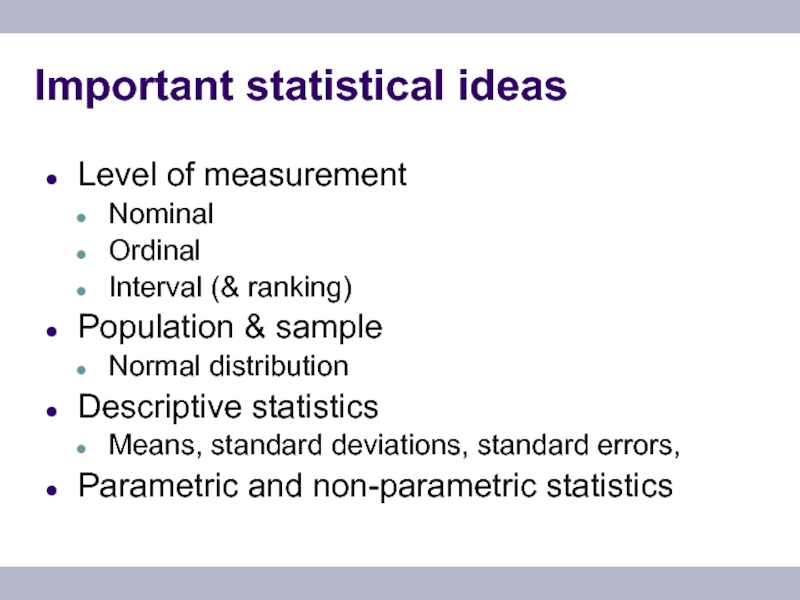
Level of measurement
Nominal
Ordinal
Interval (& ranking)
Population & sample
Normal distribution
Descriptive statistics
Means,
Parametric and non-parametric statistics
Слайд 17Assumptions for parametric statistics
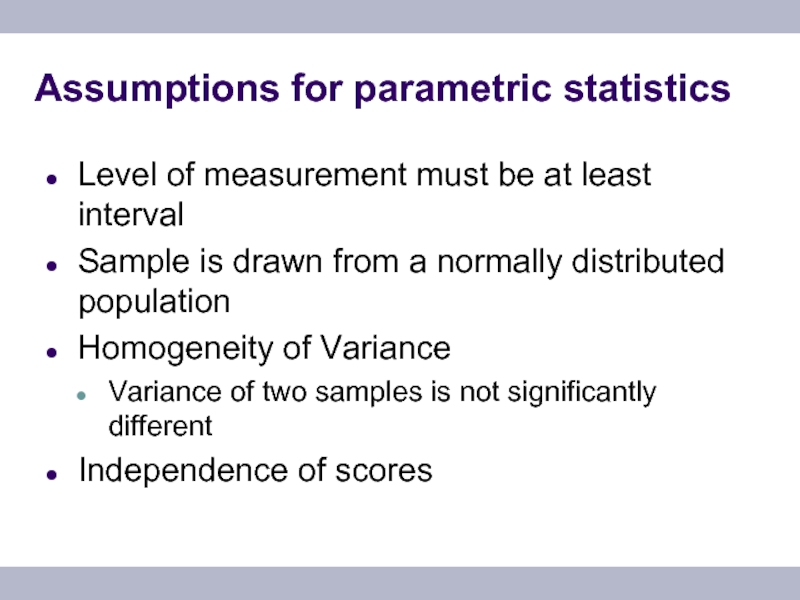
Level of measurement must be at least interval
Sample
Homogeneity of Variance
Variance of two samples is not significantly different
Independence of scores
Слайд 19Key things to look for:
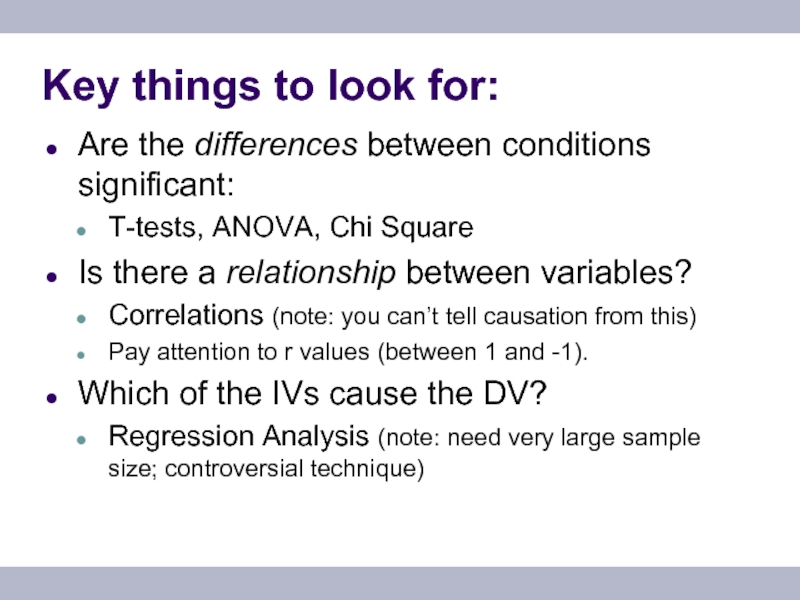
Are the differences between conditions significant:
T-tests, ANOVA,
Is there a relationship between variables?
Correlations (note: you can’t tell causation from this)
Pay attention to r values (between 1 and -1).
Which of the IVs cause the DV?
Regression Analysis (note: need very large sample size; controversial technique)
Слайд 20Survey design
In the past 24 hours, did you watch more than
In the past 24 hours, did you read a daily newspaper, or not? Yes/No
On a scale of 1 to 7, please rate
How satisfied were you with what you learned and the usability of the software?
(1) Agree strongly…….(7) disagree strongly
Слайд 21Survey design (things to remember)
Is there only one question in each
Pilot with a number of people – do they read the question the way it was intended?
Are all your scales in the same direction (if not, reverse them before analysis)
Do the answers match the questions?
How will you make sense of the answers
What sort of analysis can you do on rating, frequency, open-ended items?
Are particular answers ‘socially desirable?’


![… [a child] was brought back for me to test, and I was putting [an](/img/tmb/1/57493/6c9aa77c9ccbaf2398e58e6d29254452-800x.jpg)
