- Главная
- Разное
- Дизайн
- Бизнес и предпринимательство
- Аналитика
- Образование
- Развлечения
- Красота и здоровье
- Финансы
- Государство
- Путешествия
- Спорт
- Недвижимость
- Армия
- Графика
- Культурология
- Еда и кулинария
- Лингвистика
- Английский язык
- Астрономия
- Алгебра
- Биология
- География
- Детские презентации
- Информатика
- История
- Литература
- Маркетинг
- Математика
- Медицина
- Менеджмент
- Музыка
- МХК
- Немецкий язык
- ОБЖ
- Обществознание
- Окружающий мир
- Педагогика
- Русский язык
- Технология
- Физика
- Философия
- Химия
- Шаблоны, картинки для презентаций
- Экология
- Экономика
- Юриспруденция
The pharmaceutical industry презентация
Содержание
- 1. The pharmaceutical industry
- 2. The Pharmaceutical Industry Outline Economics drug
- 3. Home Care 80-90% of illnesses cared for
- 4. Self Medication Inappropriate self (and child) medication
- 5. Self Medication Enemas for diarrhea and fever
- 6. Inappropriate Self-medication: The Common Cold Greater
- 7. Inappropriate Self Medication: Diarrhea Greater than 100
- 8. Inappropriate OTC Medication Use in Children
- 9. Prescription Drugs 10,000 FDA-approved drugs 70%
- 10. Prescription Drugs >10% of U.S. medical
- 11. U.S. Drug Use 81% have used at
- 12. Prescription Drugs Over $300/person/year, or $22,500 over
- 13. Economics of the Pharmaceutical Industry
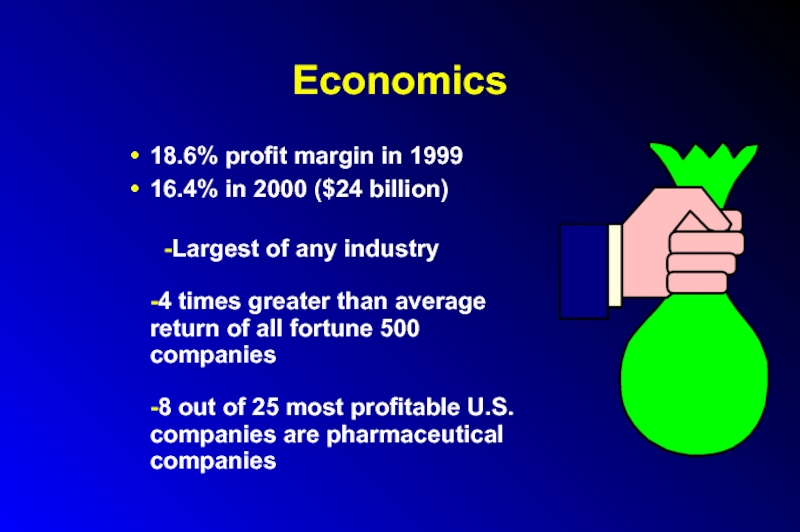
- 14. Economics 18.6% profit margin in 1999
- 15. Economics of the Pharmaceutical Industry Greater than
- 16. Mergers and Acquisitions Drug company mergers
- 17. Mergers and Acquisitions Acquisition of generic divisions
- 18. Economics Sales revenues tripled over last decade
- 19. Economics Average CEO compensation = $20
- 20. Drug Industry Lobbying $38 million donated to
- 21. Drug Industry Lobbying 623 lobbyists for 535
- 22. Drug Costs U.S. highest in the
- 23. Drug Costs U.S. only large industrialized
- 24. Drug Pricing Policies and Regulations Product Pricing
- 25. Decreasing Costs Formularies Generics Volume discounts/mail order
- 26. Drugs: Who Pays?
- 27. Drug Development: Who Pays? $20 billion in
- 28. Drug Development Costs 1991 PHRMA study
- 29. Where Prescription Dollars Go Research and development
- 30. The Elderly and Prescription Drug Coverage Elderly
- 31. The Elderly and Prescription Drug Coverage
- 32. Race, The Elderly and Prescription Drug Coverage
- 33. The Elderly and Prescription Drug Coverage Consequences:
- 34. The Elderly and Prescription Drug Coverage Universal
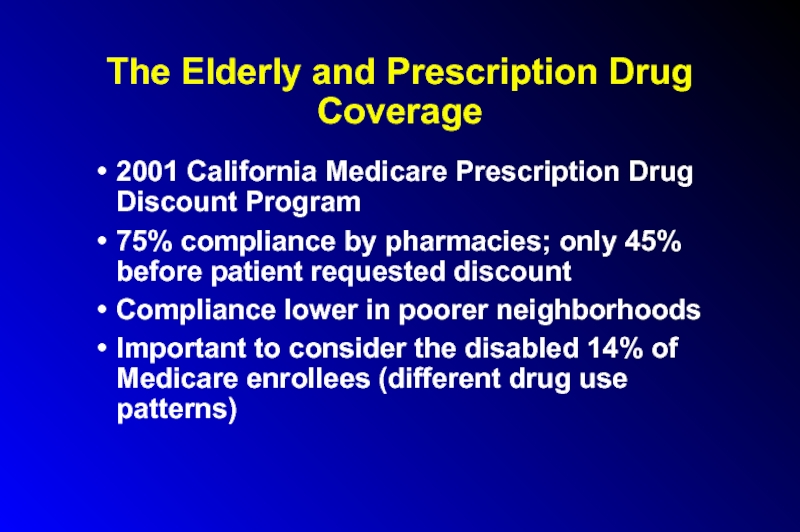
- 35. The Elderly and Prescription Drug Coverage 2001
- 36. Expired Drugs Initial packaging date usually 2-3
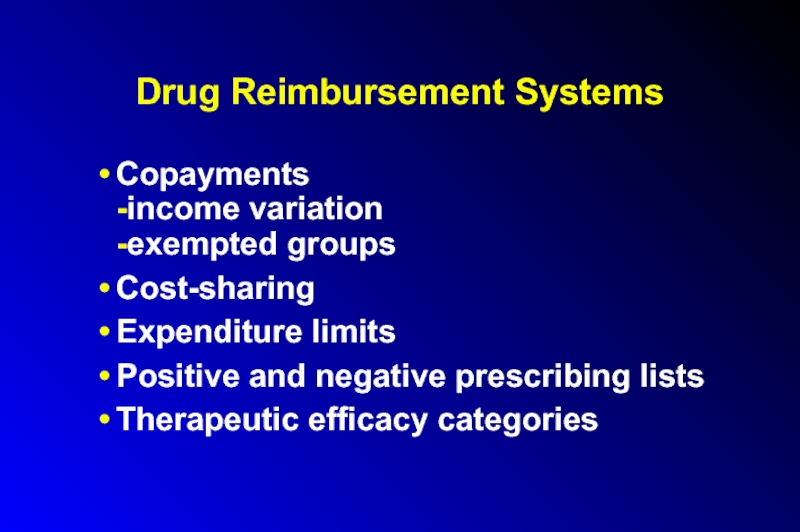
- 37. Drug Reimbursement Systems Copayments -income variation -exempted
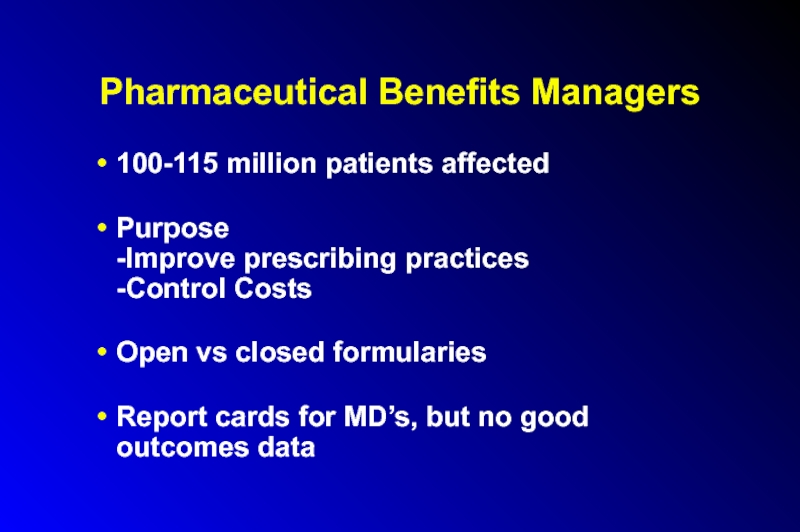
- 38. Pharmaceutical Benefits Managers 100-115 million patients affected
- 39. Pharmaceutical Benefits Manufacturers Data -may not decrease
- 40. Economics 320,000 Jobs (45% increase over last
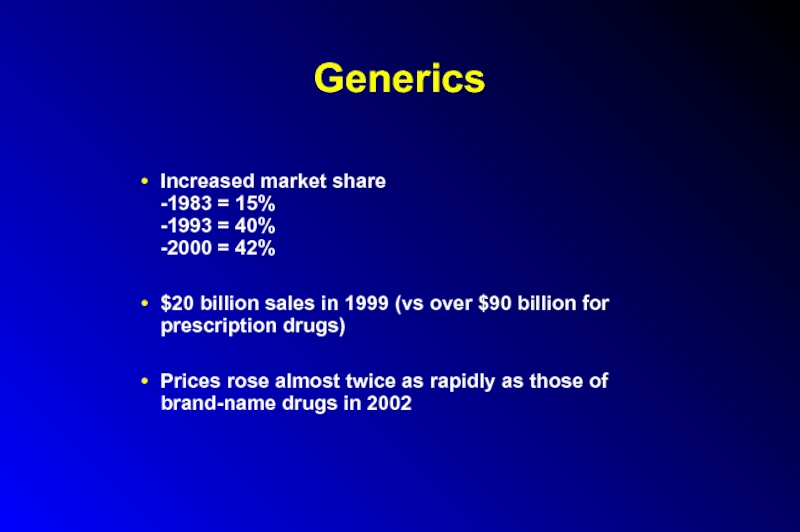
- 41. Generics Increased market share -1983 = 15%
- 42. Generics Avg cost $18 vs $61
- 43. Generics Drug Price Competition and Patent Term
- 44. Over-the-Counter Meds Price per prescription decreases,
- 45. Over-the-Counter Meds OCPs Pharmacist-prescribed emergency contraception reduces number of unintended pregnancies cost saving
- 46. Generics - Litigation Under Hatch-Waxman Law of
- 47. Generics - Litigation Dupont Pharmaceuticals vs Barr
- 48. Lobbying, Patent Extensions and Alternate Formulations
- 49. Lobbying 1998: agribusiness spent $119.3 million lobbying
- 50. Lobbying All industry = $1.2 billion/yr (not
- 51. Pharmaceutical Company Advertising $15 billion/year in 2000
- 52. Pharmaceutical Company Advertising – Drug Samples $8
- 53. Drug Samples Prescription Drug Marketing Act of
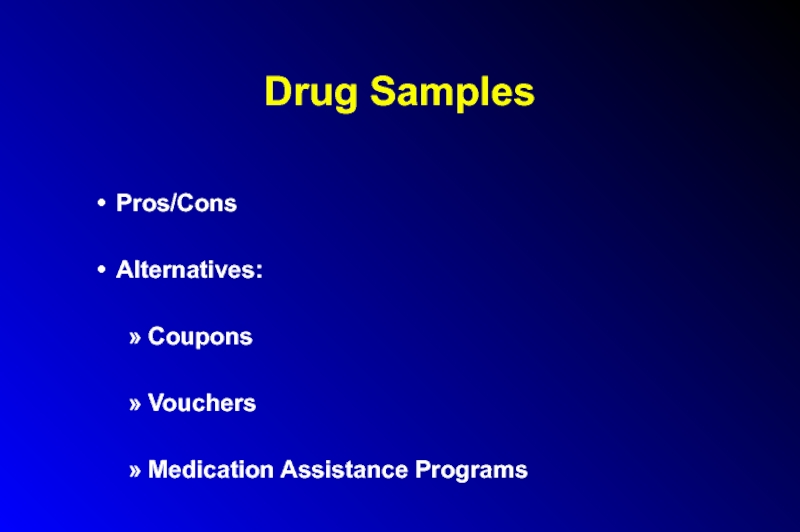
- 54. Drug Samples Pros/Cons Alternatives: Coupons Vouchers Medication Assistance Programs
- 55. Truthfulness in Drug Ads Wilkes et al.
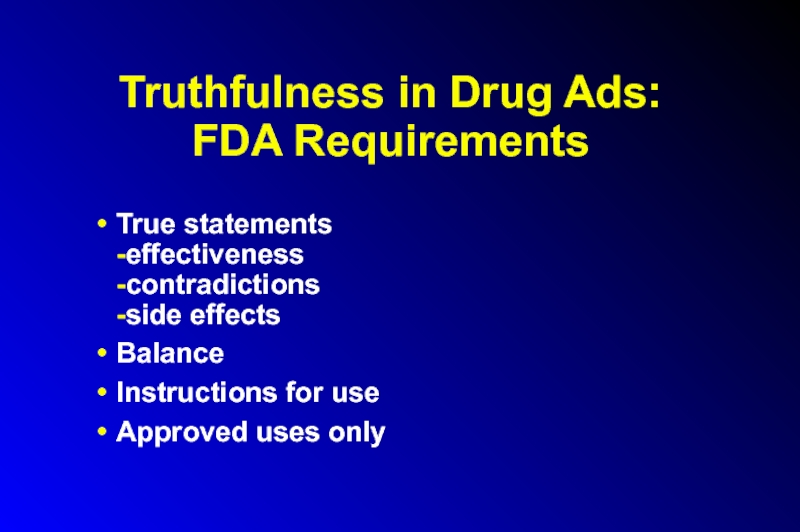
- 56. Truthfulness in Drug Ads: FDA Requirements True
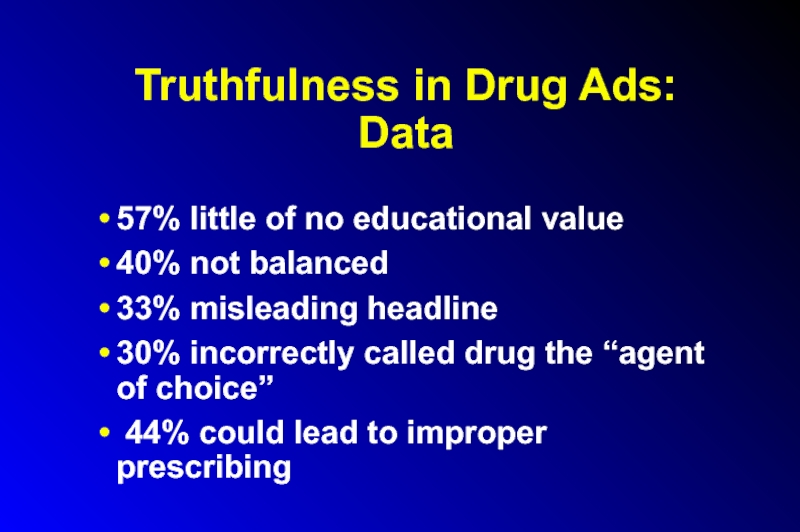
- 57. Truthfulness in Drug Ads: Data 57% little
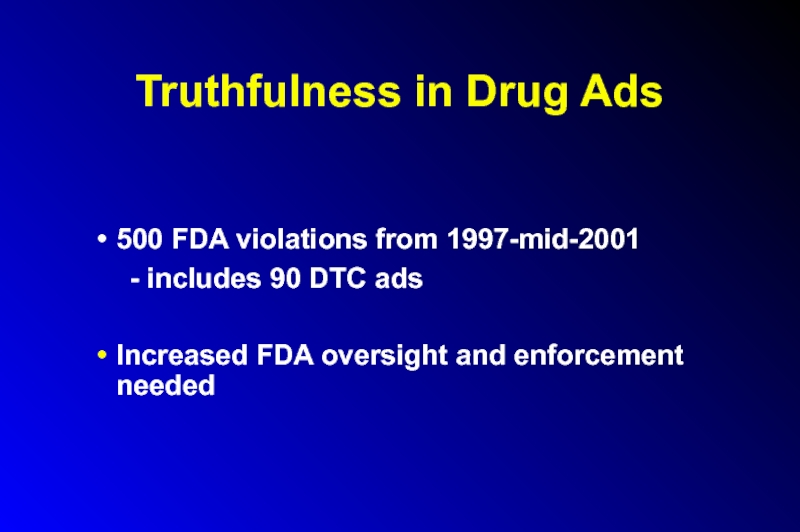
- 58. Truthfulness in Drug Ads 500
- 59. Untruthfulness in Drug Ads: Reasons Advertisement income
- 60. Truthfulness in Drug Ads Higher percentage of
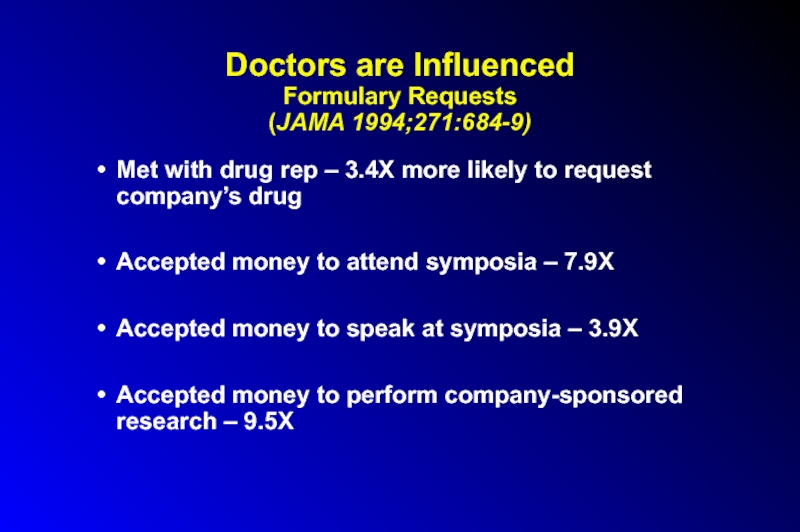
- 61. Doctors are Influenced Formulary Requests (JAMA 1994;271:684-9)
- 62. Dubious Advertising Tactics Sponsored symposia and publications
- 63. Dubious Advertising Tactics Disorders Made
- 64. Direct to Consumer Advertising Began
- 65. Direct to Consumer Advertising US and
- 66. Direct to Consumer Advertising: Use of Celebrities
- 67. Direct to Consumer Advertising Better educated/informed
- 68. Direct to Consumer Advertising Doctors more willing
- 69. Direct to Consumer Advertising Pfizer fined $6
- 70. Direct to Consumer Advertising Manufacturers must disclose
- 71. Direct to Consumer Advertising of Genetic Tests
- 72. Direct to Consumer Advertising of Genetic Tests
- 73. Direct to Consumer Advertising of Genetic Tests
- 74. Direct to Consumer Marketing of High-Tech Screening
- 75. Sources of Accurate and Reliable Drug Information
- 76. Pharmaceutical Industry Research Expensive $150-500 million /
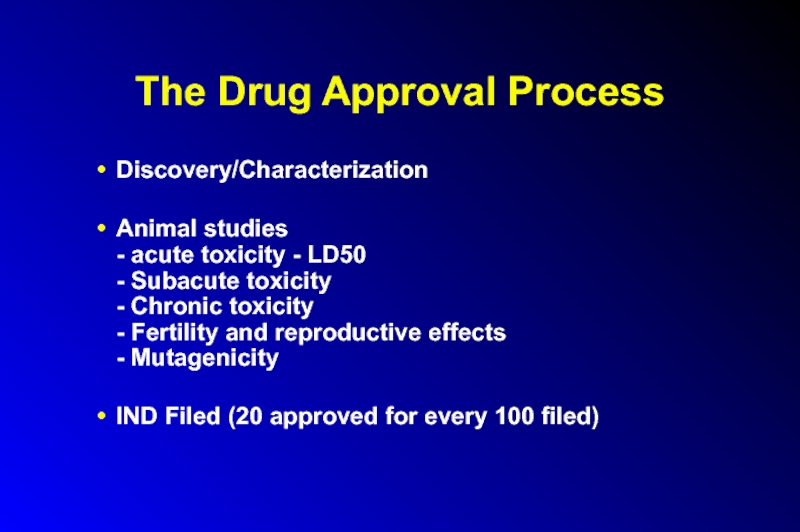
- 77. The Drug Approval Process Discovery/Characterization Animal
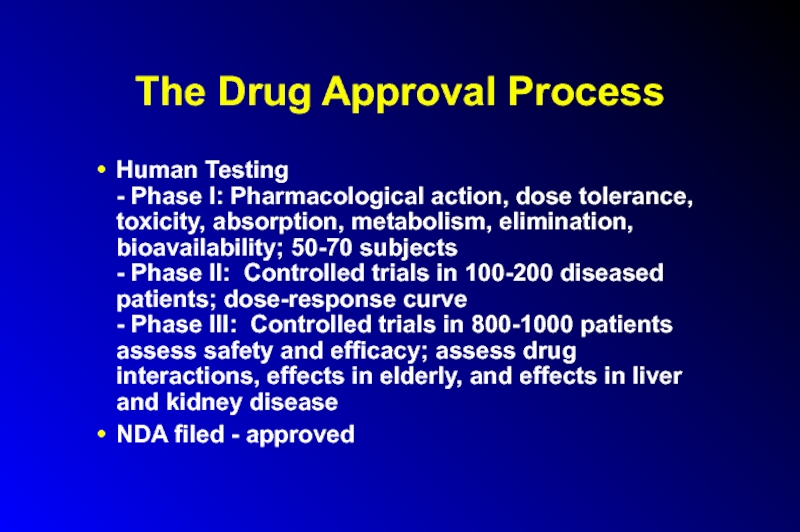
- 78. The Drug Approval Process Human Testing -
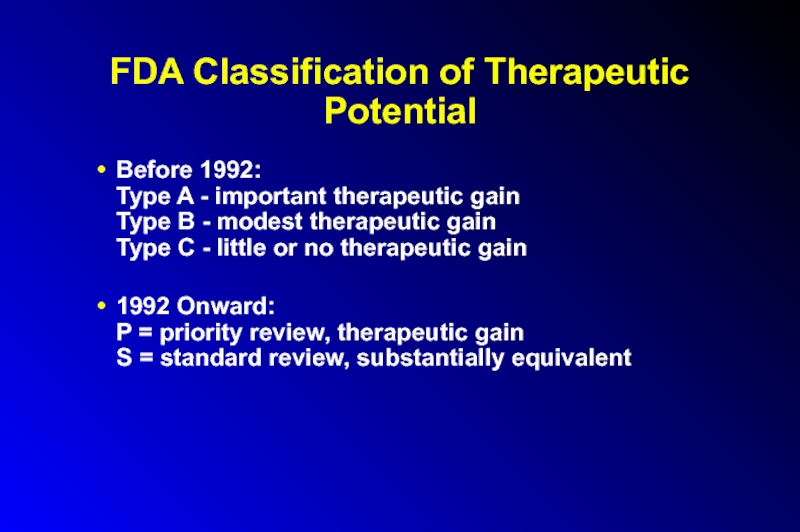
- 79. FDA Classification of Therapeutic Potential Before 1992:
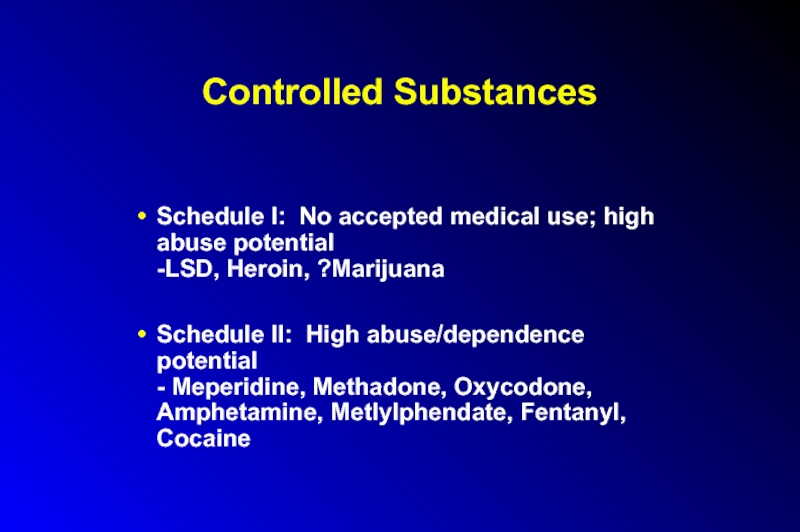
- 80. Controlled Substances Schedule I: No accepted
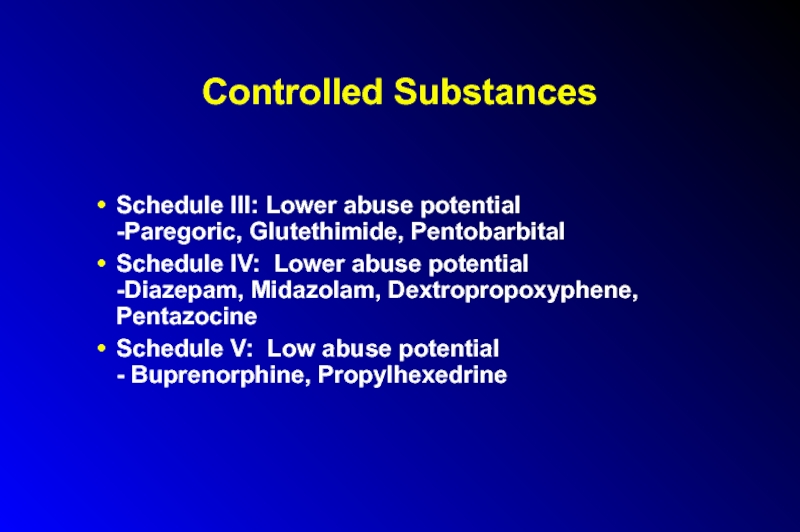
- 81. Controlled Substances Schedule III: Lower abuse
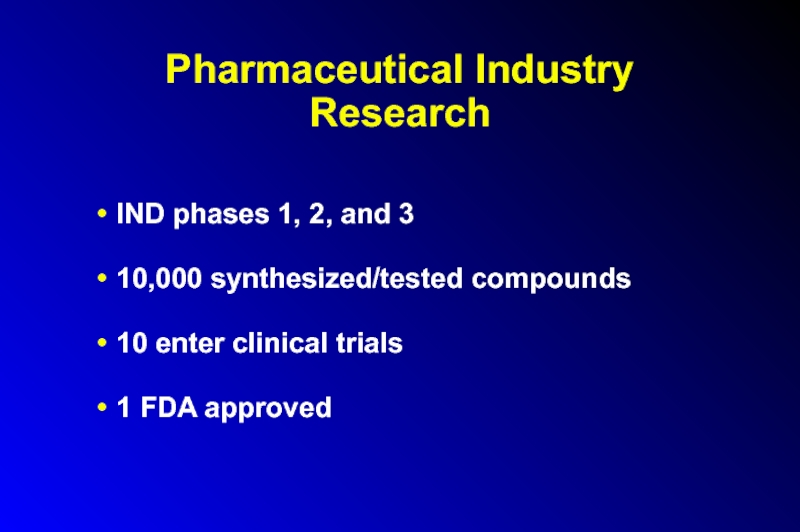
- 82. Pharmaceutical Industry Research IND phases 1, 2,
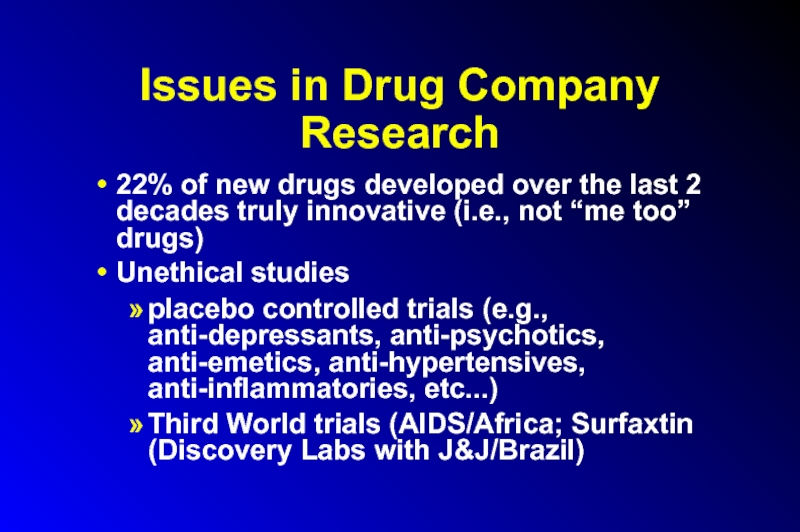
- 83. Issues in Drug Company Research 22% of
- 84. Seeding Trials Sponsored by sales
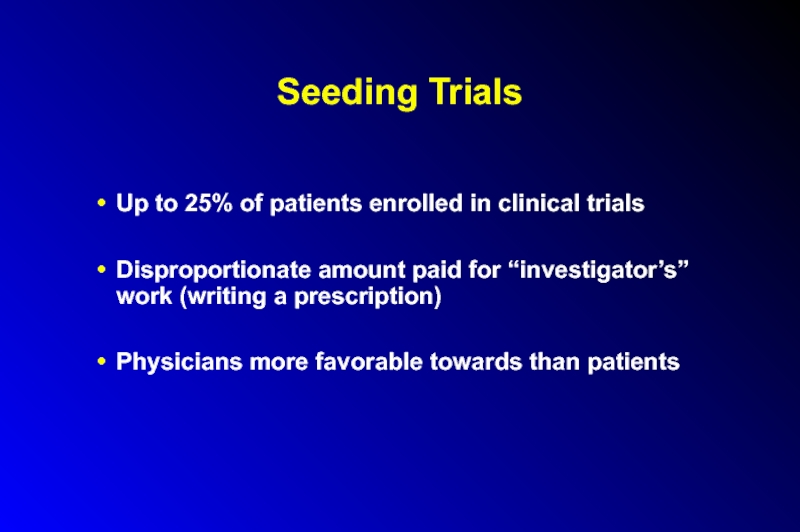
- 85. Seeding Trials Up to 25% of
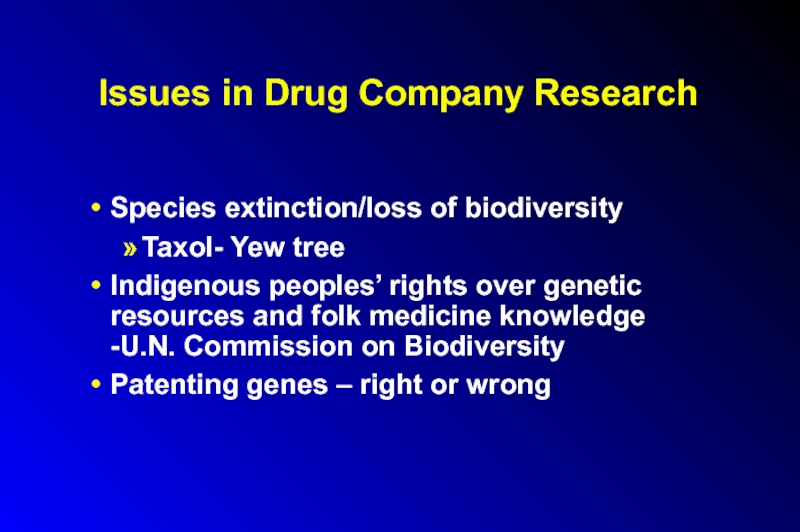
- 86. Issues in Drug Company Research Species extinction/loss
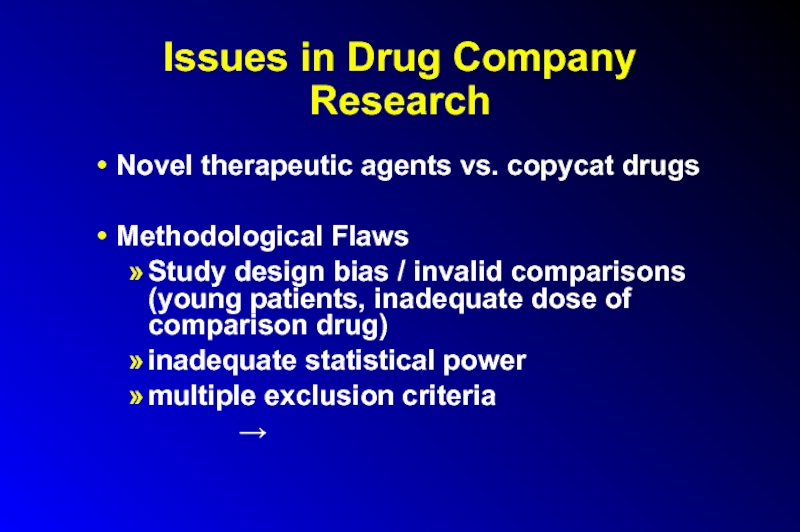
- 87. Issues in Drug Company Research Novel therapeutic
- 88. Issues in Drug Company Research Methodological Flaws
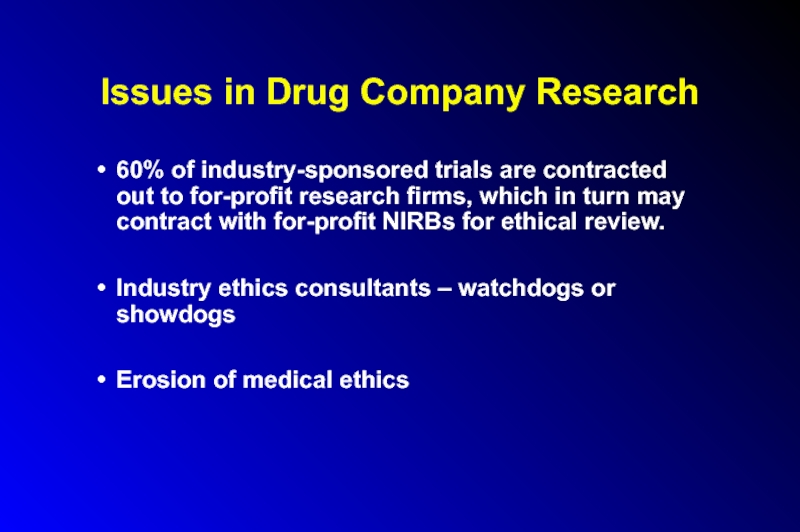
- 89. Issues in Drug Company Research 60% of
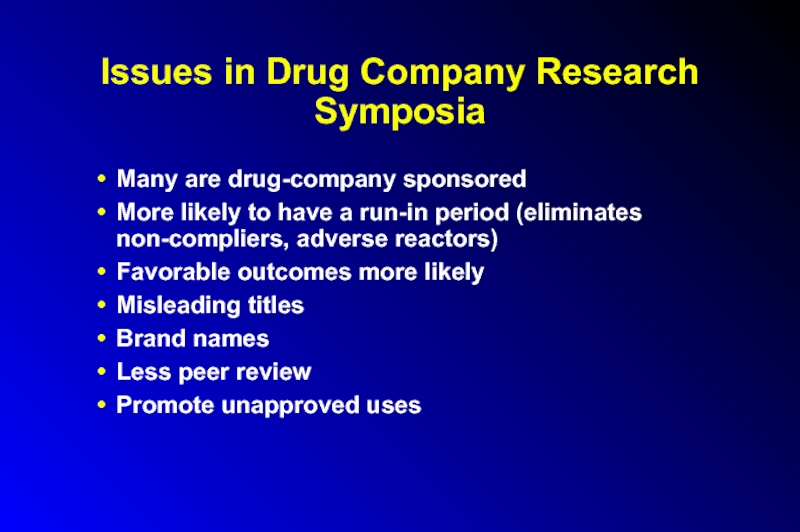
- 90. Issues in Drug Company Research Symposia Many
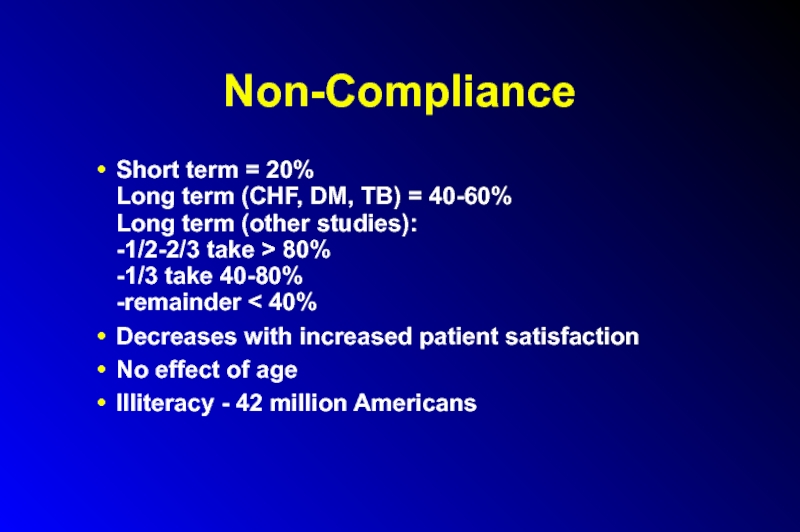
- 91. Non-Compliance Short term = 20% Long term
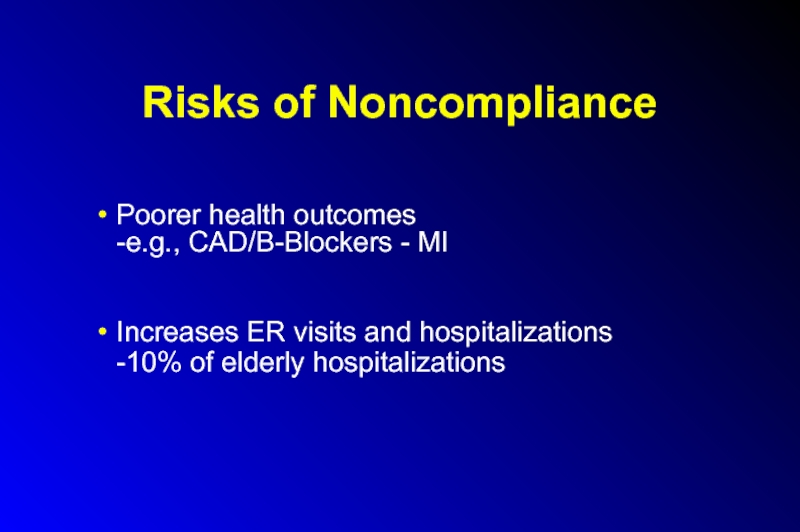
- 92. Risks of Noncompliance Poorer health outcomes -e.g.,
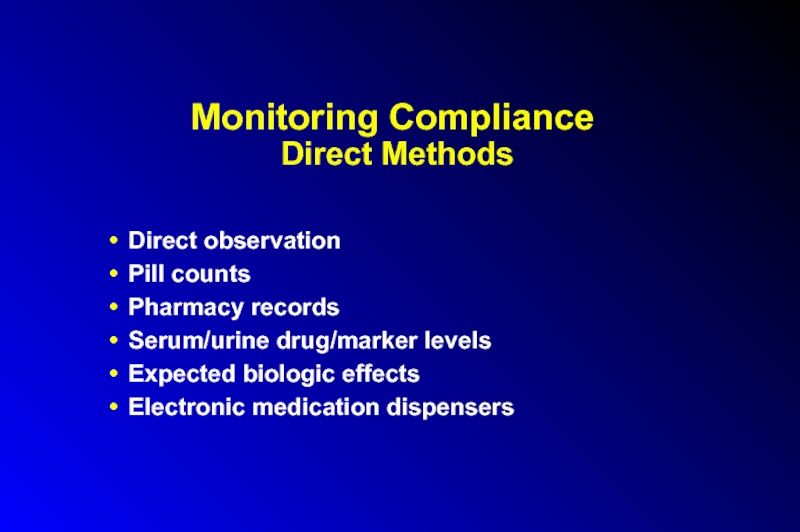
- 93. Monitoring Compliance Direct Methods Direct observation
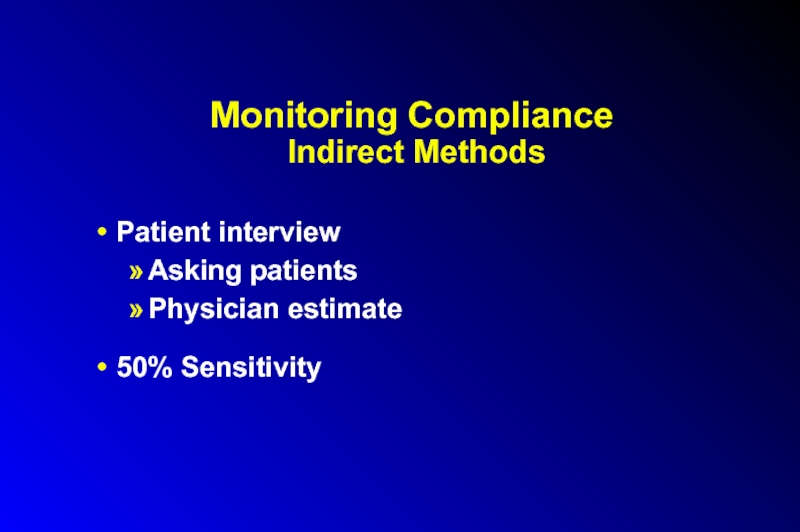
- 94. Monitoring Compliance Indirect Methods Patient
- 95. Reasons for Noncompliance Poor patient education
- 96. Improving Compliance Patient education Patient satisfaction Cost consciousness Eliminate copayments
- 97. Improving Compliance Decrease dosing frequency
- 98. Adverse Drug Events Improper use by patients
- 99. Adverse Drug Events (Harvard Medical Practice Study)
- 100. Adverse Drug Events Error occurred at:
- 101. Adverse Drug Events Analgesics, sedatives, antipsychotics most
- 102. Drug knowledge dissemination Dose and
- 103. Adverse Drug Events: Reasons Allergy missed
- 104. Adverse Drug Events 4th leading cause of
- 105. Alternative Medicine expenditures = $27 billion
- 106. Alternative Medicine Between 1996 and 1998,
- 107. Efficacy of Herbal Products Gingko biloba –
- 108. Efficacy of Herbal Products Saw palmetto –
- 109. Risks Of Herbal And “Naturopathic” Remedies Manufacturer
- 110. Risks Of Herbal And “Naturopathic” Remedies Products unregulated/untested Variable collection processing storage naming purity
- 111. Risks Of Herbal And “Naturopathic” Remedies Adulterants
- 112. Risks Of Herbal And “Naturopathic” Remedies Est.
- 113. Risks of Herbal and “Naturopathic” Remedies Dietary
- 114. Risks of Herbal and “Naturopathic” Remedies
- 115. Risks of Herbal and “Naturopathic” Remedies potentiation
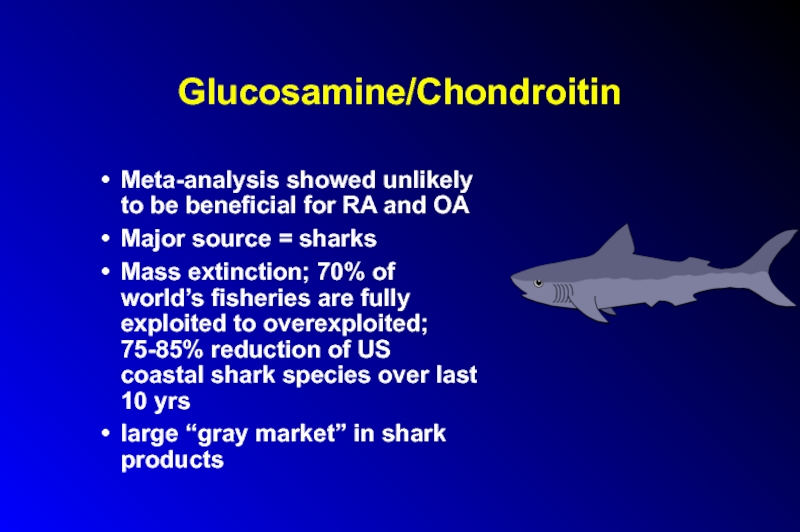
- 116. Glucosamine/Chondroitin Meta-analysis showed unlikely to be beneficial
- 117. Pet Pharmaceuticals $3 billion market Clonicalm
- 118. Blurring the line between drugs and cosmetics
- 119. Botox Botulinum toxin: Cause of botulism potential
- 120. Botox Manufacturer = Allergan 1.6 million patients,
- 121. Botox Most users white, age 35-50 12%
- 122. Botox Retreatments required q 3-4 months Side
- 123. Under- and overuse of antibiotics MDR
- 124. Factory Farms, Antibiotics and Anthrax: Putting Profits Before Public Health Martin Donohoe, MD, FACP
- 125. Outline Factory Farming Agricultural Antibiotics Cipro and Anthrax Bayer Conclusions
- 126. Factory Farming Factory farms have replaced industrial
- 127. Factory Farming Cattle manure 1.2 billion tons
- 128. Factory Farm Waste Overall number of
- 129. Factory Farm Waste Most untreated Ferments
- 130. Agricultural Antibiotic Use Agriculture accounts for 70%
- 131. Consequences of Agricultural Antibiotic Use Campylobacter
- 132. Antibiotic Resistant Pathogens CDC: “Antibiotic use
- 133. Alternatives to Agricultural Antibiotic Use Decrease overcrowding
- 134. Alternatives to Agricultural Antibiotic Use: Vegetarianism ↓
- 135. Alternatives to Agricultural Antibiotic Use: Vegetarianism European
- 136. Food-Borne Illness ¼ of US population affected
- 137. Campylobacter Most common food-borne infection in
- 138. Campylobacter Resistance to Fluoroquinolones Increasing 13% in
- 139. Fluoroquinolones Animal Use Sarafloxacin (Saraflox) – Abbott
- 140. Anthrax Cipro – patent expires 2004 Doxycycline
- 141. Cipro Best selling antibiotic in the world
- 142. Bayer and Cipro 1997 onward – Bayer
- 143. Cost of Cipro Drugstore = $4.50/pill
- 144. Cost of Cipro US government has the
- 145. Why? Weakening of case at WTO meetings
- 146. Other Consequences Opens door to other situations
- 147. Bayer Based in Leverkusen, Germany 120,000
- 148. Bayer Pharmaceuticals Third largest manufacturer of herbicides in the world Dominates insecticide market
- 149. Bayer Number one biotech company in Europe
- 150. History of Bayer WW I: invented modern
- 151. History of Bayer Early 1990s – admitted
- 152. History of Bayer 1995 onward - failed
- 153. History of Bayer 1998 –pays Scottish adult
- 154. History of Bayer 2000 – fined by
- 155. History of Bayer 2001 – FDA-reported violations
- 156. Bayer’s Corporate Agenda Bluewash: signatory to UN’s
- 157. Bayer’s Corporate Agenda Corporate Front Groups: “Global
- 158. Bayer’s Corporate Agenda Lobbying / Campaign donations
- 159. Bayer Fortune Magazine (2001): one of the
- 160. Conclusions Triumph of corporate profits and influence-peddling
- 161. Frankenfoods (aka “Brave New Foods”) Genetically-engineered
- 162. Frankenfoods Bacillus thuringiensis corn - resistant to
- 163. Frankenfoods FDA being sued for allowing genetically-engineered
- 164. Excessive Paper Packaging in Pharmaceutical Samples Paper
- 165. The History of U.S. Drug Regulation
- 166. The History of Drug Regulation 1906: Pure
- 167. The History of U.S. Drug Regulation
- 168. The History of U.S. Drug Regulation Early
- 169. The History of U.S. Drug Regulation
- 170. The History of Drug Regulation 1976: Medical
- 171. The History of U.S. Drug Regulation
- 172. The History of U.S. Drug Regulation ODA:
- 173. The History of U.S. Drug Regulation
- 174. The FDA: Current Issues Nicotine/Cigarette regulation
- 175. The FDA: Current Issues Waiver of
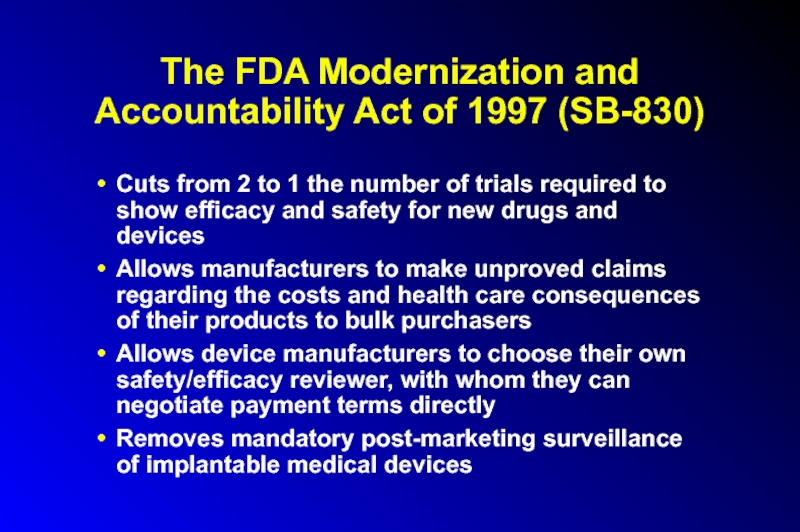
- 176. The FDA Modernization and Accountability Act of
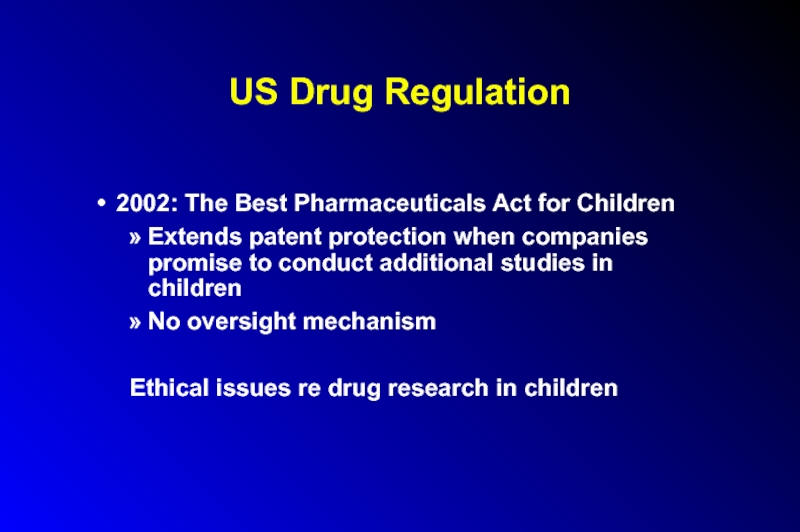
- 177. US Drug Regulation 2002: The Best
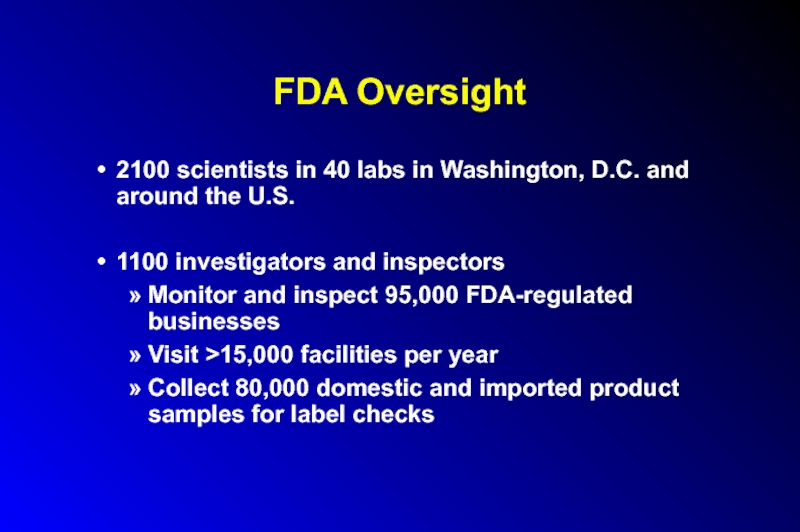
- 178. FDA Oversight 2100 scientists in 40 labs
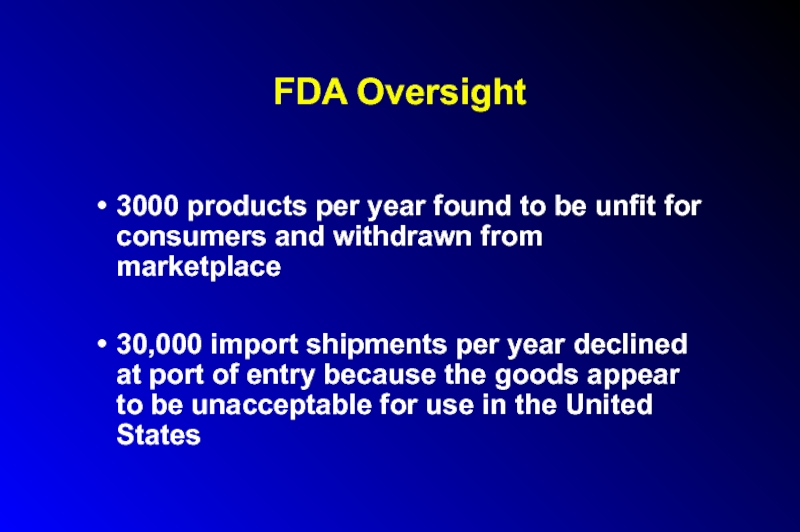
- 179. FDA Oversight 3000 products per year
- 180. FDA Oversight U.S. outpaces Germany and
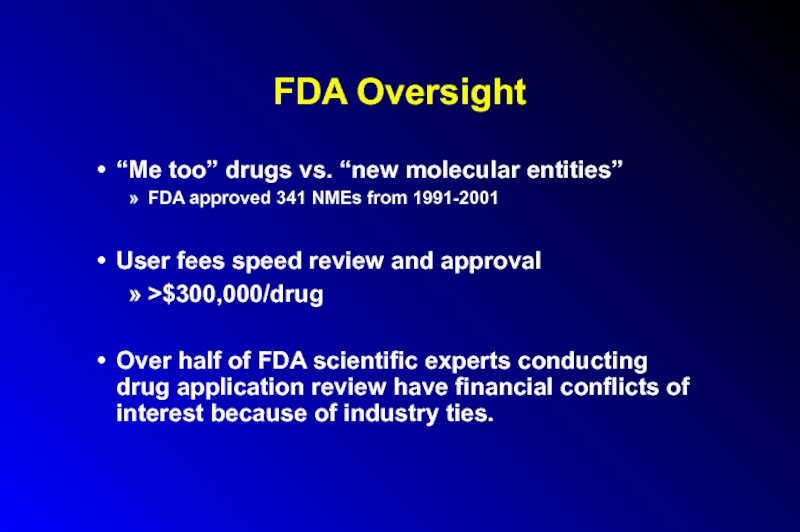
- 181. FDA Oversight “Me too” drugs vs. “new
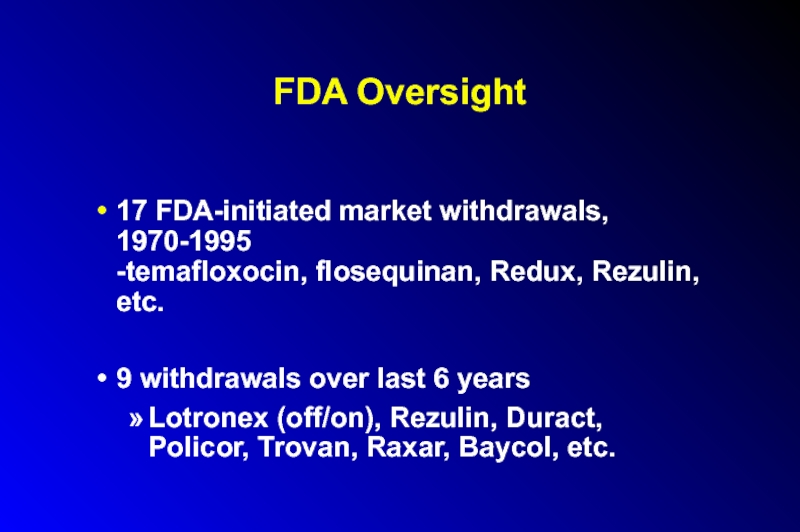
- 182. FDA Oversight 17 FDA-initiated market withdrawals,
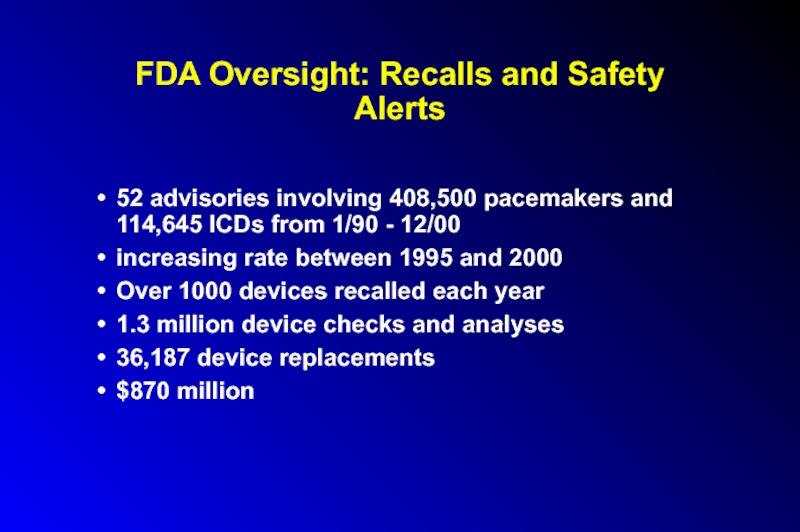
- 183. FDA Oversight: Recalls and Safety Alerts
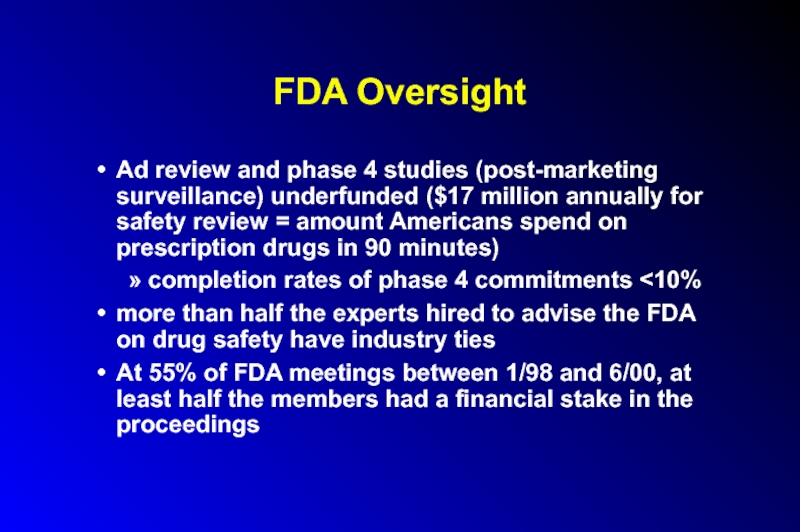
- 184. FDA Oversight Ad review and phase 4
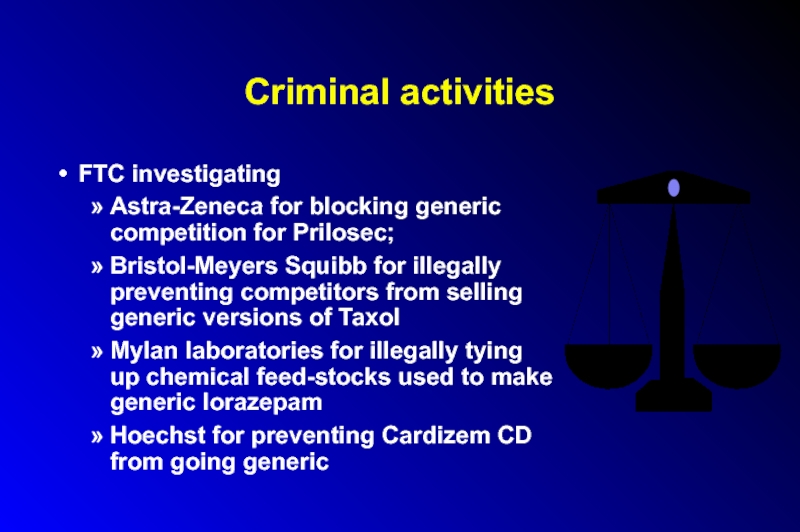
- 185. Criminal activities FTC investigating Astra-Zeneca for blocking
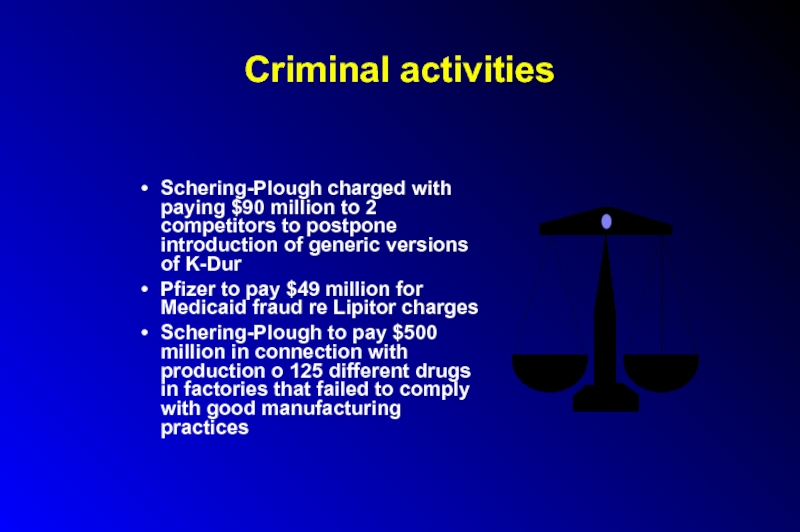
- 186. Criminal activities Schering-Plough charged with paying
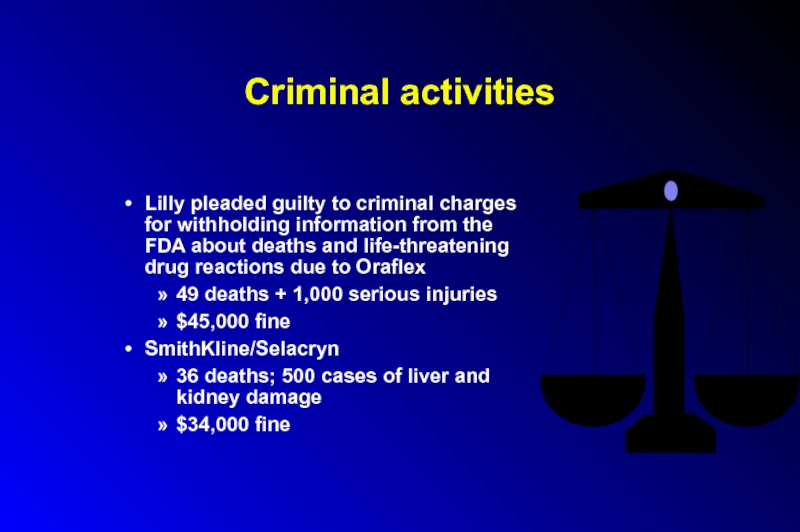
- 187. Criminal activities Lilly pleaded guilty to criminal
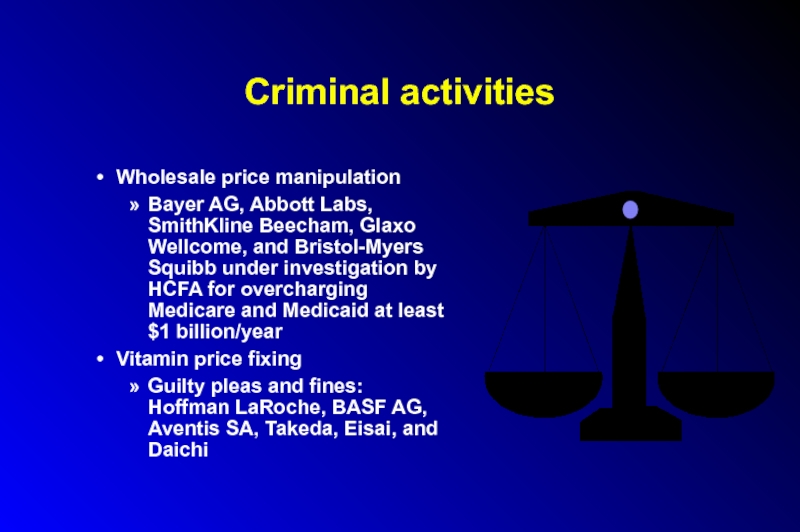
- 188. Criminal activities Wholesale price manipulation Bayer AG,
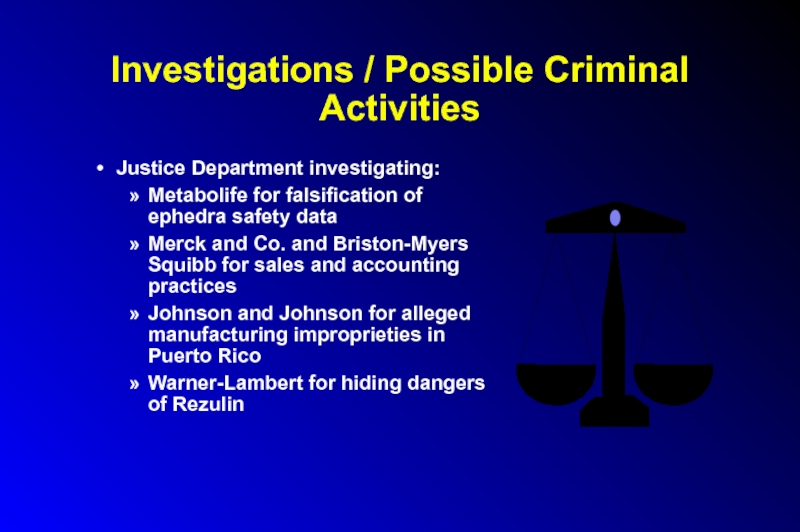
- 189. Investigations / Possible Criminal Activities Justice Department
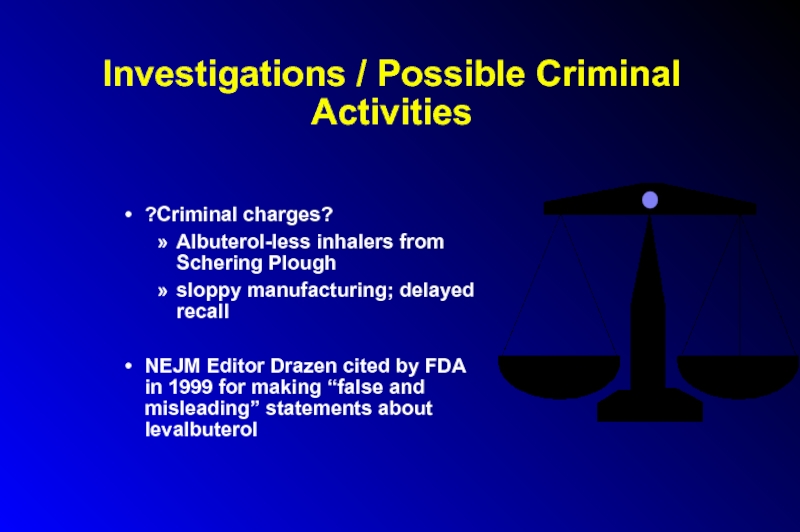
- 190. Investigations / Possible Criminal Activities ?Criminal charges?
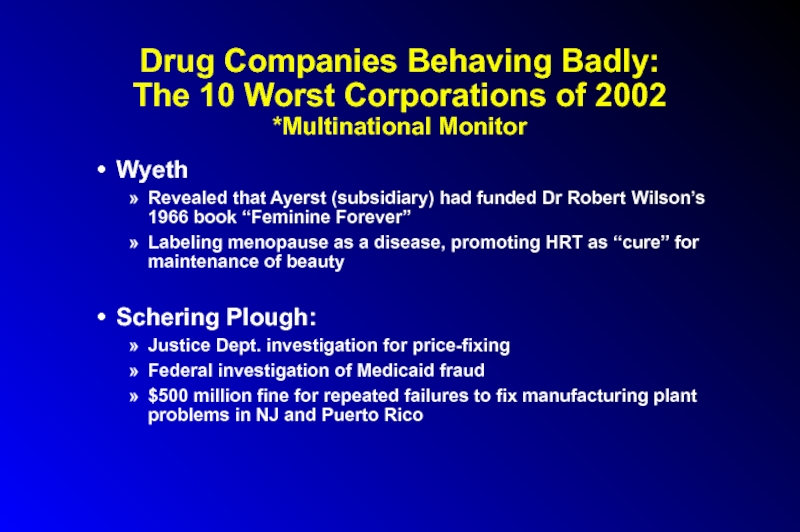
- 191. Drug Companies Behaving Badly: The 10 Worst
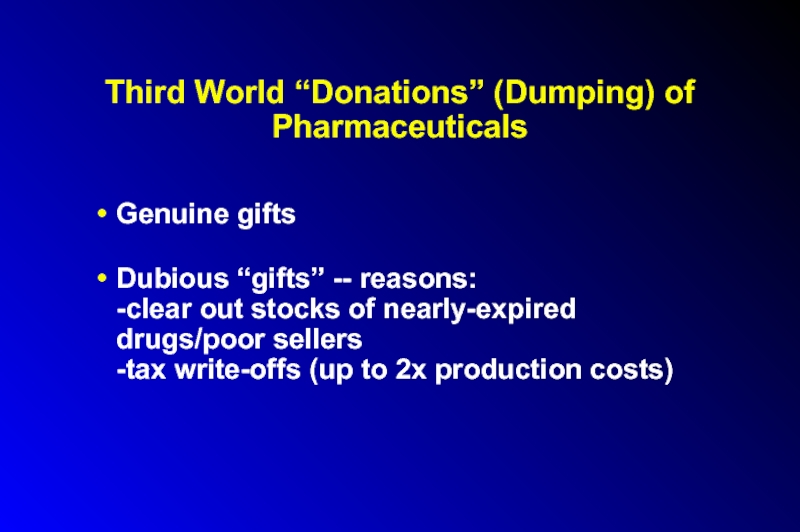
- 192. Third World “Donations” (Dumping) of Pharmaceuticals
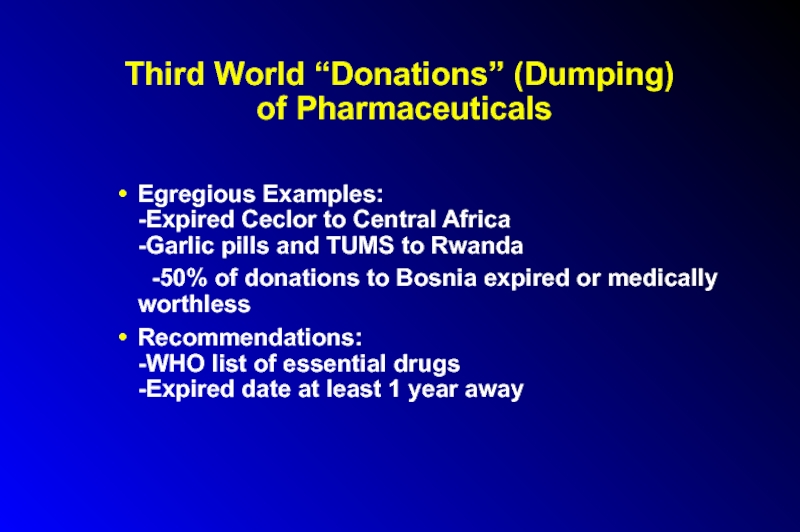
- 193. Third World “Donations” (Dumping) of Pharmaceuticals
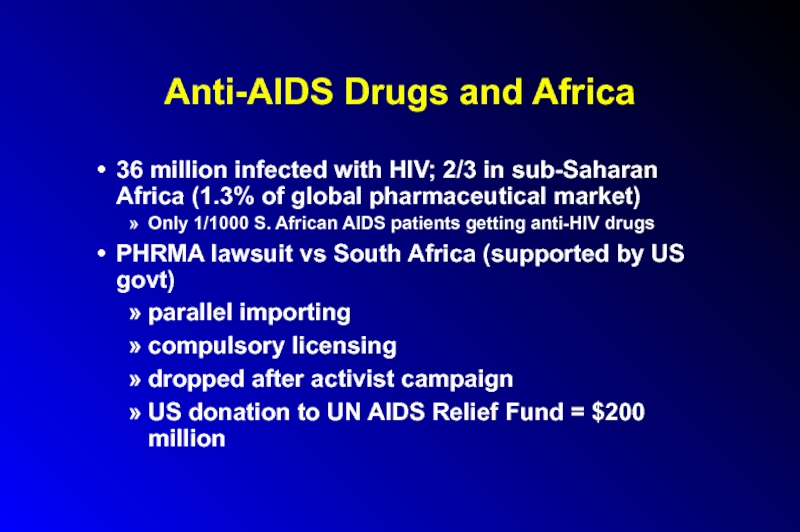
- 194. Anti-AIDS Drugs and Africa 36 million infected
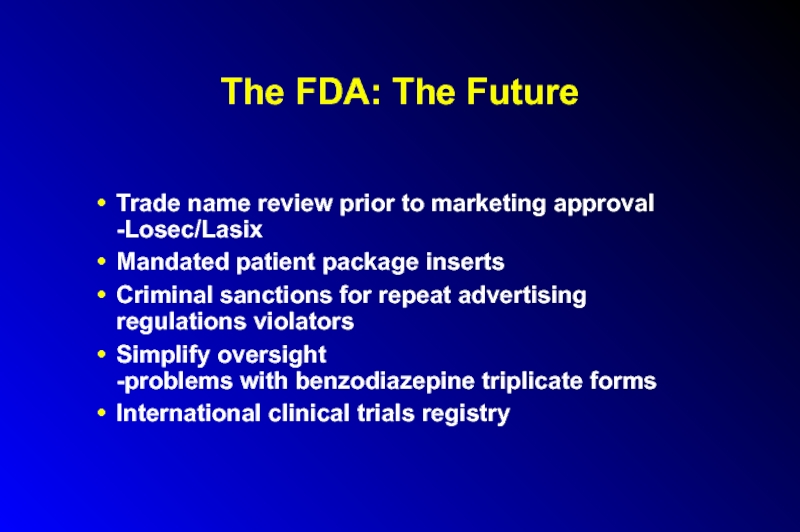
- 195. The FDA: The Future Trade name
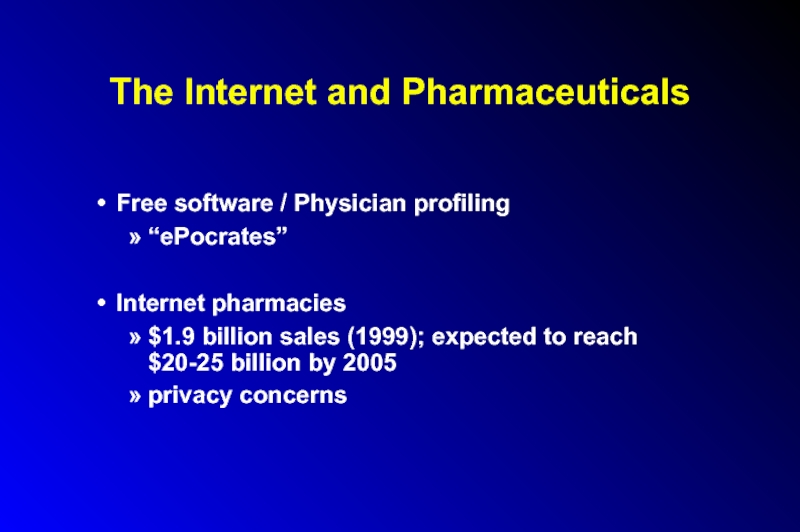
- 196. The Internet and Pharmaceuticals New website
- 197. The Internet and Pharmaceuticals Free software
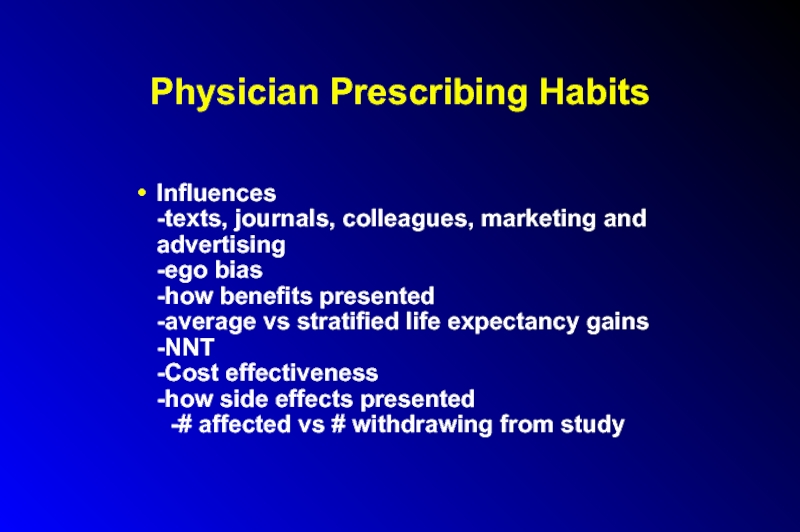
- 198. Physician Prescribing Habits Influences -texts, journals, colleagues,
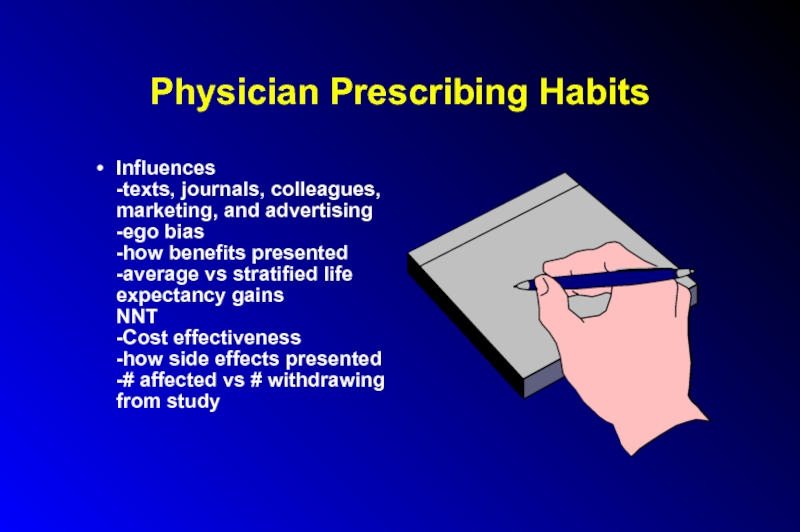
- 199. Physician Prescribing Habits Influences -texts, journals, colleagues,
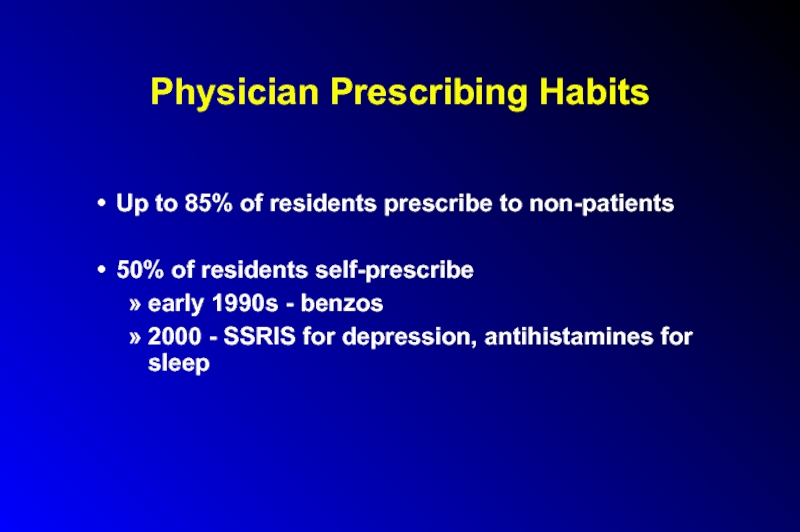
- 200. Physician Prescribing Habits Up to 85%
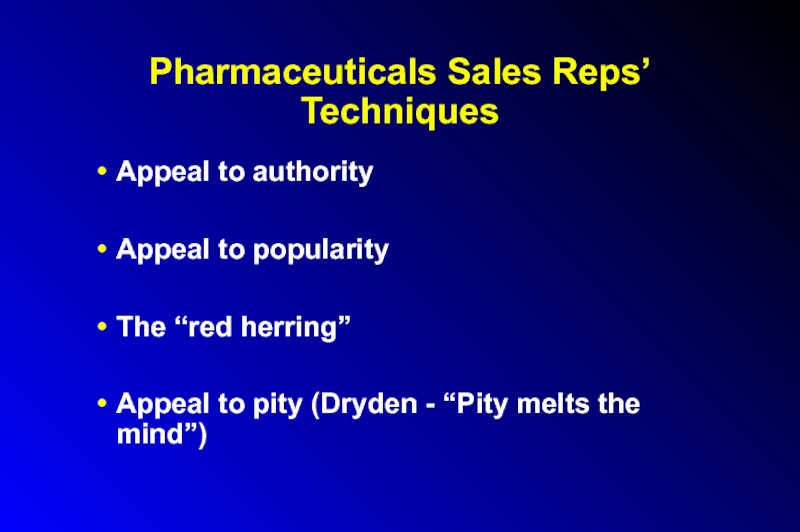
- 201. Pharmaceuticals Sales Reps’ Techniques Appeal to authority
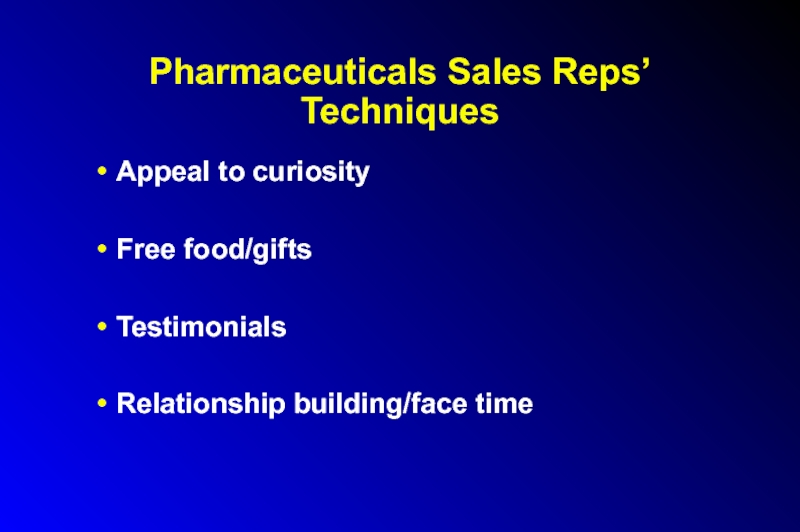
- 202. Pharmaceuticals Sales Reps’ Techniques Appeal to curiosity
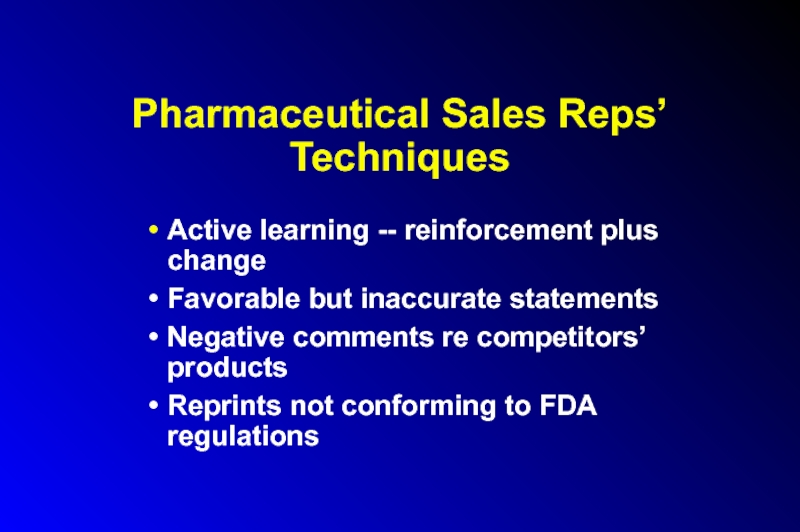
- 203. Pharmaceutical Sales Reps’ Techniques Active learning
- 204. Relating to Pharmaceutical Reps Awareness of sales
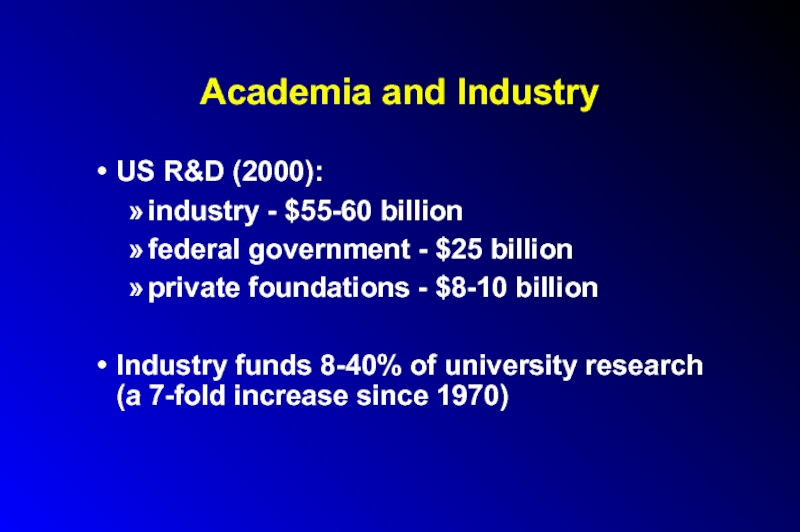
- 205. Academia and Industry US R&D (2000): industry
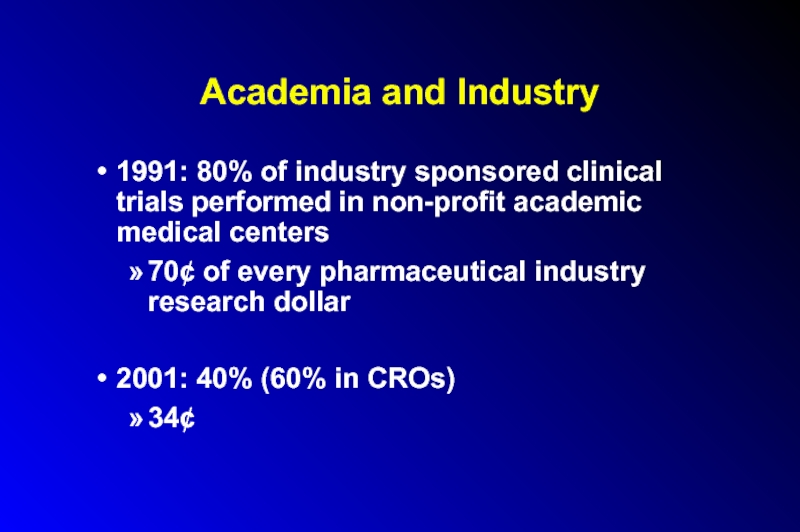
- 206. Academia and Industry 1991: 80% of industry
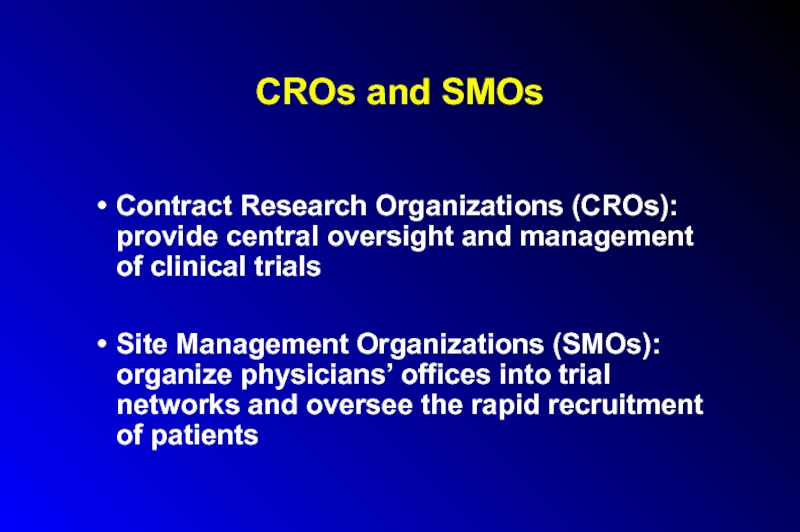
- 207. CROs and SMOs Contract Research Organizations
- 208. Academia and Industry 3-fold increase in
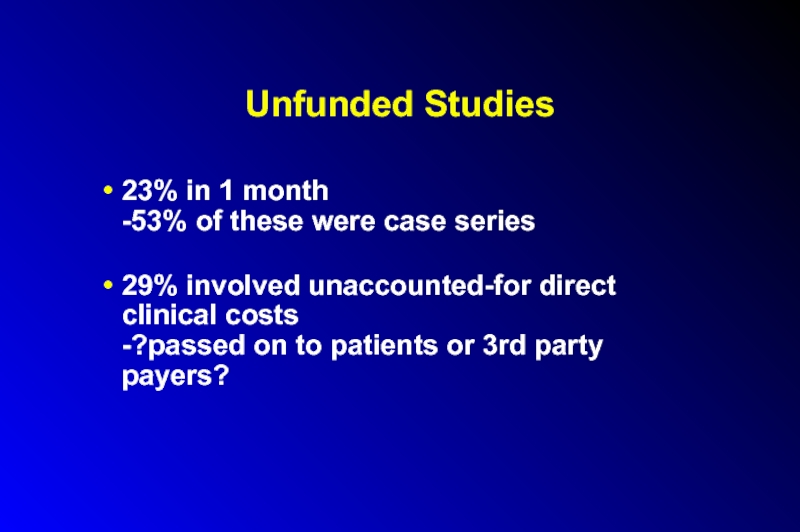
- 209. Unfunded Studies 23% in 1 month -53%
- 210. Academia and Industry Majority of authors
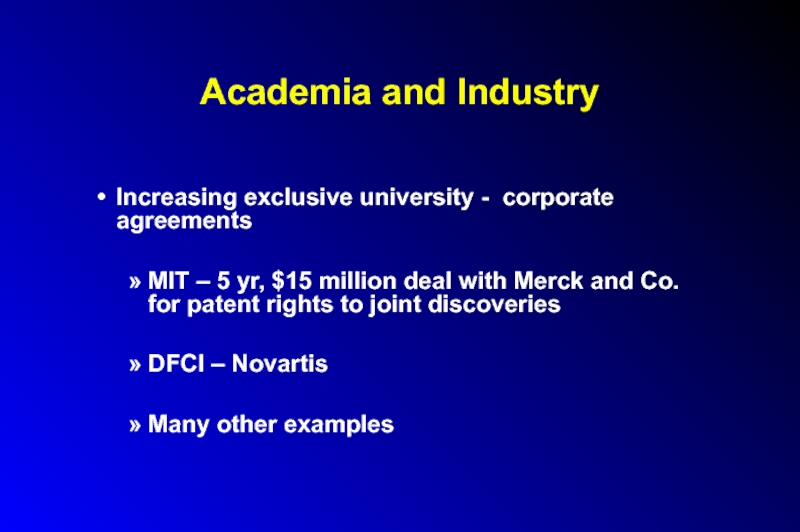
- 211. Academia and Industry Increasing exclusive university
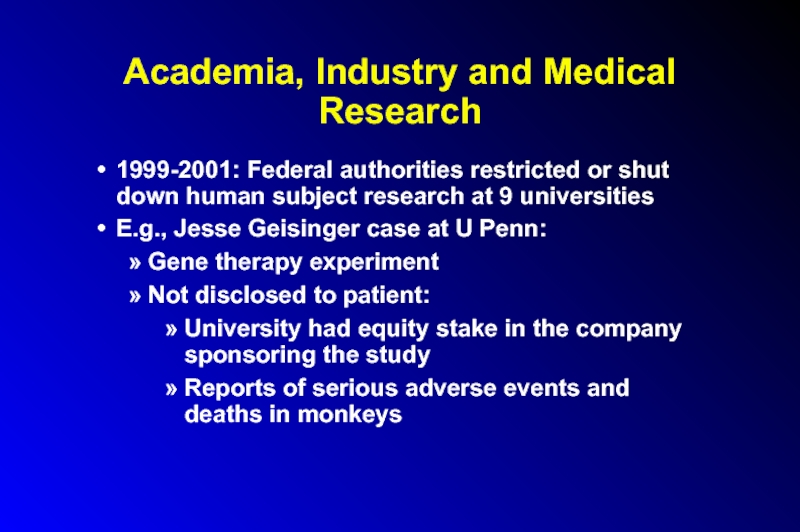
- 212. Academia, Industry and Medical Research 1999-2001: Federal
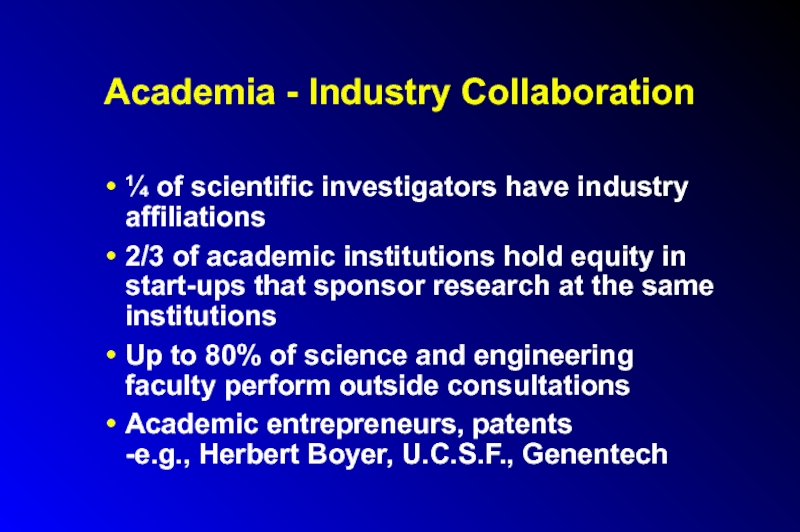
- 213. Academia - Industry Collaboration ¼ of scientific
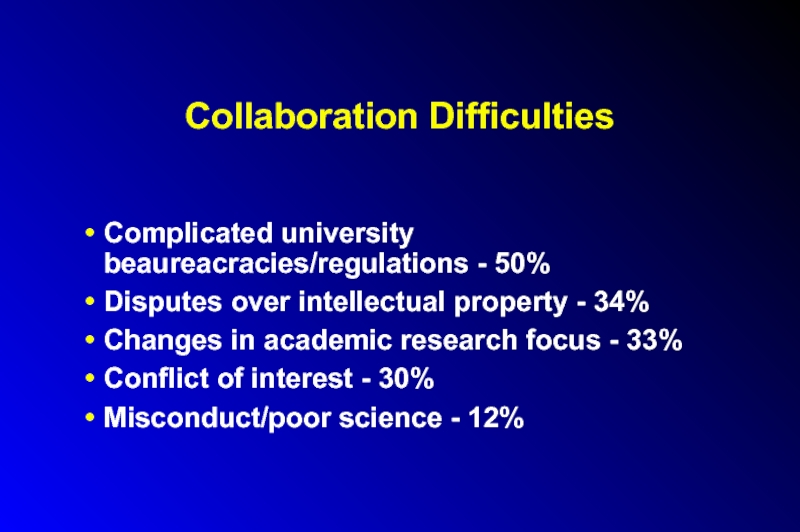
- 214. Collaboration Difficulties Complicated university beaureacracies/regulations -
- 215. Collaboration Difficulties Impaired sharing of knowledge, materials
- 216. Educational Concerns Regarding Industry Funded Research Diversion
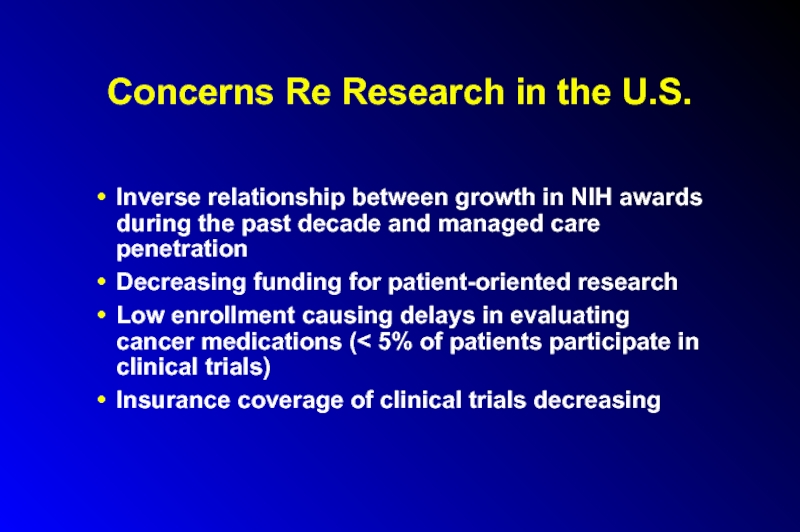
- 217. Concerns Re Research in the U.S.
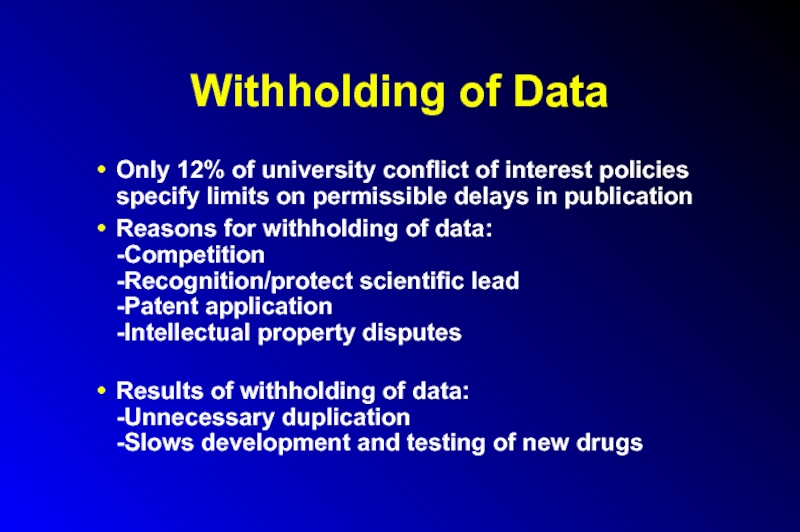
- 218. Withholding of Data Only 12% of
- 219. Withholding of Data: Examples Chamberlin family -
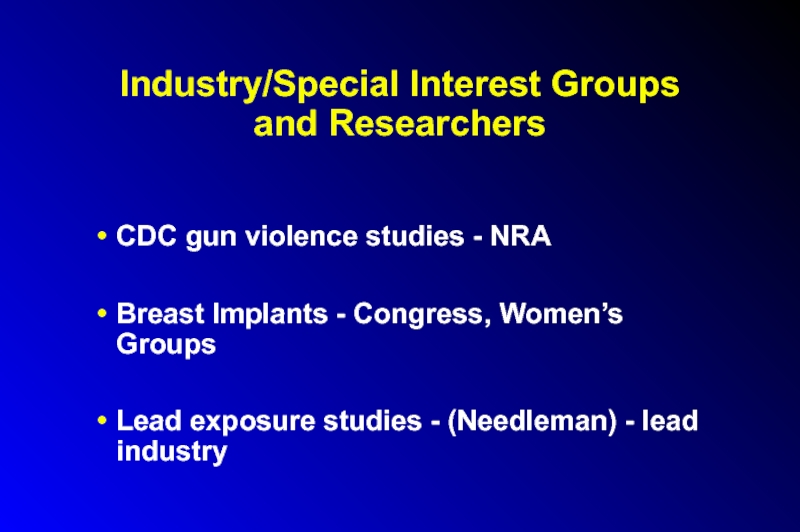
- 220. Industry/Special Interest Groups and Researchers CDC
- 221. Industry/Special Interest Groups and Researchers Spinal fusion
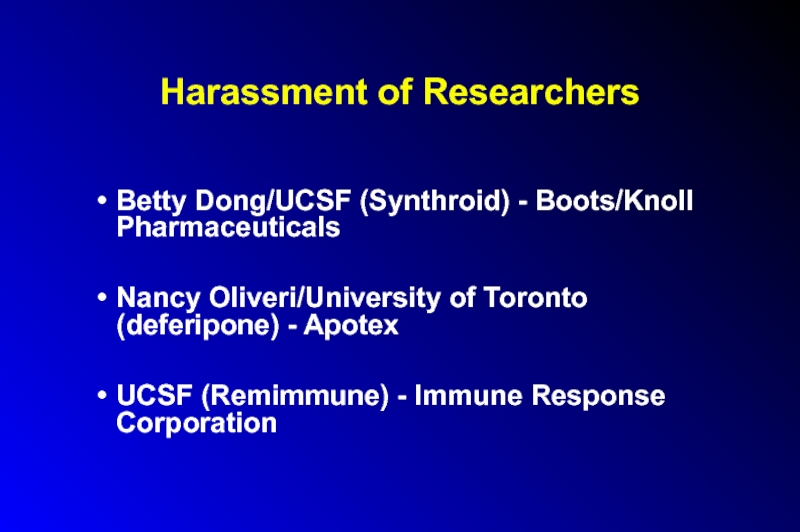
- 222. Harassment of Researchers Betty Dong/UCSF (Synthroid)
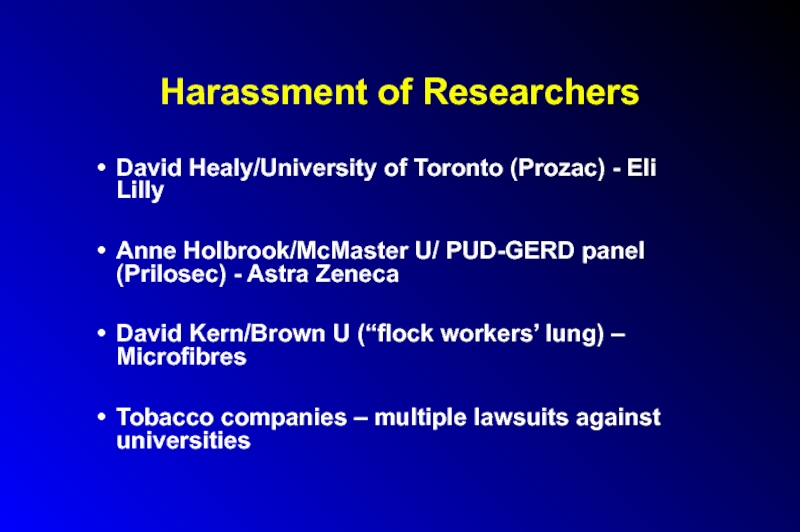
- 223. Harassment of Researchers David Healy/University of Toronto
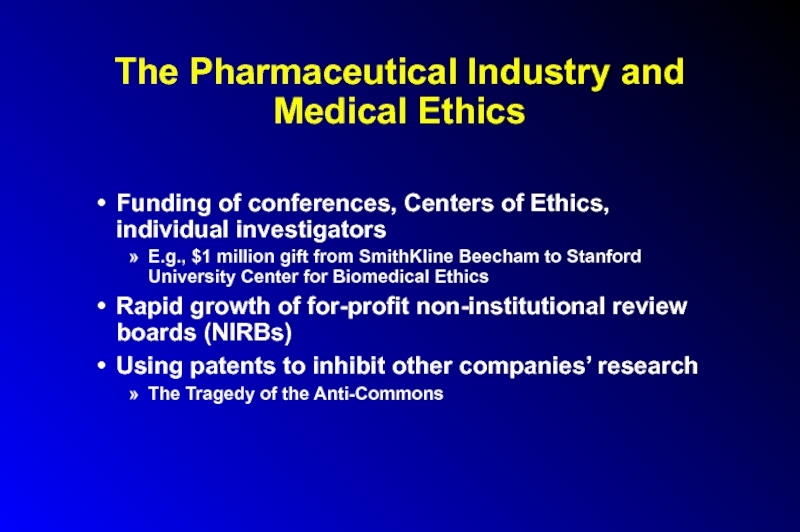
- 224. The Pharmaceutical Industry and Medical Ethics
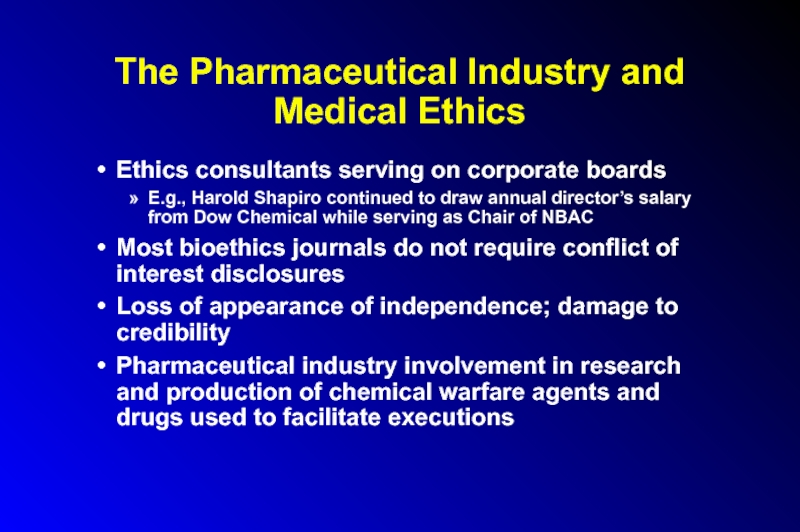
- 225. The Pharmaceutical Industry and Medical Ethics Ethics
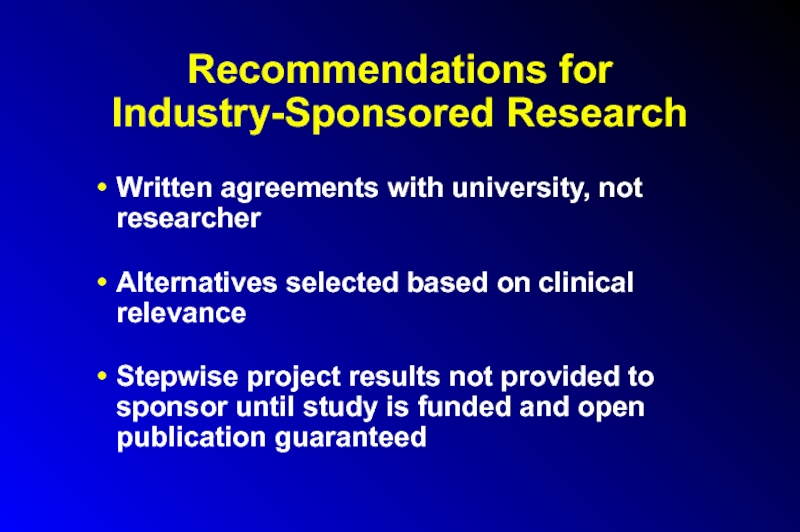
- 226. Recommendations for Industry-Sponsored Research Written agreements with
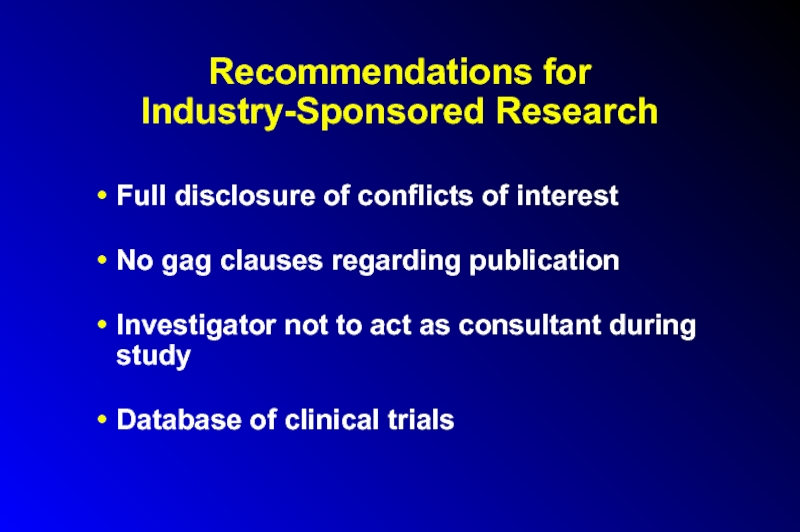
- 227. Recommendations for Industry-Sponsored Research Full disclosure
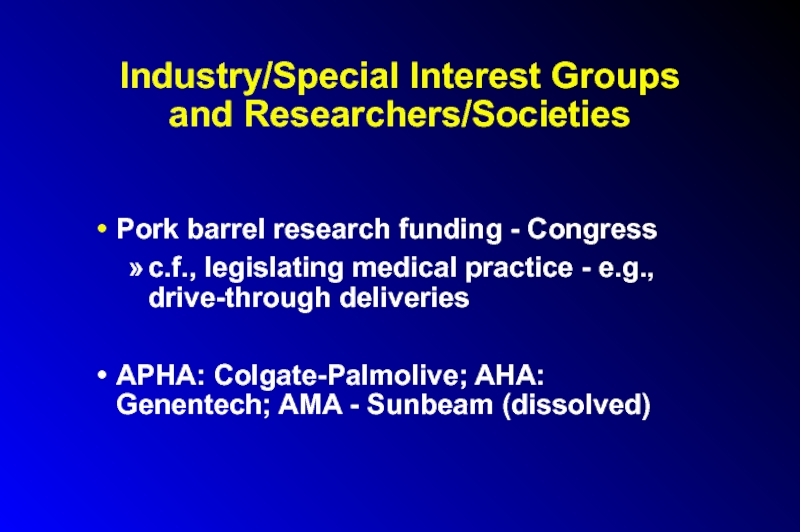
- 228. Industry/Special Interest Groups and Researchers/Societies Pork
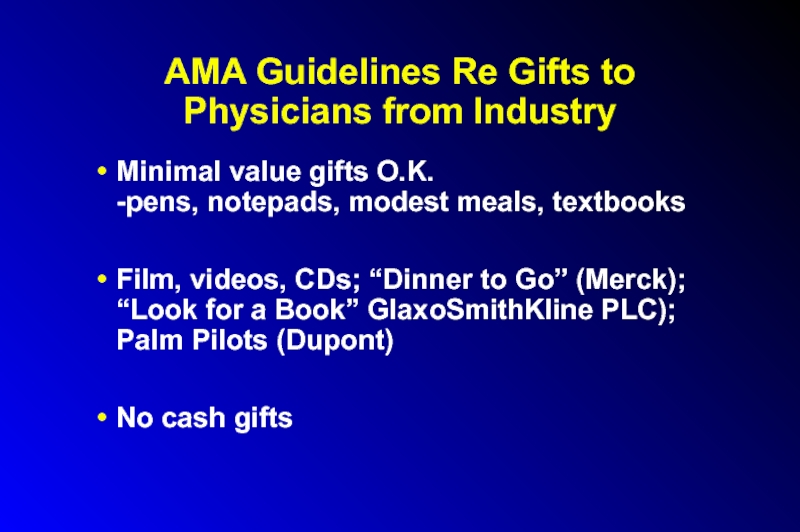
- 229. AMA Guidelines Re Gifts to Physicians from
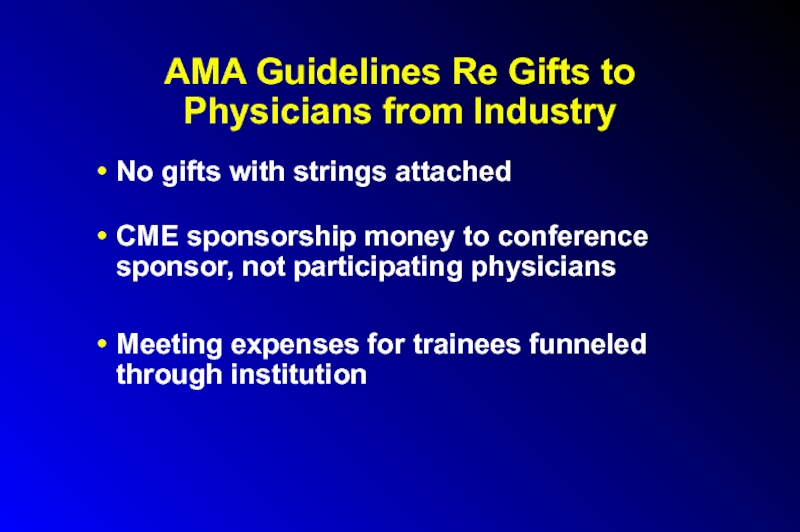
- 230. AMA Guidelines Re Gifts to Physicians from
- 231. AMA Guidelines Re Gifts to Physicians from
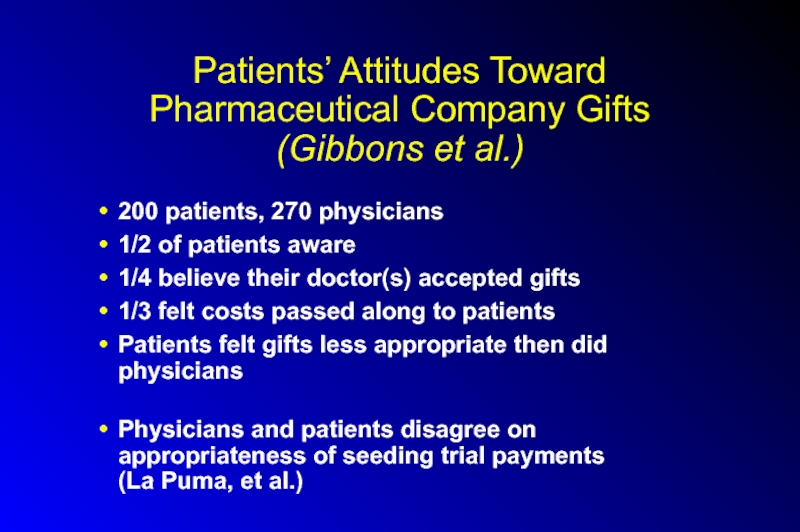
- 232. Patients’ Attitudes Toward Pharmaceutical Company Gifts (Gibbons
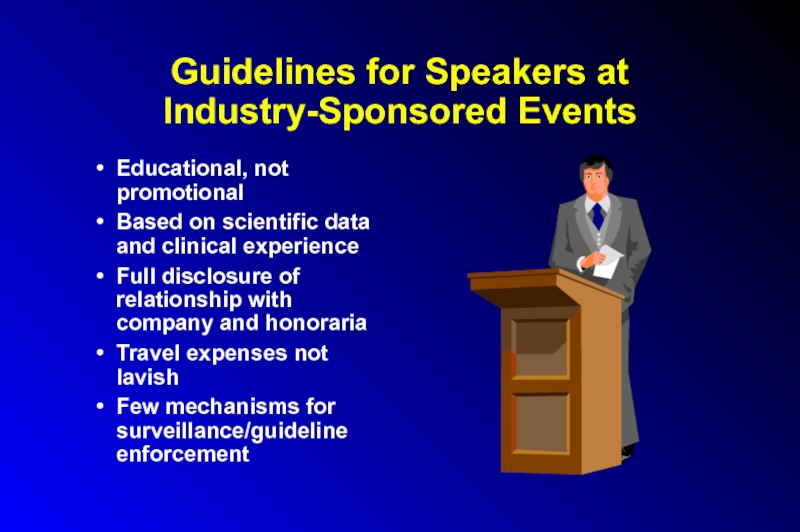
- 233. Guidelines for Speakers at Industry-Sponsored Events
- 234. Trends to Watch For Drug companies
- 235. Trends to Watch For Medical school /
- 236. Human Experimentation: US and Abroad 90% of
- 237. Human Experimentation: US and Abroad Human Experimentation Companies For-Profit IRBs Private-practice-based “investigators”
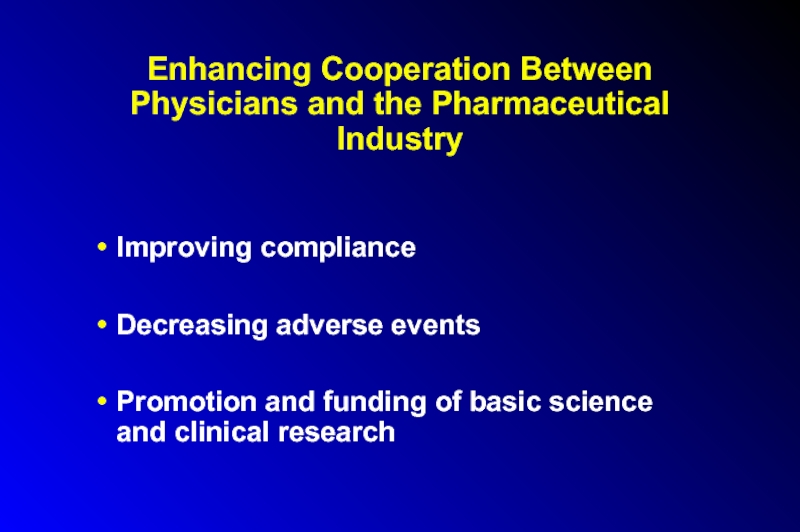
- 238. Enhancing Cooperation Between Physicians and the Pharmaceutical
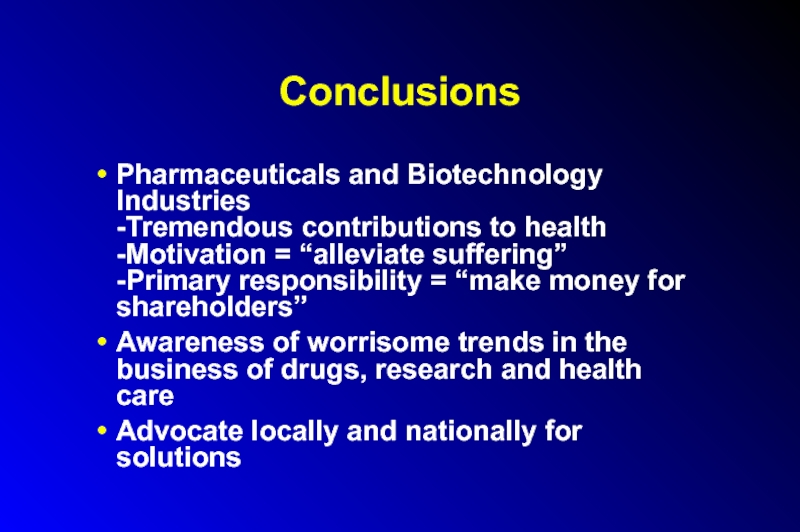
- 239. Conclusions Pharmaceuticals and Biotechnology Industries -Tremendous contributions
- 240. Useful Phone Numbers FDA and Regulated Products
- 241. Contact Information Public Health and Social Justice Website http://www.phsj.org martindonohoe@phsj.org
Слайд 2The Pharmaceutical Industry Outline
Economics
drug costs
drug development
Research
Marketing
Drug Regulation/The FDA
Ethical, Legal and Policy
Issues
Слайд 3Home Care
80-90% of illnesses cared for outside formal health care system
Family
(women), friends, media
Non prescription drug use = 2 x prescription drug use
Non-prescription drug costs = 1/2 prescription drug costs
Non prescription drug use = 2 x prescription drug use
Non-prescription drug costs = 1/2 prescription drug costs
Слайд 4Self Medication
Inappropriate self (and child) medication
- diarrhea
- the common cold
- other
viral infections
Слайд 5Self Medication
Enemas for diarrhea and fever
Mix benadryl and alcohol for insomnia
Educational
brochures have variable effect on use of medical services, including OTC medication
Слайд 6Inappropriate Self-medication: The Common Cold
Greater than 800 OTC medications available
Not beneficial in children under 3 years old, except acetaminophen for very high fevers
1/3 of children less than 3 years old treated
2% received ASA -risk of Reye’s syndrome
Слайд 7Inappropriate Self Medication: Diarrhea
Greater than 100 OTC medications available
15% of children
less than 3 years old treated
Слайд 8
Inappropriate OTC Medication Use in Children
Ineffective
Potential for ADEs and ODs
Profile of
users’ parents:
-better educated
-uninsured
Provider visits reduce use
Provider phone calls do not
-better educated
-uninsured
Provider visits reduce use
Provider phone calls do not
Слайд 9Prescription Drugs
10,000 FDA-approved drugs
70% of all office visits lead to prescriptions
1.5
- 2.0 billion prescriptions/year
Слайд 10Prescription Drugs
>10% of U.S. medical costs
account for 44% of increase in
health care costs in 1999
Слайд 11U.S. Drug Use
81% have used at least one drug in the
preceding week
HTN and HA most common reasons
50% took at least one prescription drug
7% took 5 or more
14% took herbal supplements (16% of prescription drug users)
HTN and HA most common reasons
50% took at least one prescription drug
7% took 5 or more
14% took herbal supplements (16% of prescription drug users)
Слайд 12Prescription Drugs
Over $300/person/year, or $22,500 over a 75-year lifetime
Increased life expectancy
from 55-75 from 1920 to present; decreased morbidity (HTN, DM, BPH, PUD, RA, Psychiatric D/Os)
Cost effectiveness of drugs (cost/QALY < $50,000 for 48-65% of medications)
Cost effectiveness of drugs (cost/QALY < $50,000 for 48-65% of medications)
Слайд 13
Economics of the Pharmaceutical Industry
Worldwide sales > $145 billion/year
US = Largest
markets (40 % of worldwide sales)
Sales for the 10 largest drug companies = $28 billion in 2000, $37 billion in 2001
tax breaks - can deduct marketing and R & D expenses
Sales for the 10 largest drug companies = $28 billion in 2000, $37 billion in 2001
tax breaks - can deduct marketing and R & D expenses
Слайд 14Economics
18.6% profit margin in 1999
16.4% in 2000 ($24 billion)
-Largest of
any industry
-4 times greater than average return of all fortune 500 companies
-8 out of 25 most profitable U.S. companies are pharmaceutical companies
Слайд 15Economics of the Pharmaceutical Industry
Greater than 5000 companies worldwide
-less than 100
companies account for
over 90% of worldwide market
Top 5 companies have market shares of 2.75 - 3.5%
Top 5 companies have market shares of 2.75 - 3.5%
Слайд 16Mergers and Acquisitions
Drug company mergers
- Pfizer-Warner-Lambert, Upjohn-Pharmacia, Glaxo-Wellcome-SmithKliine Beecham, etc.
Pfizer acquired
Pharmacia in 7/02 for $60 billion to become the world’s most powerful drug conglomerate
Слайд 17Mergers and Acquisitions
Acquisition of generic divisions and PBM’s
-Merck-Medco
-Glaxo-Wellcome-Smith-Kline Beecham-DPS
-Lilly - PCS
Health Systems
Acquisitions of health care providers
-Zeneca-Sallick Health Care
Acquisitions of health care providers
-Zeneca-Sallick Health Care
Слайд 18Economics
Sales revenues tripled over last decade
Prices increased 150% (verses 50% CPI
Spending
up 17% from 2000 top 2001
Слайд 19Economics
Average CEO compensation = $20 million (1998)
Pharmaceutical Manufacturer’s Association and Medical
Device Manufacturer’s Association are powerful lobbies
Слайд 20Drug Industry Lobbying
$38 million donated to Congressional campaigns in the 1990s
$84
million in 2000 election (2/3 to Republicans)
GW Bush received $456,000 during his 2000 election campaign
GW Bush received $456,000 during his 2000 election campaign
Слайд 21Drug Industry Lobbying
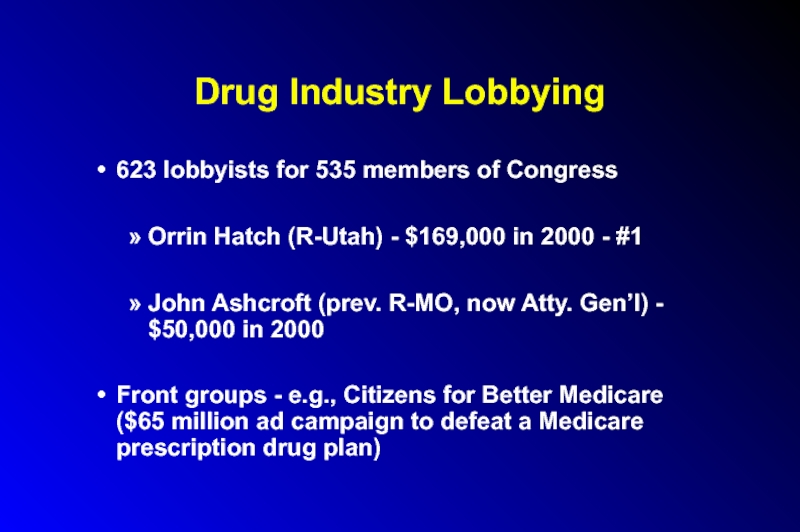
623 lobbyists for 535 members of Congress
Orrin Hatch (R-Utah)
- $169,000 in 2000 - #1
John Ashcroft (prev. R-MO, now Atty. Gen’l) - $50,000 in 2000
Front groups - e.g., Citizens for Better Medicare ($65 million ad campaign to defeat a Medicare prescription drug plan)
John Ashcroft (prev. R-MO, now Atty. Gen’l) - $50,000 in 2000
Front groups - e.g., Citizens for Better Medicare ($65 million ad campaign to defeat a Medicare prescription drug plan)
Слайд 22Drug Costs
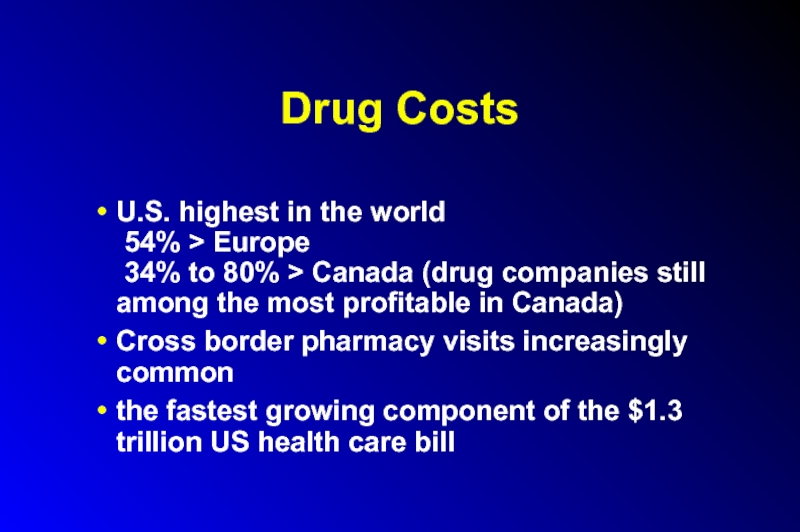
U.S. highest in the world
54% > Europe
34%
to 80% > Canada (drug companies still among the most profitable in Canada)
Cross border pharmacy visits increasingly common
the fastest growing component of the $1.3 trillion US health care bill
Cross border pharmacy visits increasingly common
the fastest growing component of the $1.3 trillion US health care bill
Слайд 23Drug Costs
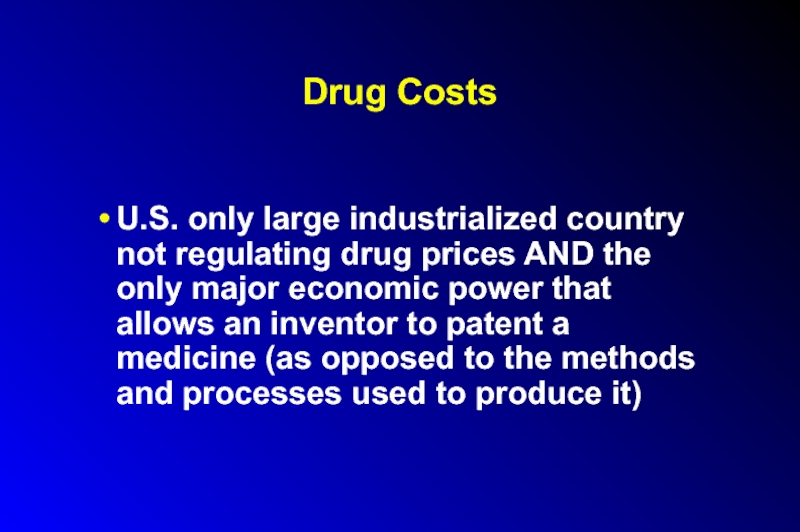
U.S. only large industrialized country not regulating drug prices AND
the only major economic power that allows an inventor to patent a medicine (as opposed to the methods and processes used to produce it)
Слайд 24Drug Pricing Policies and Regulations
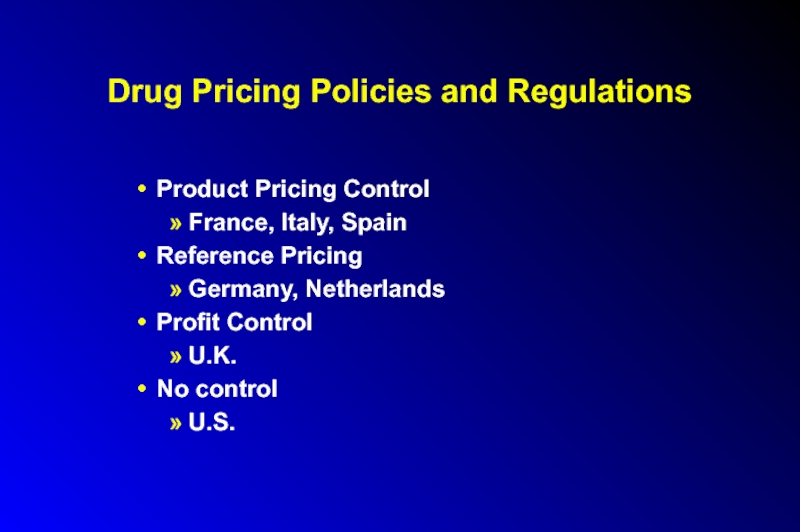
Product Pricing Control
France, Italy, Spain
Reference Pricing
Germany, Netherlands
Profit
Control
U.K.
No control
U.S.
U.K.
No control
U.S.
Слайд 25Decreasing Costs
Formularies
Generics
Volume discounts/mail order prescriptions
Patient activism
-e.g., AIDS/ACT UP
Crossing the border
Illegal to
import prescription drugs, but FDA usually turns a blind eye for 90 day supply or less
Слайд 26
Drugs: Who Pays?
55% out-of-pocket
25% private insurance
17% medicaid
3% Other (VA, Workman’s
Comp, IHS, etc..)
Слайд 27Drug Development: Who Pays?
$20 billion in 1999
Pharmaceutical companies
R & D budget
increasing
U.S. taxpayers
NIH-funded research (total NIH budget = 20.3 billion in 2001)
1995 Reasonable Drug Pricing Clause removed
U.S. taxpayers
NIH-funded research (total NIH budget = 20.3 billion in 2001)
1995 Reasonable Drug Pricing Clause removed
Слайд 28Drug Development Costs
1991 PHRMA study (flawed): up to $800 million per
drug
Other estimate: $300 – 600 million per new drug
2000 Tufts/Public Citizen Reports: $110 million
55% of the research that led to the discovery and development of the top 5 selling drugs of 1995 paid for by the federal government
Other estimate: $300 – 600 million per new drug
2000 Tufts/Public Citizen Reports: $110 million
55% of the research that led to the discovery and development of the top 5 selling drugs of 1995 paid for by the federal government
Слайд 29Where Prescription Dollars Go
Research and development - 12%
-preclinical testing - 6%
-clinical
testing - 6%
Manufacturing and distribution - 24%
Sales and marketing - 26%
Administrative / miscellaneous expenses - 12%
Taxes - 9%
Net profit - 17%
Manufacturing and distribution - 24%
Sales and marketing - 26%
Administrative / miscellaneous expenses - 12%
Taxes - 9%
Net profit - 17%
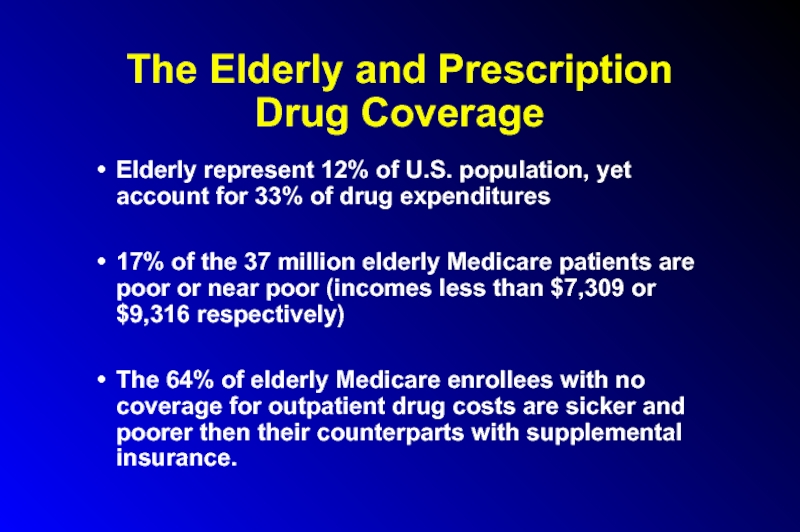
Слайд 30The Elderly and Prescription Drug Coverage
Elderly represent 12% of U.S. population,
yet account for 33% of drug expenditures
17% of the 37 million elderly Medicare patients are poor or near poor (incomes less than $7,309 or $9,316 respectively)
The 64% of elderly Medicare enrollees with no coverage for outpatient drug costs are sicker and poorer then their counterparts with supplemental insurance.
17% of the 37 million elderly Medicare patients are poor or near poor (incomes less than $7,309 or $9,316 respectively)
The 64% of elderly Medicare enrollees with no coverage for outpatient drug costs are sicker and poorer then their counterparts with supplemental insurance.
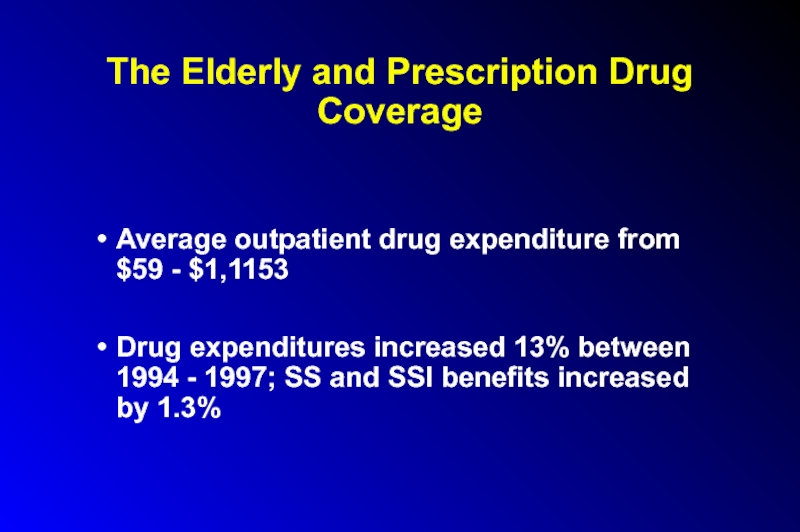
Слайд 31The Elderly and Prescription Drug Coverage
Average outpatient drug expenditure from $59
- $1,1153
Drug expenditures increased 13% between 1994 - 1997; SS and SSI benefits increased by 1.3%
Drug expenditures increased 13% between 1994 - 1997; SS and SSI benefits increased by 1.3%
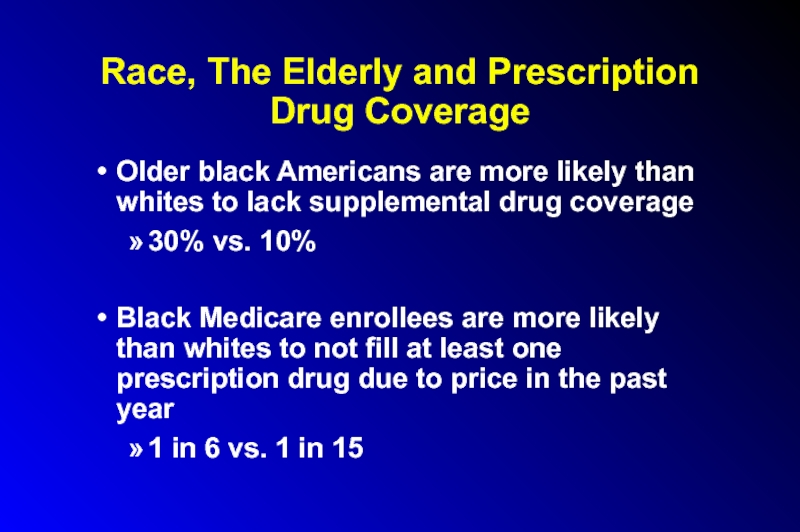
Слайд 32Race, The Elderly and Prescription Drug Coverage
Older black Americans are more
likely than whites to lack supplemental drug coverage
30% vs. 10%
Black Medicare enrollees are more likely than whites to not fill at least one prescription drug due to price in the past year
1 in 6 vs. 1 in 15
30% vs. 10%
Black Medicare enrollees are more likely than whites to not fill at least one prescription drug due to price in the past year
1 in 6 vs. 1 in 15
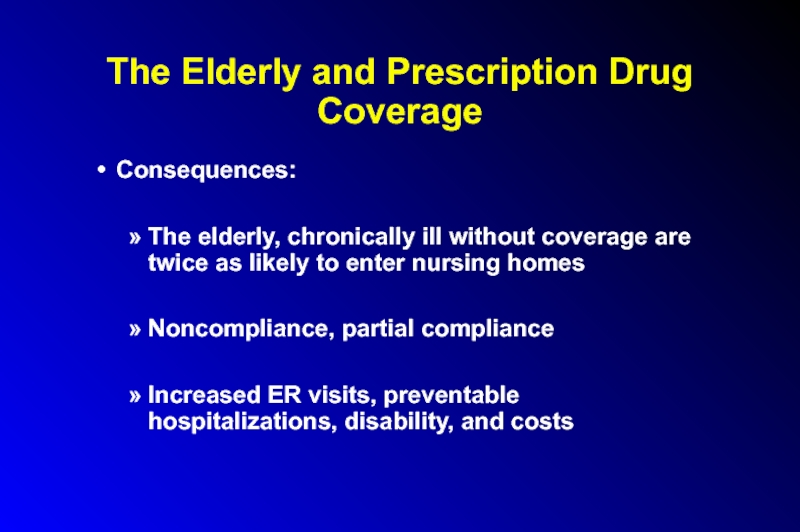
Слайд 33The Elderly and Prescription Drug Coverage
Consequences:
The elderly, chronically ill without coverage
are twice as likely to enter nursing homes
Noncompliance, partial compliance
Increased ER visits, preventable hospitalizations, disability, and costs
Noncompliance, partial compliance
Increased ER visits, preventable hospitalizations, disability, and costs
Слайд 34The Elderly and Prescription Drug Coverage
Universal outpatient drug coverage cost-saving
-pharmaceutical industry
strongly opposed
Bush/Congressional prescription drug benefit proposals woefully inadequate
States trying to decrease costs
State Medicaid budgets in trouble, mostly due to rising drug costs
Bush/Congressional prescription drug benefit proposals woefully inadequate
States trying to decrease costs
State Medicaid budgets in trouble, mostly due to rising drug costs
Слайд 35The Elderly and Prescription Drug Coverage
2001 California Medicare Prescription Drug Discount
Program
75% compliance by pharmacies; only 45% before patient requested discount
Compliance lower in poorer neighborhoods
Important to consider the disabled 14% of Medicare enrollees (different drug use patterns)
75% compliance by pharmacies; only 45% before patient requested discount
Compliance lower in poorer neighborhoods
Important to consider the disabled 14% of Medicare enrollees (different drug use patterns)
Слайд 36Expired Drugs
Initial packaging date usually 2-3 yrs from the date of
manufacture
Pharmacists repackage – new expiration date usually 1 year
Some OK
Not OK:
Epi-pen, ophthalmic agents, others controversial
Pharmacists repackage – new expiration date usually 1 year
Some OK
Not OK:
Epi-pen, ophthalmic agents, others controversial
Слайд 37Drug Reimbursement Systems
Copayments
-income variation
-exempted groups
Cost-sharing
Expenditure limits
Positive and negative prescribing lists
Therapeutic efficacy
categories
Слайд 38Pharmaceutical Benefits Managers
100-115 million patients affected
Purpose
-Improve prescribing practices
-Control Costs
Open vs closed
formularies
Report cards for MD’s, but no good outcomes data
Report cards for MD’s, but no good outcomes data
Слайд 39Pharmaceutical Benefits Manufacturers
Data
-may not decrease costs, due to increased OTC medications
use, longer hospital stays, increased use of other drug categories
Most purchased by pharmaceutical companies -conflict of interest -e.g., increased Merck prescriptions written after acquisition of Medco
Most purchased by pharmaceutical companies -conflict of interest -e.g., increased Merck prescriptions written after acquisition of Medco
Слайд 40Economics
320,000 Jobs
(45% increase over last 10 years)
Increased employment / income
(decreased
for other U.S. manufacturing industries)
Слайд 41Generics
Increased market share
-1983 = 15%
-1993 = 40%
-2000 = 42%
$20 billion sales
in 1999 (vs over $90 billion for prescription drugs)
Prices rose almost twice as rapidly as those of brand-name drugs in 2002
Prices rose almost twice as rapidly as those of brand-name drugs in 2002
Слайд 42Generics
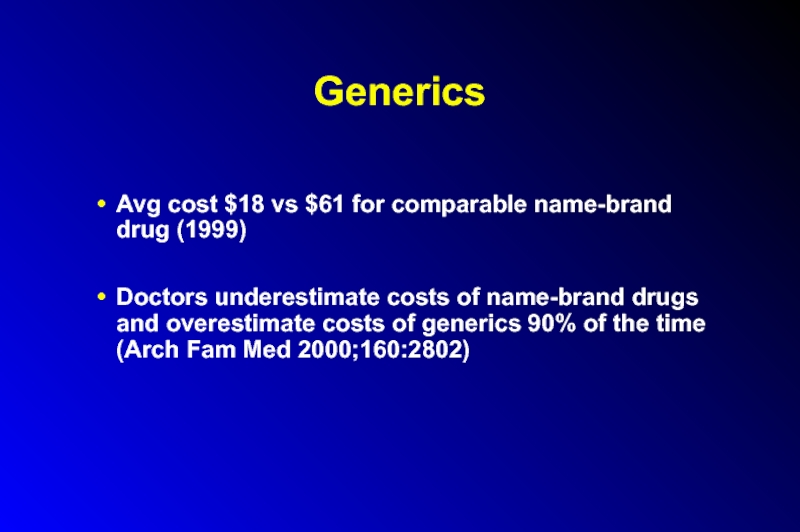
Avg cost $18 vs $61 for comparable name-brand drug (1999)
Doctors underestimate
costs of name-brand drugs and overestimate costs of generics 90% of the time (Arch Fam Med 2000;160:2802)
Слайд 43Generics
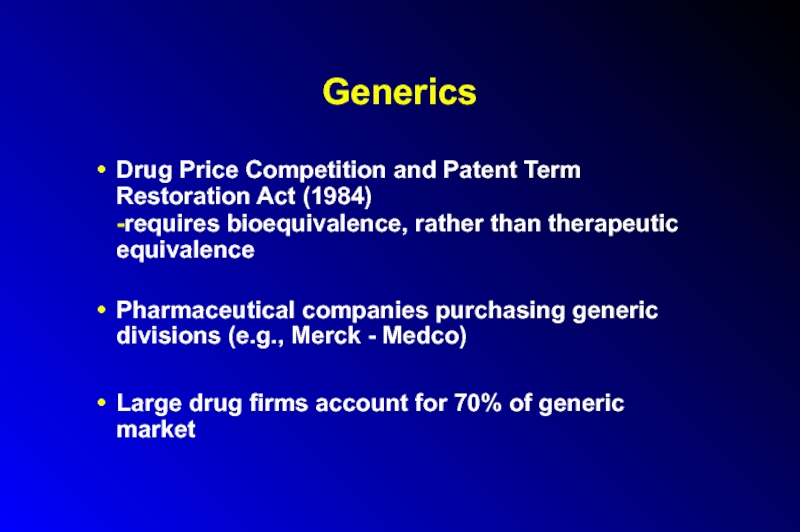
Drug Price Competition and Patent Term Restoration Act (1984)
-requires bioequivalence, rather
than therapeutic equivalence
Pharmaceutical companies purchasing generic divisions (e.g., Merck - Medco)
Large drug firms account for 70% of generic market
Pharmaceutical companies purchasing generic divisions (e.g., Merck - Medco)
Large drug firms account for 70% of generic market
Слайд 44Over-the-Counter Meds
Price per prescription decreases, but insurance won’t cover
Antihistamines: Claritin, Zyrtec,
Allegra
H2 blockers
H2 blockers
Слайд 45Over-the-Counter Meds
OCPs
Pharmacist-prescribed emergency contraception
reduces number of unintended pregnancies
cost saving
Слайд 46Generics - Litigation
Under Hatch-Waxman Law of 1984, lawsuits brought by pharmaceutical
companies against generic manufacturers, whether frivolous or not, can delay FDA approval of generic drug by 30 months
73% of cases won by brand name companies
73% of cases won by brand name companies
Слайд 47Generics - Litigation
Dupont Pharmaceuticals vs Barr Laboratories:
Coumadin/warfarin
Novartis vs Sangstat
Neoral/cyclosporine A
Zenith Goldline
Pharmaceuticals vs Abbott Labs
terazosin/Hytrin; $1 million/day
terazosin/Hytrin; $1 million/day
Слайд 48Lobbying, Patent Extensions and Alternate Formulations
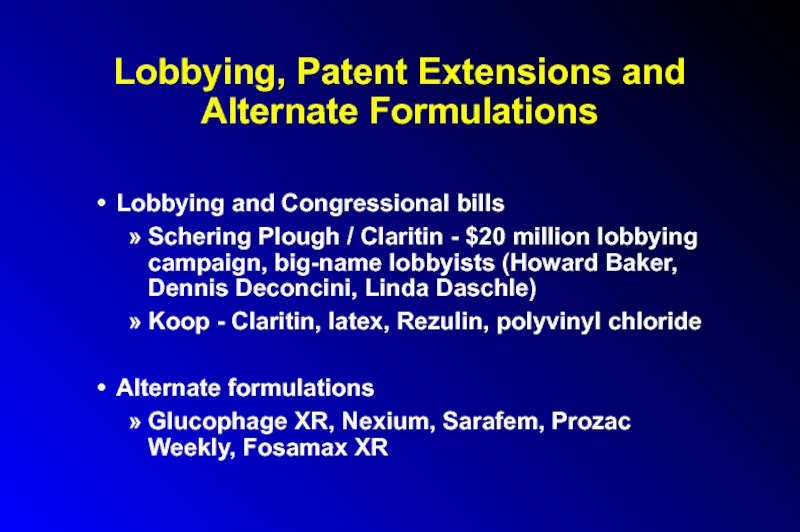
Lobbying and Congressional bills
Schering Plough /
Claritin - $20 million lobbying campaign, big-name lobbyists (Howard Baker, Dennis Deconcini, Linda Daschle)
Koop - Claritin, latex, Rezulin, polyvinyl chloride
Alternate formulations
Glucophage XR, Nexium, Sarafem, Prozac Weekly, Fosamax XR
Koop - Claritin, latex, Rezulin, polyvinyl chloride
Alternate formulations
Glucophage XR, Nexium, Sarafem, Prozac Weekly, Fosamax XR
Слайд 49Lobbying
1998: agribusiness spent $119.3 million lobbying Congress
1998: environmental groups spent $4.7
million on all issues combined
Active lobbying (new laws, not enforce existing laws or fund existing programs)
“Lobbying for lethargy” (maintain status quo)
Active lobbying (new laws, not enforce existing laws or fund existing programs)
“Lobbying for lethargy” (maintain status quo)
Слайд 50Lobbying
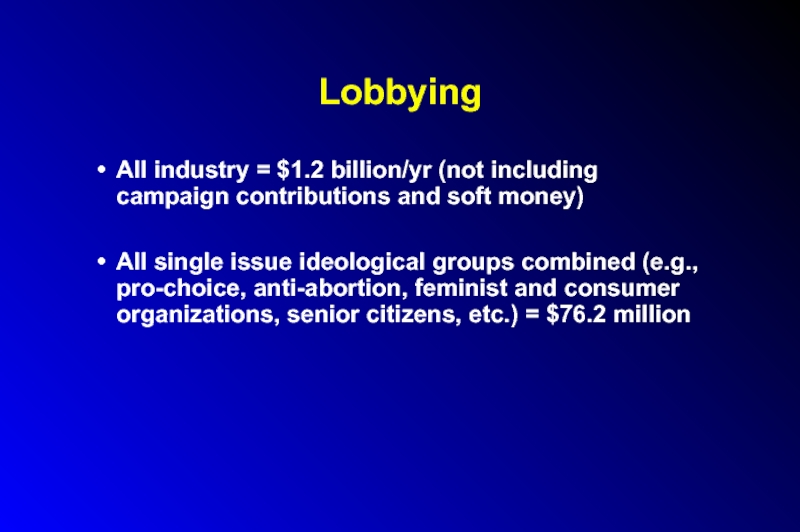
All industry = $1.2 billion/yr (not including campaign contributions and soft
money)
All single issue ideological groups combined (e.g., pro-choice, anti-abortion, feminist and consumer organizations, senior citizens, etc.) = $76.2 million
All single issue ideological groups combined (e.g., pro-choice, anti-abortion, feminist and consumer organizations, senior citizens, etc.) = $76.2 million
Слайд 51Pharmaceutical Company Advertising
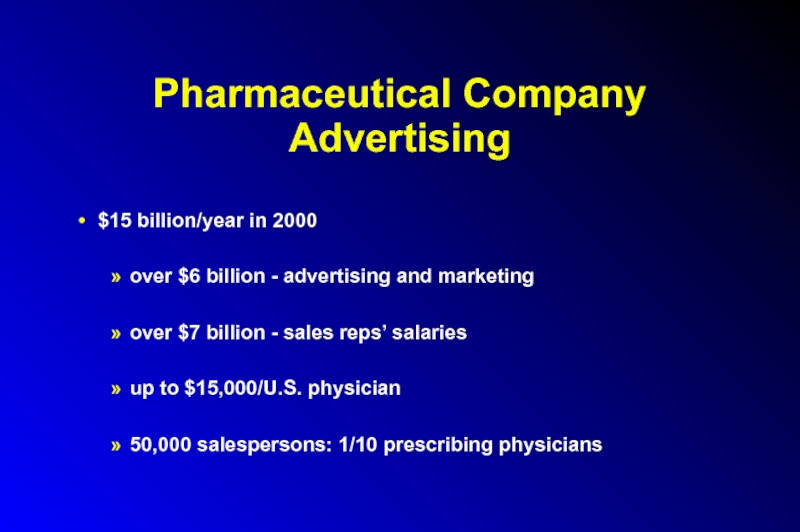
$15 billion/year in 2000
over $6 billion - advertising and
marketing
over $7 billion - sales reps’ salaries
up to $15,000/U.S. physician
50,000 salespersons: 1/10 prescribing physicians
over $7 billion - sales reps’ salaries
up to $15,000/U.S. physician
50,000 salespersons: 1/10 prescribing physicians
Слайд 52Pharmaceutical Company Advertising – Drug Samples
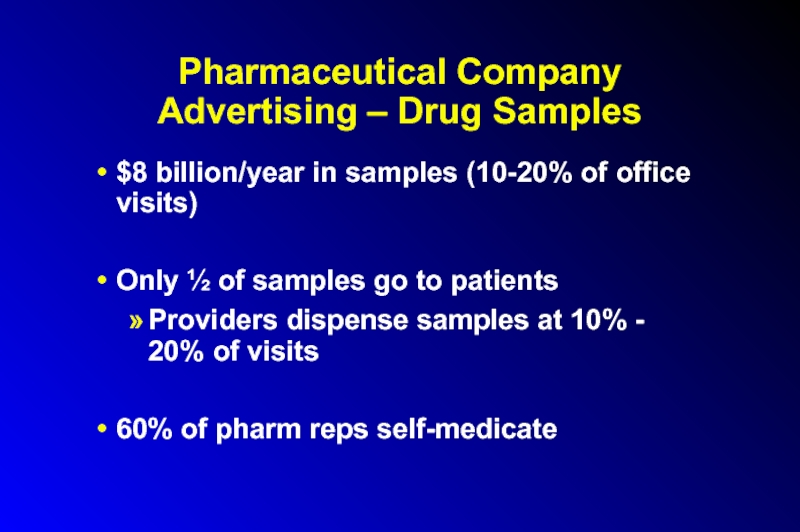
$8 billion/year in samples (10-20% of
office visits)
Only ½ of samples go to patients
Providers dispense samples at 10% - 20% of visits
60% of pharm reps self-medicate
Only ½ of samples go to patients
Providers dispense samples at 10% - 20% of visits
60% of pharm reps self-medicate
Слайд 53Drug Samples
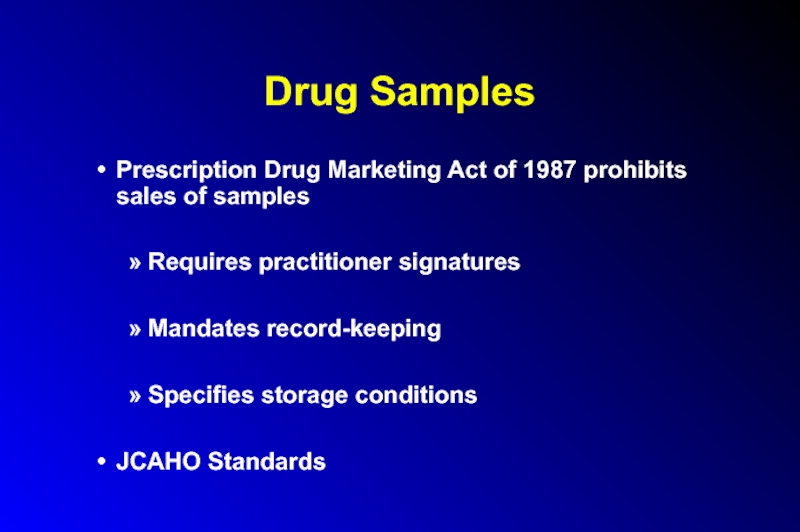
Prescription Drug Marketing Act of 1987 prohibits sales of samples
Requires
practitioner signatures
Mandates record-keeping
Specifies storage conditions
JCAHO Standards
Mandates record-keeping
Specifies storage conditions
JCAHO Standards
Слайд 55Truthfulness in Drug Ads
Wilkes et al.
Ann Int Med 1992:116:912-9
10 leading medical
journals
109 ads and all available references (82%)
3 independent reviewers
109 ads and all available references (82%)
3 independent reviewers
Слайд 56Truthfulness in Drug Ads: FDA Requirements
True statements
-effectiveness
-contradictions
-side effects
Balance
Instructions for use
Approved uses
only
Слайд 57Truthfulness in Drug Ads: Data
57% little of no educational value
40%
not balanced
33% misleading headline
30% incorrectly called drug the “agent of choice”
44% could lead to improper prescribing
33% misleading headline
30% incorrectly called drug the “agent of choice”
44% could lead to improper prescribing
Слайд 58Truthfulness in Drug Ads
500 FDA violations from 1997-mid-2001
- includes 90 DTC
ads
Increased FDA oversight and enforcement needed
Increased FDA oversight and enforcement needed
Слайд 59Untruthfulness in Drug Ads: Reasons
Advertisement income
Business branch handles ads
Oversight by journals
would be prohibitively expensive
Слайд 60Truthfulness in Drug Ads
Higher percentage of ads misleading in Third World
Most
agents available OTC
Doctors are influenced
Prescribing patterns (e.g., Cipro, Calcium Channel Blockers)
1998: Trovan most promoted drug in US; sales most ever for an antibiotic in one year; use since limited by FDA due to liver toxicity
Doctors are influenced
Prescribing patterns (e.g., Cipro, Calcium Channel Blockers)
1998: Trovan most promoted drug in US; sales most ever for an antibiotic in one year; use since limited by FDA due to liver toxicity
Слайд 61Doctors are Influenced
Formulary Requests
(JAMA 1994;271:684-9)
Met with drug rep – 3.4X more
likely to request company’s drug
Accepted money to attend symposia – 7.9X
Accepted money to speak at symposia – 3.9X
Accepted money to perform company-sponsored research – 9.5X
Accepted money to attend symposia – 7.9X
Accepted money to speak at symposia – 3.9X
Accepted money to perform company-sponsored research – 9.5X
Слайд 62Dubious Advertising Tactics
Sponsored symposia and publications
“Buying” ghost-written editorials
Non-peer-reviewed papers in “throwaway”
journals
>100 for-profit medical communication companies
>100 for-profit medical communication companies
Слайд 63Dubious Advertising Tactics
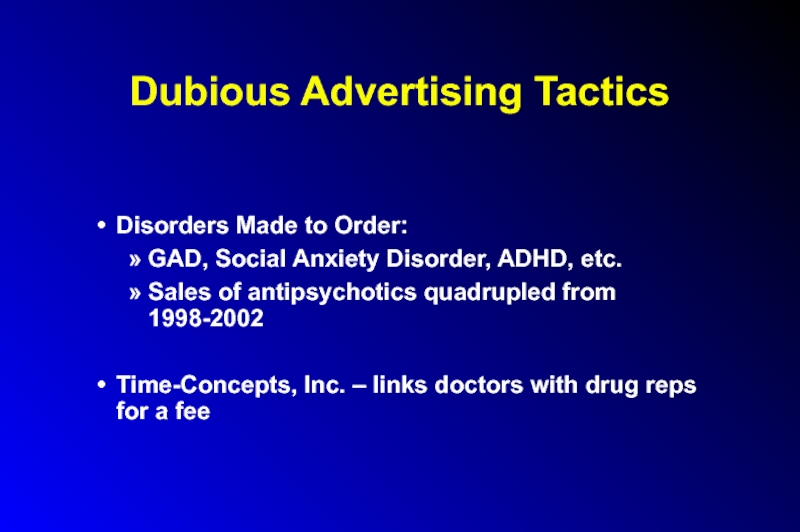
Disorders Made to Order:
GAD, Social Anxiety Disorder, ADHD, etc.
Sales
of antipsychotics quadrupled from 1998-2002
Time-Concepts, Inc. – links doctors with drug reps for a fee
Time-Concepts, Inc. – links doctors with drug reps for a fee
Слайд 64
Direct to Consumer Advertising
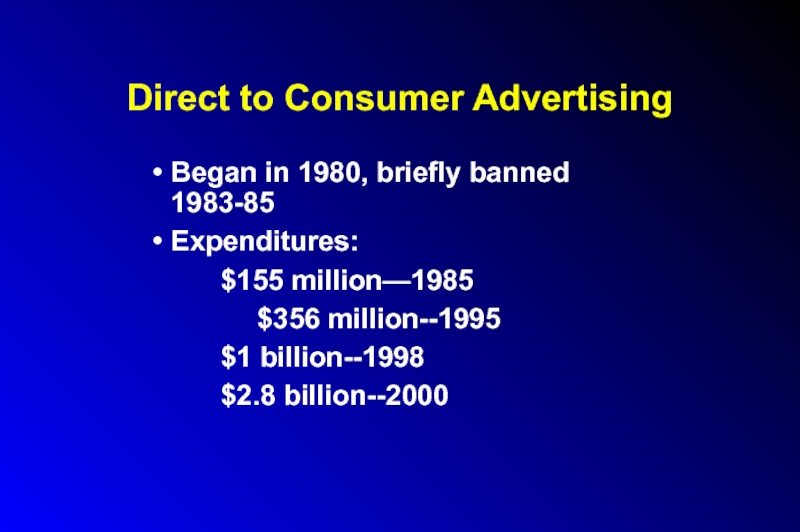
Began in 1980, briefly banned 1983-85
Expenditures:
$155 million—1985
$356 million--1995
$1
billion--1998
$2.8 billion--2000
$2.8 billion--2000
Слайд 65Direct to Consumer Advertising
US and New Zealand only countries to allow
prime time TV advertising
1989 - one drug achieved >10% public recognition
1995 - 13 of the 17 most-heavily marketed
2000 – Schering-Plough spent more to market Claritin than Coca-Cola Enterprises and Anheuser Busch spent to market their products
1989 - one drug achieved >10% public recognition
1995 - 13 of the 17 most-heavily marketed
2000 – Schering-Plough spent more to market Claritin than Coca-Cola Enterprises and Anheuser Busch spent to market their products
Слайд 66Direct to Consumer Advertising:
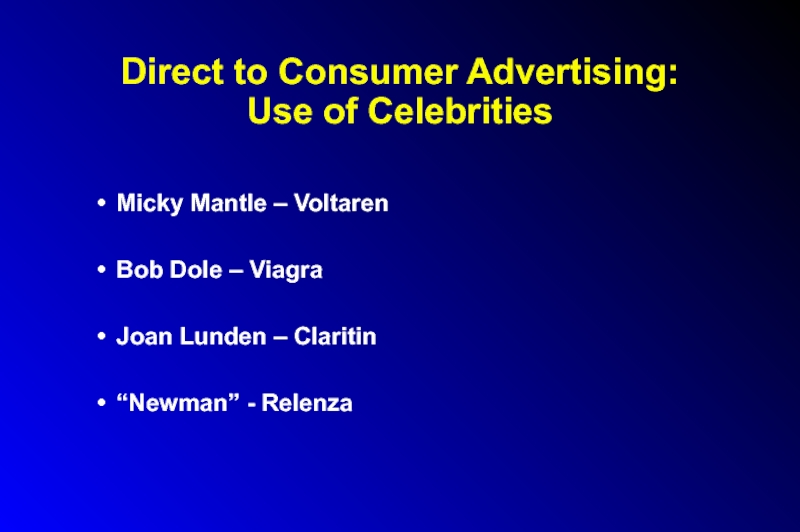
Use of Celebrities
Micky Mantle – Voltaren
Bob Dole –
Viagra
Joan Lunden – Claritin
“Newman” - Relenza
Joan Lunden – Claritin
“Newman” - Relenza
Слайд 67Direct to Consumer Advertising
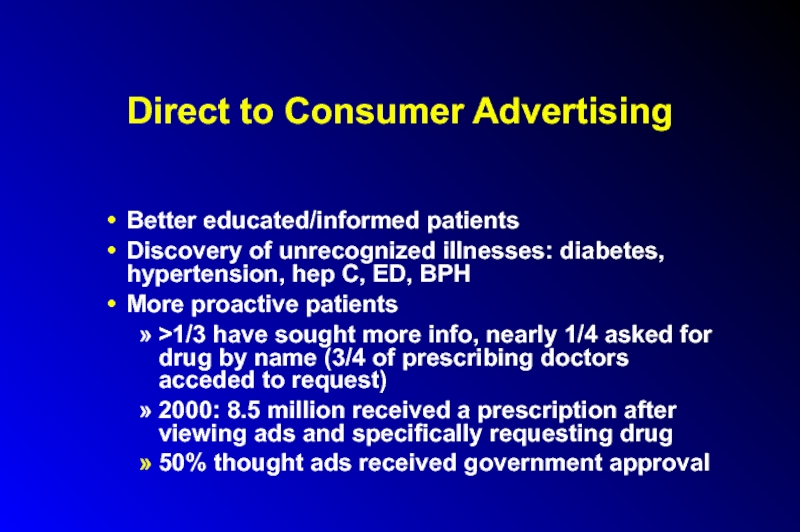
Better educated/informed patients
Discovery of unrecognized illnesses: diabetes, hypertension,
hep C, ED, BPH
More proactive patients
>1/3 have sought more info, nearly 1/4 asked for drug by name (3/4 of prescribing doctors acceded to request)
2000: 8.5 million received a prescription after viewing ads and specifically requesting drug
50% thought ads received government approval
More proactive patients
>1/3 have sought more info, nearly 1/4 asked for drug by name (3/4 of prescribing doctors acceded to request)
2000: 8.5 million received a prescription after viewing ads and specifically requesting drug
50% thought ads received government approval
Слайд 68Direct to Consumer Advertising
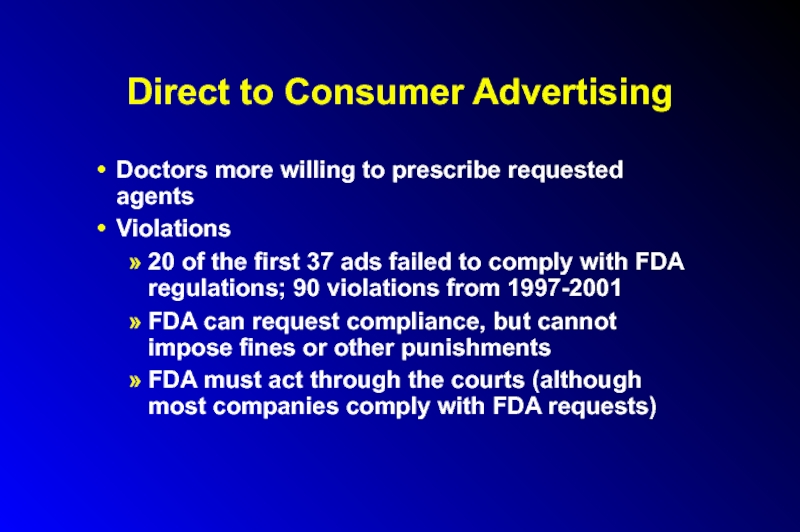
Doctors more willing to prescribe requested agents
Violations
20
of the first 37 ads failed to comply with FDA regulations; 90 violations from 1997-2001
FDA can request compliance, but cannot impose fines or other punishments
FDA must act through the courts (although most companies comply with FDA requests)
FDA can request compliance, but cannot impose fines or other punishments
FDA must act through the courts (although most companies comply with FDA requests)
Слайд 69Direct to Consumer Advertising
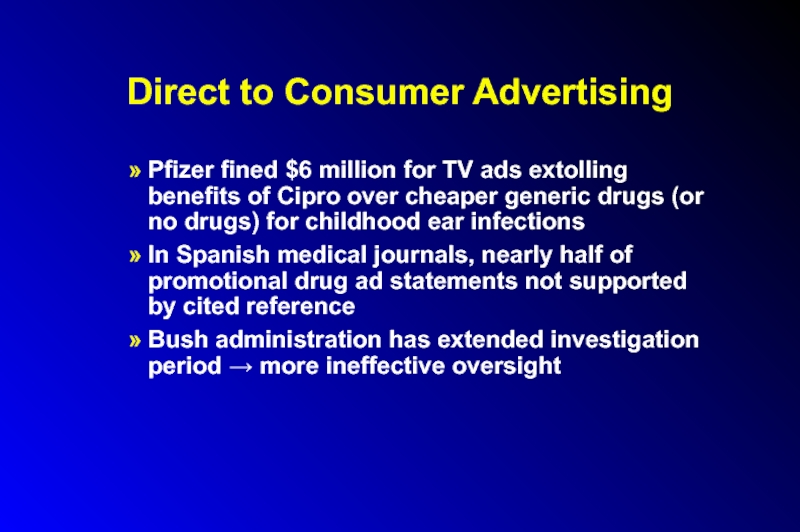
Pfizer fined $6 million for TV ads extolling
benefits of Cipro over cheaper generic drugs (or no drugs) for childhood ear infections
In Spanish medical journals, nearly half of promotional drug ad statements not supported by cited reference
Bush administration has extended investigation period → more ineffective oversight
In Spanish medical journals, nearly half of promotional drug ad statements not supported by cited reference
Bush administration has extended investigation period → more ineffective oversight
Слайд 70Direct to Consumer Advertising
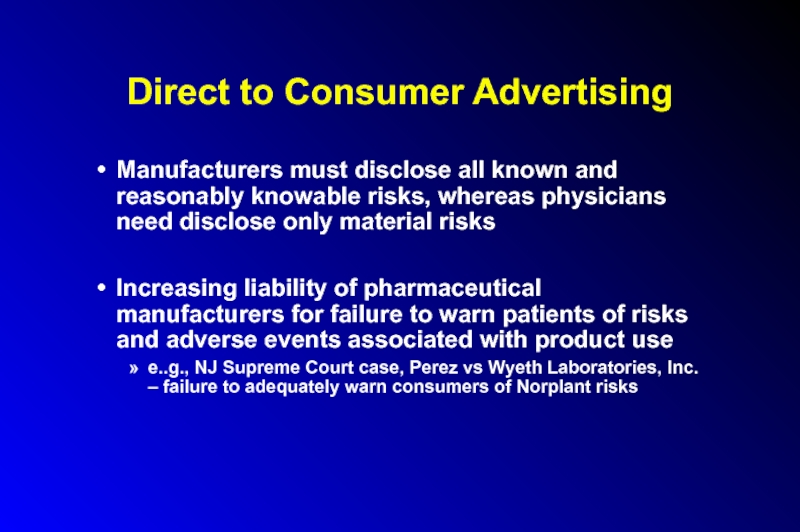
Manufacturers must disclose all known and reasonably knowable
risks, whereas physicians need disclose only material risks
Increasing liability of pharmaceutical manufacturers for failure to warn patients of risks and adverse events associated with product use
e..g., NJ Supreme Court case, Perez vs Wyeth Laboratories, Inc. – failure to adequately warn consumers of Norplant risks
Increasing liability of pharmaceutical manufacturers for failure to warn patients of risks and adverse events associated with product use
e..g., NJ Supreme Court case, Perez vs Wyeth Laboratories, Inc. – failure to adequately warn consumers of Norplant risks
Слайд 71Direct to Consumer Advertising of Genetic Tests
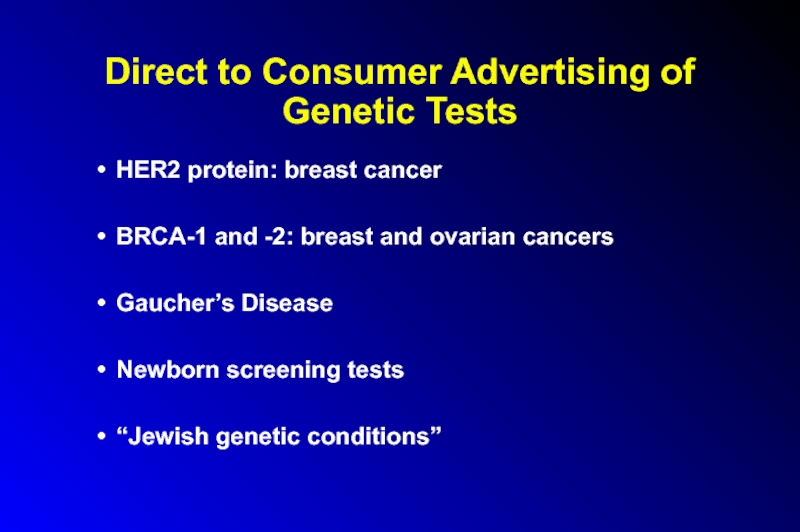
HER2 protein: breast cancer
BRCA-1 and
-2: breast and ovarian cancers
Gaucher’s Disease
Newborn screening tests
“Jewish genetic conditions”
Gaucher’s Disease
Newborn screening tests
“Jewish genetic conditions”
Слайд 72Direct to Consumer Advertising of Genetic Tests
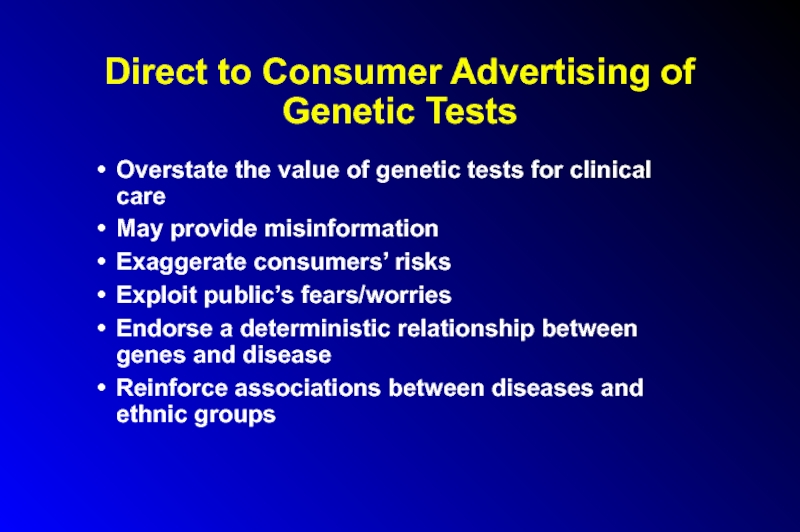
Overstate the value of genetic
tests for clinical care
May provide misinformation
Exaggerate consumers’ risks
Exploit public’s fears/worries
Endorse a deterministic relationship between genes and disease
Reinforce associations between diseases and ethnic groups
May provide misinformation
Exaggerate consumers’ risks
Exploit public’s fears/worries
Endorse a deterministic relationship between genes and disease
Reinforce associations between diseases and ethnic groups
Слайд 73Direct to Consumer Advertising of Genetic Tests
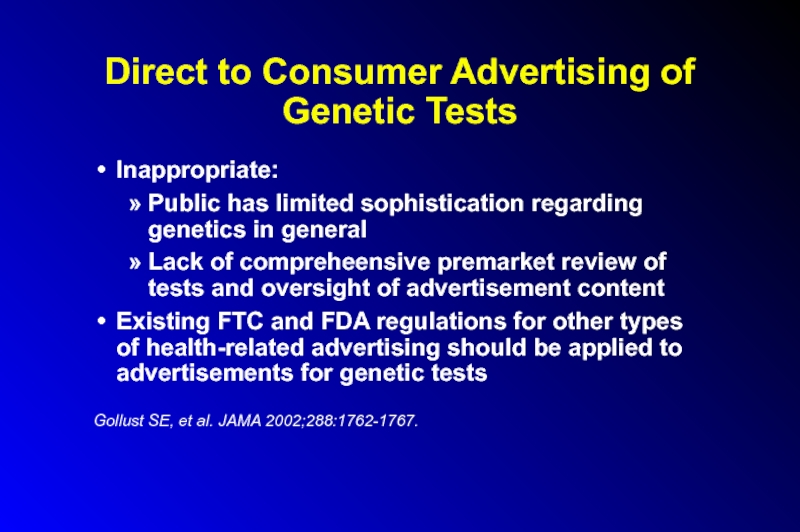
Inappropriate:
Public has limited sophistication regarding
genetics in general
Lack of compreheensive premarket review of tests and oversight of advertisement content
Existing FTC and FDA regulations for other types of health-related advertising should be applied to advertisements for genetic tests
Gollust SE, et al. JAMA 2002;288:1762-1767.
Lack of compreheensive premarket review of tests and oversight of advertisement content
Existing FTC and FDA regulations for other types of health-related advertising should be applied to advertisements for genetic tests
Gollust SE, et al. JAMA 2002;288:1762-1767.
Слайд 74Direct to Consumer Marketing of High-Tech Screening Tests
E.g., Electron-beam CT /
low-dose spiral CT for CAD
Scientific and ethical issues
Role of “luxury primary care clinics” / links with academia
Scientific and ethical issues
Role of “luxury primary care clinics” / links with academia
Слайд 75Sources of Accurate and Reliable Drug Information
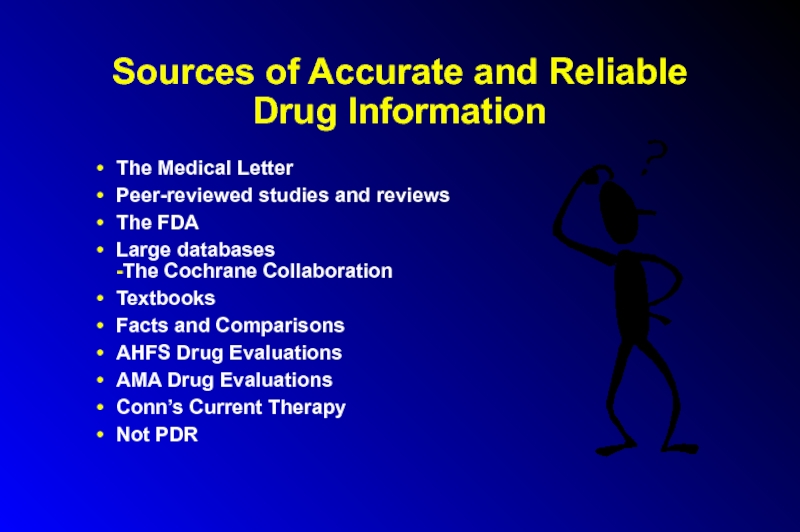
The Medical Letter
Peer-reviewed studies and reviews
The FDA
Large databases -The Cochrane Collaboration
Textbooks
Facts and Comparisons
AHFS Drug Evaluations
AMA Drug Evaluations
Conn’s Current Therapy
Not PDR
Слайд 76Pharmaceutical Industry Research
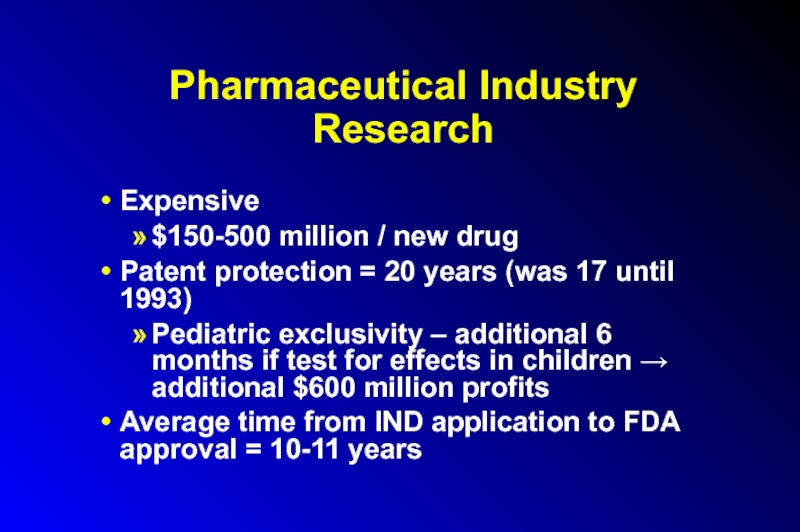
Expensive
$150-500 million / new drug
Patent protection = 20
years (was 17 until 1993)
Pediatric exclusivity – additional 6 months if test for effects in children → additional $600 million profits
Average time from IND application to FDA approval = 10-11 years
Pediatric exclusivity – additional 6 months if test for effects in children → additional $600 million profits
Average time from IND application to FDA approval = 10-11 years
Слайд 77The Drug Approval Process
Discovery/Characterization
Animal studies
- acute toxicity - LD50
- Subacute toxicity
-
Chronic toxicity
- Fertility and reproductive effects
- Mutagenicity
IND Filed (20 approved for every 100 filed)
IND Filed (20 approved for every 100 filed)
Слайд 78The Drug Approval Process
Human Testing
- Phase I: Pharmacological action, dose tolerance,
toxicity, absorption, metabolism, elimination, bioavailability; 50-70 subjects
- Phase II: Controlled trials in 100-200 diseased patients; dose-response curve
- Phase III: Controlled trials in 800-1000 patients assess safety and efficacy; assess drug interactions, effects in elderly, and effects in liver and kidney disease
NDA filed - approved
NDA filed - approved
Слайд 79FDA Classification of Therapeutic Potential
Before 1992:
Type A - important therapeutic gain
Type
B - modest therapeutic gain
Type C - little or no therapeutic gain
1992 Onward: P = priority review, therapeutic gain S = standard review, substantially equivalent
1992 Onward: P = priority review, therapeutic gain S = standard review, substantially equivalent
Слайд 80Controlled Substances
Schedule I: No accepted medical use; high abuse potential
-LSD, Heroin,
?Marijuana
Schedule II: High abuse/dependence potential - Meperidine, Methadone, Oxycodone, Amphetamine, Metlylphendate, Fentanyl, Cocaine
Schedule II: High abuse/dependence potential - Meperidine, Methadone, Oxycodone, Amphetamine, Metlylphendate, Fentanyl, Cocaine
Слайд 81Controlled Substances
Schedule III: Lower abuse potential
-Paregoric, Glutethimide, Pentobarbital
Schedule IV: Lower abuse
potential
-Diazepam, Midazolam, Dextropropoxyphene, Pentazocine
Schedule V: Low abuse potential - Buprenorphine, Propylhexedrine
Schedule V: Low abuse potential - Buprenorphine, Propylhexedrine
Слайд 82Pharmaceutical Industry Research
IND phases 1, 2, and 3
10,000 synthesized/tested compounds
10 enter
clinical trials
1 FDA approved
1 FDA approved
Слайд 83Issues in Drug Company Research
22% of new drugs developed over the
last 2 decades truly innovative (i.e., not “me too” drugs)
Unethical studies
placebo controlled trials (e.g., anti-depressants, anti-psychotics, anti-emetics, anti-hypertensives, anti-inflammatories, etc...)
Third World trials (AIDS/Africa; Surfaxtin (Discovery Labs with J&J/Brazil)
Unethical studies
placebo controlled trials (e.g., anti-depressants, anti-psychotics, anti-emetics, anti-hypertensives, anti-inflammatories, etc...)
Third World trials (AIDS/Africa; Surfaxtin (Discovery Labs with J&J/Brazil)
Слайд 84Seeding Trials
Sponsored by sales and marketing dept., rather than research
division
“Investigators” chosen not for their expertise, but because they prescribe competitor’s drug
Study design poor
“Investigators” chosen not for their expertise, but because they prescribe competitor’s drug
Study design poor
Слайд 85Seeding Trials
Up to 25% of patients enrolled in clinical trials
Disproportionate amount
paid for “investigator’s” work (writing a prescription)
Physicians more favorable towards than patients
Physicians more favorable towards than patients
Слайд 86Issues in Drug Company Research
Species extinction/loss of biodiversity
Taxol- Yew tree
Indigenous peoples’
rights over genetic resources and folk medicine knowledge
-U.N. Commission on Biodiversity
Patenting genes – right or wrong
Patenting genes – right or wrong
Слайд 87Issues in Drug Company Research
Novel therapeutic agents vs. copycat drugs
Methodological Flaws
Study
design bias / invalid comparisons (young patients, inadequate dose of comparison drug)
inadequate statistical power
multiple exclusion criteria
→
inadequate statistical power
multiple exclusion criteria
→
Слайд 88Issues in Drug Company Research
Methodological Flaws (cont.)
economic analyses not performed
therapeutic benefit
claims more often supported by data than claims of less toxicity
publication bias – tendency of corporate sponsors to publish only favorable results
publication bias – tendency of corporate sponsors to publish only favorable results
Слайд 89Issues in Drug Company Research
60% of industry-sponsored trials are contracted out
to for-profit research firms, which in turn may contract with for-profit NIRBs for ethical review.
Industry ethics consultants – watchdogs or showdogs
Erosion of medical ethics
Industry ethics consultants – watchdogs or showdogs
Erosion of medical ethics
Слайд 90Issues in Drug Company Research
Symposia
Many are drug-company sponsored
More likely to have
a run-in period (eliminates non-compliers, adverse reactors)
Favorable outcomes more likely
Misleading titles
Brand names
Less peer review
Promote unapproved uses
Favorable outcomes more likely
Misleading titles
Brand names
Less peer review
Promote unapproved uses
Слайд 91Non-Compliance
Short term = 20%
Long term (CHF, DM, TB) = 40-60%
Long term
(other studies):
-1/2-2/3 take > 80%
-1/3 take 40-80%
-remainder < 40%
Decreases with increased patient satisfaction
No effect of age
Illiteracy - 42 million Americans
Decreases with increased patient satisfaction
No effect of age
Illiteracy - 42 million Americans
Слайд 92Risks of Noncompliance
Poorer health outcomes
-e.g., CAD/B-Blockers - MI
Increases ER visits and
hospitalizations
-10% of elderly hospitalizations
Слайд 93Monitoring Compliance
Direct Methods
Direct observation
Pill counts
Pharmacy records
Serum/urine drug/marker levels
Expected biologic effects
Electronic
medication dispensers
Слайд 94
Monitoring Compliance
Indirect Methods
Patient interview
Asking patients
Physician estimate
50% Sensitivity
Слайд 95Reasons for
Noncompliance
Poor patient education
Cost
M.D. awareness poor
Doctors more likely to under-
than overestimate
Dosing frequency
Social barriers, public stigmatization
Dosing frequency
Social barriers, public stigmatization
Слайд 96Improving Compliance
Patient education
Patient satisfaction
Cost consciousness
Eliminate copayments
Слайд 97Improving Compliance
Decrease dosing frequency
Tailor to specific patient activities
Tid > q
8 hours
Easy-to-use packaging/pill boxes/alarms
Easy-to-use packaging/pill boxes/alarms
Слайд 98Adverse Drug Events
Improper use by patients
$20 billion in direct costs
$55 billion
indirect costs
Prescribing/administrative errors
3-6% of all medical admissions
1.4 medication errors/admission
Prescribing/administrative errors
3-6% of all medical admissions
1.4 medication errors/admission
Слайд 99Adverse Drug Events
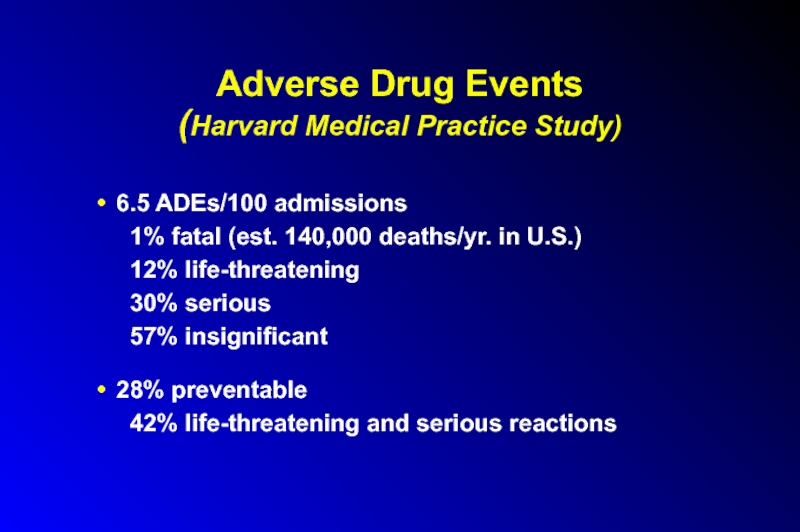
(Harvard Medical Practice Study)
6.5 ADEs/100 admissions
1% fatal (est. 140,000
deaths/yr. in U.S.)
12% life-threatening
30% serious
57% insignificant
28% preventable
42% life-threatening and serious reactions
12% life-threatening
30% serious
57% insignificant
28% preventable
42% life-threatening and serious reactions
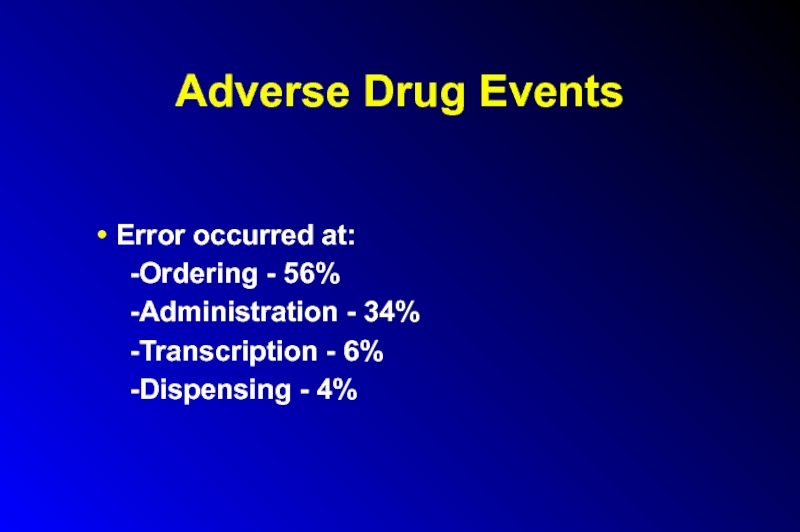
Слайд 100Adverse Drug Events
Error occurred at:
-Ordering - 56%
-Administration - 34%
-Transcription - 6%
-Dispensing
- 4%
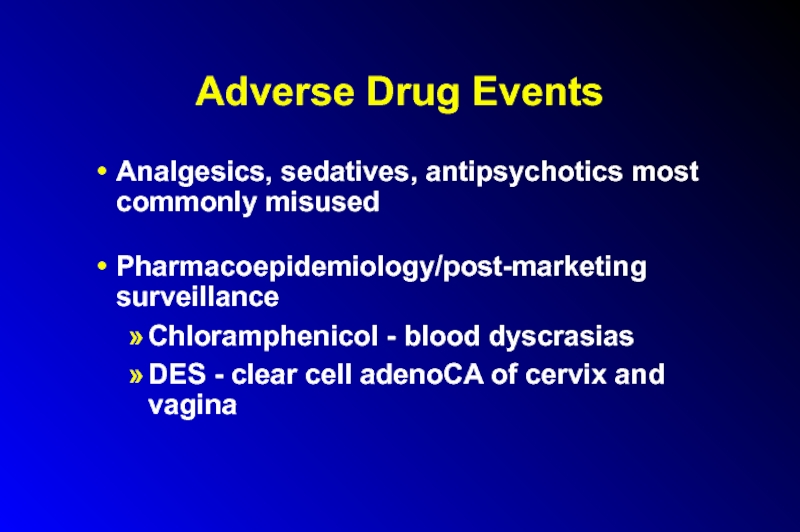
Слайд 101Adverse Drug Events
Analgesics, sedatives, antipsychotics most commonly misused
Pharmacoepidemiology/post-marketing surveillance
Chloramphenicol - blood
dyscrasias
DES - clear cell adenoCA of cervix and vagina
DES - clear cell adenoCA of cervix and vagina
Слайд 102
Drug knowledge dissemination
Dose and identity checking
Patient information availability
Order transcription
Adverse Drug Events:
Reasons
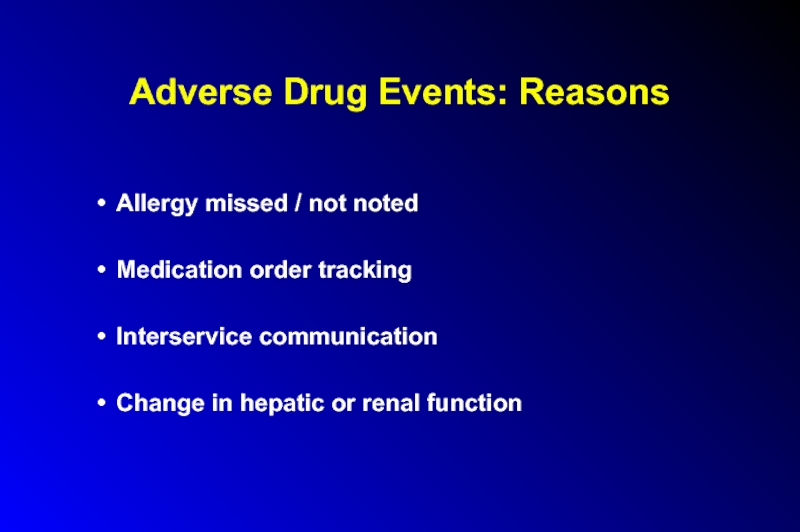
Слайд 103Adverse Drug Events: Reasons
Allergy missed / not noted
Medication order tracking
Interservice communication
Change
in hepatic or renal function
Слайд 104Adverse Drug Events
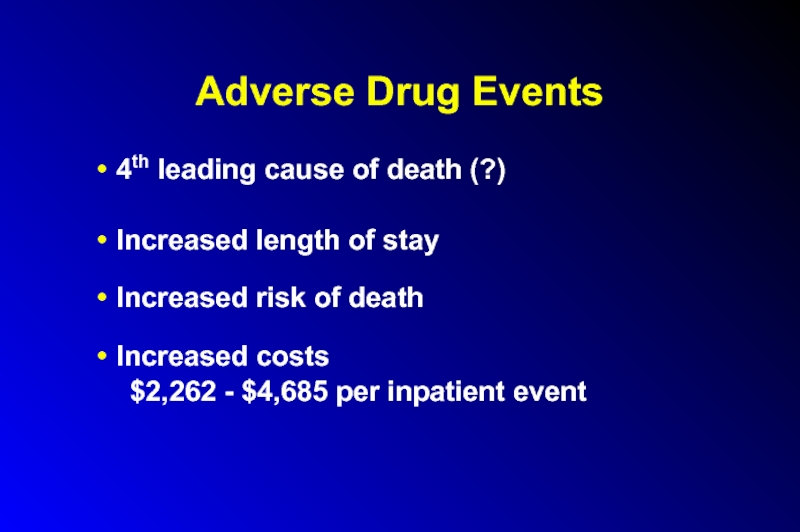
4th leading cause of death (?)
Increased length of stay
Increased
risk of death
Increased costs
$2,262 - $4,685 per inpatient event
Increased costs
$2,262 - $4,685 per inpatient event
Слайд 105Alternative Medicine
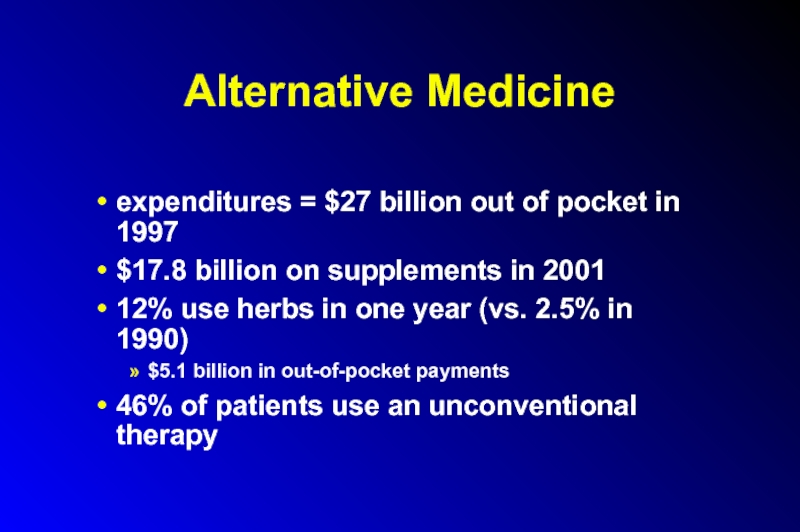
expenditures = $27 billion out of pocket in 1997
$17.8 billion
on supplements in 2001
12% use herbs in one year (vs. 2.5% in 1990)
$5.1 billion in out-of-pocket payments
46% of patients use an unconventional therapy
12% use herbs in one year (vs. 2.5% in 1990)
$5.1 billion in out-of-pocket payments
46% of patients use an unconventional therapy
Слайд 106Alternative Medicine
Between 1996 and 1998, 8% of normal-weight women and 28%
of obese women used non-prescription weight loss products
More CAM visits than PCP visits in 1997
72% do not inform their physicians
More CAM visits than PCP visits in 1997
72% do not inform their physicians
Слайд 107Efficacy of Herbal Products
Gingko biloba – possible minimal effects on dementia;
likely unhelpful for intermittent claudication
Side effects: HA, N, D, skin rash, cerebral or extracerebral hemorrhage, seizures, Stevens-Johnson Syndrome
Hawthorne extracts – likely unhelpful for cardiovascular disease
Side effects: GI, palpitations, chest pain, circulatory disturbances and vertigo with high doses; may enhance positive inotropic effects of digoxin
Слайд 108Efficacy of Herbal Products
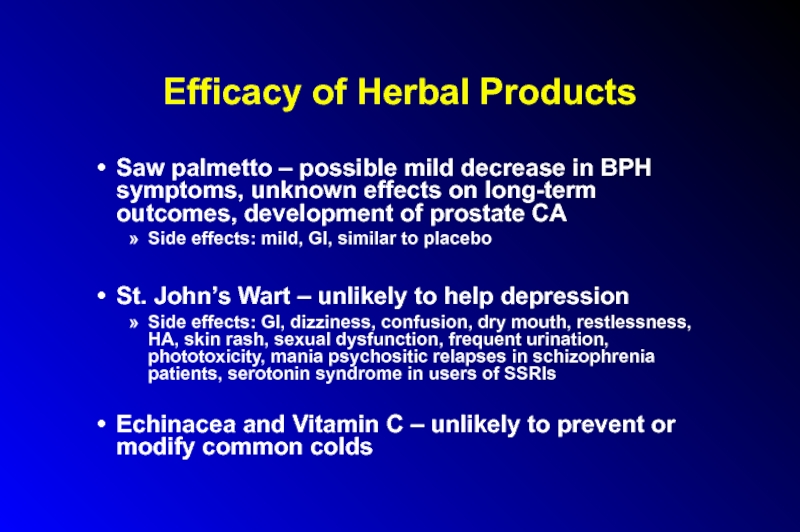
Saw palmetto – possible mild decrease in BPH
symptoms, unknown effects on long-term outcomes, development of prostate CA
Side effects: mild, GI, similar to placebo
St. John’s Wart – unlikely to help depression
Side effects: GI, dizziness, confusion, dry mouth, restlessness, HA, skin rash, sexual dysfunction, frequent urination, phototoxicity, mania psychositic relapses in schizophrenia patients, serotonin syndrome in users of SSRIs
Echinacea and Vitamin C – unlikely to prevent or modify common colds
Слайд 109Risks Of Herbal And “Naturopathic” Remedies
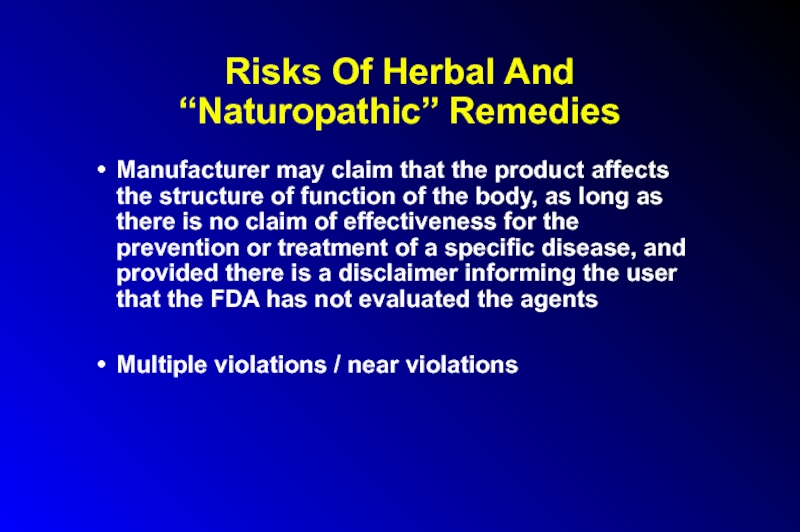
Manufacturer may claim that the product
affects the structure of function of the body, as long as there is no claim of effectiveness for the prevention or treatment of a specific disease, and provided there is a disclaimer informing the user that the FDA has not evaluated the agents
Multiple violations / near violations
Multiple violations / near violations
Слайд 110Risks Of Herbal And “Naturopathic” Remedies
Products unregulated/untested
Variable
collection
processing
storage
naming
purity
Слайд 111Risks Of Herbal And “Naturopathic” Remedies
Adulterants and contaminants include:
Botanicals – e.g.,
digitalis, belladonna
Microorganisms – Staph aureus, E coli, Salmonella, Shigella, Pseudomonas
Microbial toxins – aflatoxins, bacterial endotoxins
Pesticides
Fumigation agents
Toxic metals – lead, cadmium, mercury, arsenic
Drugs – analgesics and antiinflammatories, corticosteroids, benzodiazepines, warfarin, fenfluramine, sildenafil
Слайд 112Risks Of Herbal And “Naturopathic” Remedies
Est. less than 1% of adverse
reactions reported to FDA (vs. 10% est. for prescription drugs)
19,468 adverse events reports to poison control centers in 1998, vs. 500 to FDA
Potential toxicities: cardiac, CNS, liver, kidney
High risk users:
Elderly, pregnant and nursing women, infants
Poor overall health status
Chronic users, prescription drug users
19,468 adverse events reports to poison control centers in 1998, vs. 500 to FDA
Potential toxicities: cardiac, CNS, liver, kidney
High risk users:
Elderly, pregnant and nursing women, infants
Poor overall health status
Chronic users, prescription drug users
Слайд 113Risks of Herbal and “Naturopathic” Remedies
Dietary supplements containing ephedrine, caffeine
HTN, MI,
CVA, psychosis, seizures
Chapparal, germander, comfrey, skullcap, sassafras
Hepatotoxic, carcinogenic
Contaminated L-tryptophan
Eosinophilia-Myalgia Syndrome
Chapparal, germander, comfrey, skullcap, sassafras
Hepatotoxic, carcinogenic
Contaminated L-tryptophan
Eosinophilia-Myalgia Syndrome
Слайд 114Risks of Herbal and “Naturopathic” Remedies
GE-L-tryptophan → EMS (1989): 5,000 in
US affected, 37 deaths, 1500 permanently disabled
Heart attacks, dysrhythmias, strokes and seizures from ephedra
Bleeding from garlic, gingko, and ginseng
hypoglycemia from ginseng
Heart attacks, dysrhythmias, strokes and seizures from ephedra
Bleeding from garlic, gingko, and ginseng
hypoglycemia from ginseng
Слайд 115Risks of Herbal and “Naturopathic” Remedies
potentiation of anesthetic effects by kava
and valerian
increased metabolism of many drugs by St. John’s wort
↓CyA effectiveness secondary to St John’s Wort → transplant rejection
1998: 32% of Asian patent medicines sold in the US contained undeclared pharmaceuticals or heavy metals
increased metabolism of many drugs by St. John’s wort
↓CyA effectiveness secondary to St John’s Wort → transplant rejection
1998: 32% of Asian patent medicines sold in the US contained undeclared pharmaceuticals or heavy metals
Слайд 116Glucosamine/Chondroitin
Meta-analysis showed unlikely to be beneficial for RA and OA
Major source
= sharks
Mass extinction; 70% of world’s fisheries are fully exploited to overexploited; 75-85% reduction of US coastal shark species over last 10 yrs
large “gray market” in shark products
Mass extinction; 70% of world’s fisheries are fully exploited to overexploited; 75-85% reduction of US coastal shark species over last 10 yrs
large “gray market” in shark products
Слайд 117Pet Pharmaceuticals
$3 billion market
Clonicalm (clomipramine) for separation anxiety in dogs
Anipryl (seligeline)
for canine Cognitive Dysfunction Syndrome
“Sea pet” shark cartilage treats for doggie arthritis
“Sea pet” shark cartilage treats for doggie arthritis
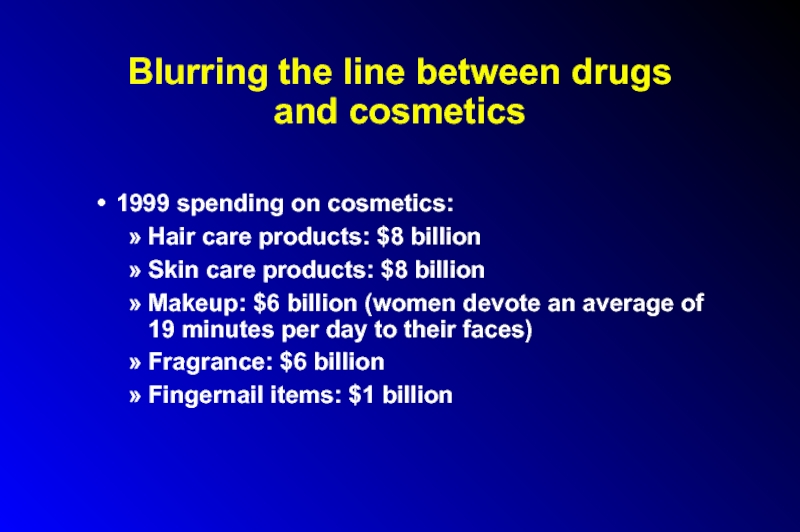
Слайд 118Blurring the line between drugs and cosmetics
1999 spending on cosmetics:
Hair care
products: $8 billion
Skin care products: $8 billion
Makeup: $6 billion (women devote an average of 19 minutes per day to their faces)
Fragrance: $6 billion
Fingernail items: $1 billion
Skin care products: $8 billion
Makeup: $6 billion (women devote an average of 19 minutes per day to their faces)
Fragrance: $6 billion
Fingernail items: $1 billion
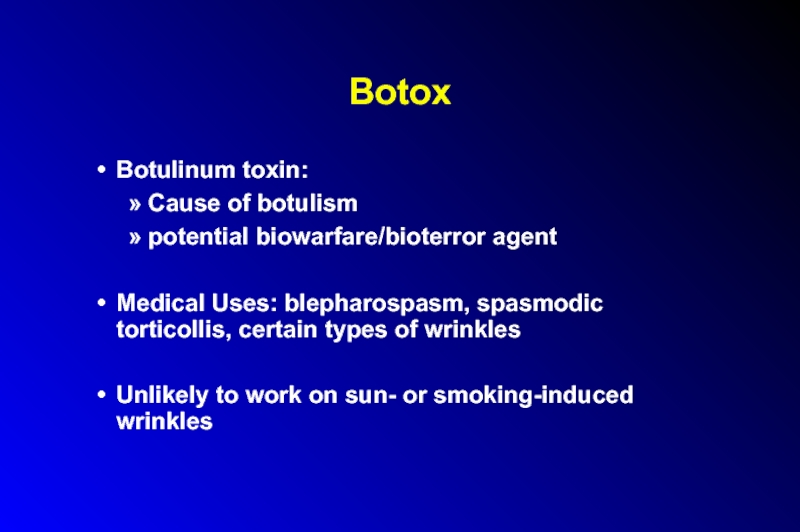
Слайд 119Botox
Botulinum toxin:
Cause of botulism
potential biowarfare/bioterror agent
Medical Uses: blepharospasm, spasmodic torticollis, certain
types of wrinkles
Unlikely to work on sun- or smoking-induced wrinkles
Unlikely to work on sun- or smoking-induced wrinkles
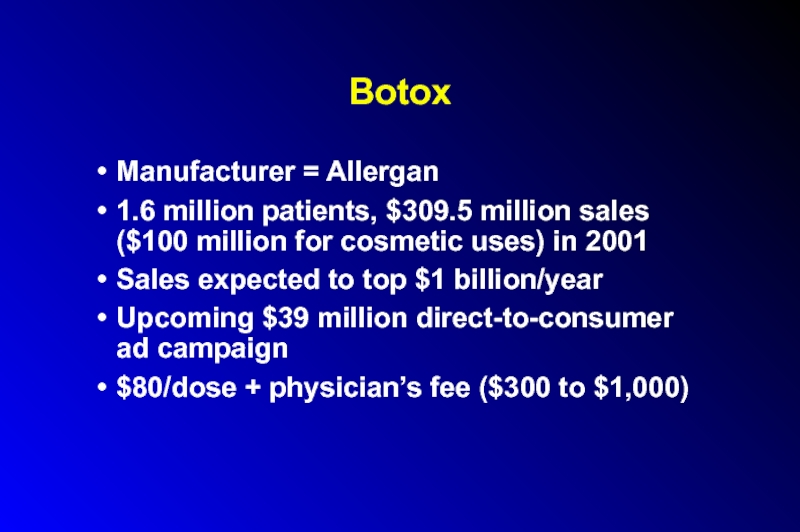
Слайд 120Botox
Manufacturer = Allergan
1.6 million patients, $309.5 million sales ($100 million for
cosmetic uses) in 2001
Sales expected to top $1 billion/year
Upcoming $39 million direct-to-consumer ad campaign
$80/dose + physician’s fee ($300 to $1,000)
Sales expected to top $1 billion/year
Upcoming $39 million direct-to-consumer ad campaign
$80/dose + physician’s fee ($300 to $1,000)
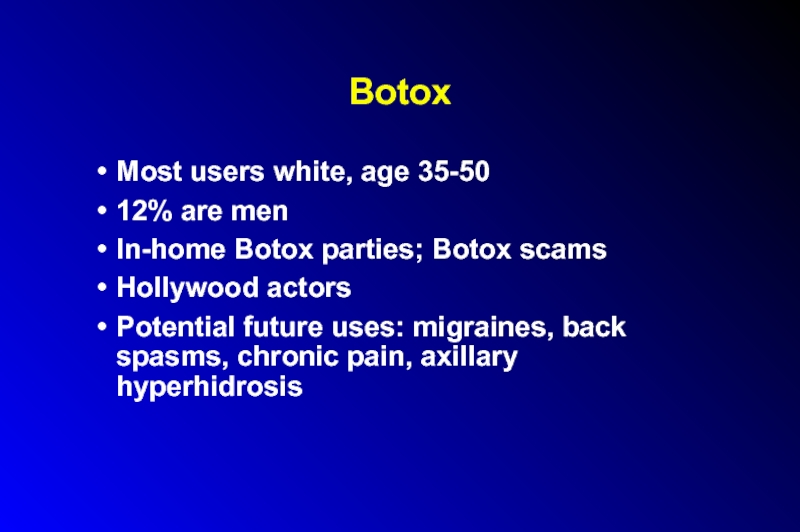
Слайд 121Botox
Most users white, age 35-50
12% are men
In-home Botox parties; Botox scams
Hollywood
actors
Potential future uses: migraines, back spasms, chronic pain, axillary hyperhidrosis
Potential future uses: migraines, back spasms, chronic pain, axillary hyperhidrosis
Слайд 122Botox
Retreatments required q 3-4 months
Side effects: masklike facies, slackness and drooling,
rare allergic reactions
Rivals = collagen injections (from cows, possible allergic responses), Perlane (“natural” collagen alternative from human tissue), Myobloc, face lift/eyelid surgery
Rivals = collagen injections (from cows, possible allergic responses), Perlane (“natural” collagen alternative from human tissue), Myobloc, face lift/eyelid surgery
Слайд 123Under- and overuse of antibiotics
MDR TB in Russian prisons
bronchitis and viral
URIs in the US
Recent decrease in use in children and adolescents, although still excessive
Pet superstores and websites sell multiple antibiotics
Recent decrease in use in children and adolescents, although still excessive
Pet superstores and websites sell multiple antibiotics
Слайд 124Factory Farms, Antibiotics and Anthrax:
Putting Profits Before Public Health
Martin Donohoe, MD,
FACP
Слайд 126Factory Farming
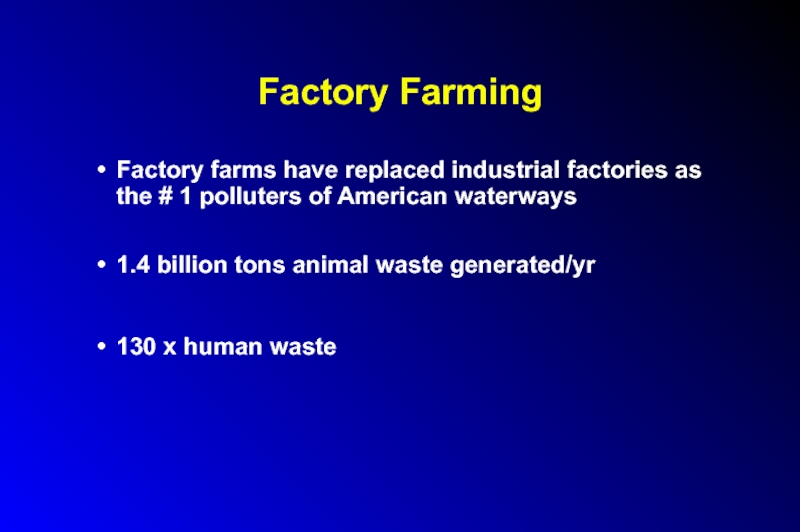
Factory farms have replaced industrial factories as the # 1
polluters of American waterways
1.4 billion tons animal waste generated/yr
130 x human waste
1.4 billion tons animal waste generated/yr
130 x human waste
Слайд 127Factory Farming
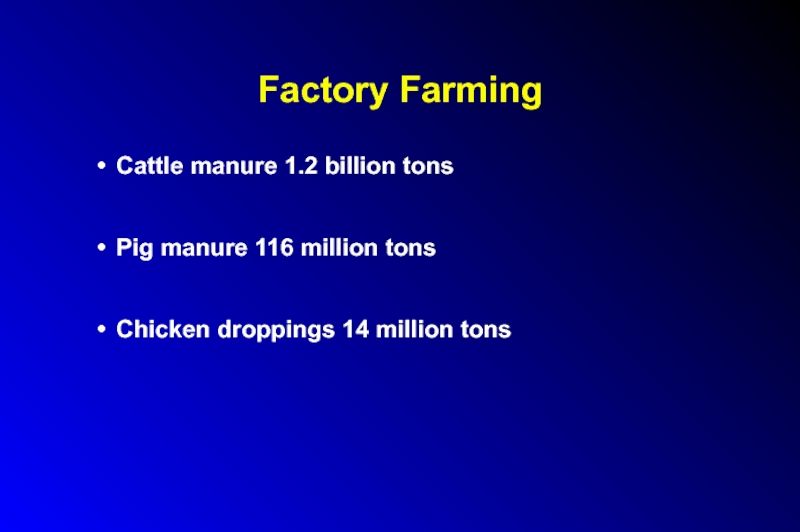
Cattle manure 1.2 billion tons
Pig manure 116 million tons
Chicken droppings
14 million tons
Слайд 128Factory Farm Waste
Overall number of hog farms down from 600,000 to
157,000 over the last 15yrs, while # of factory hog farms up 75%
1 hog farm in NC generates as much sewage annualy as all of Manhattan
1 hog farm in NC generates as much sewage annualy as all of Manhattan
Слайд 129Factory Farm Waste
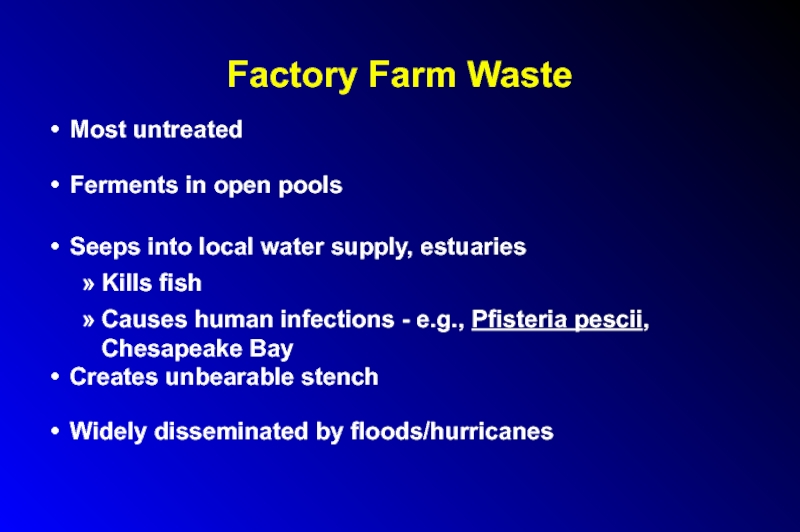
Most untreated
Ferments in open pools
Seeps into local water supply,
estuaries
Kills fish
Causes human infections - e.g., Pfisteria pescii, Chesapeake Bay
Creates unbearable stench
Widely disseminated by floods/hurricanes
Kills fish
Causes human infections - e.g., Pfisteria pescii, Chesapeake Bay
Creates unbearable stench
Widely disseminated by floods/hurricanes
Слайд 130Agricultural Antibiotic Use
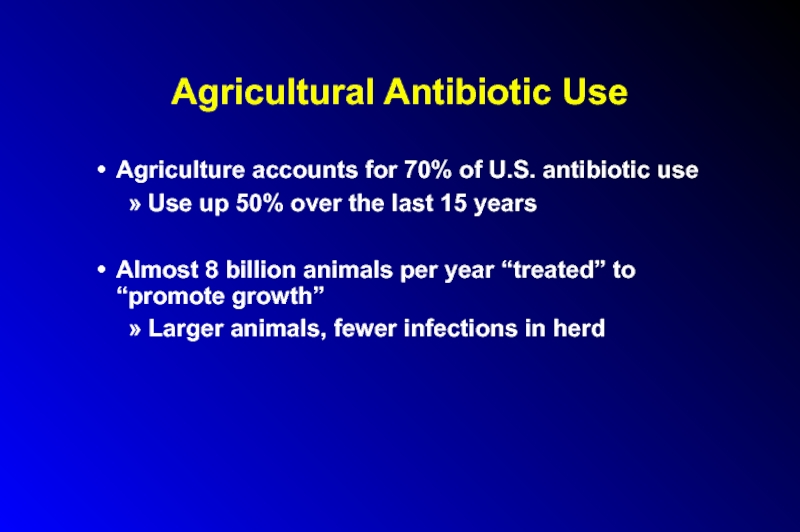
Agriculture accounts for 70% of U.S. antibiotic use
Use up
50% over the last 15 years
Almost 8 billion animals per year “treated” to “promote growth”
Larger animals, fewer infections in herd
Almost 8 billion animals per year “treated” to “promote growth”
Larger animals, fewer infections in herd
Слайд 131Consequences of Agricultural Antibiotic Use
Campylobacter fluoroquinolone resistance
VREF (poss. due to avoparcin
use in chickens)
Слайд 132Antibiotic Resistant Pathogens
CDC: “Antibiotic use in food animals is the dominant
source of antibiotic resistance among food-borne pathogens.”
$4billion/yr to treat antibiotic-resistant infections in humans
$4billion/yr to treat antibiotic-resistant infections in humans
Слайд 133Alternatives to Agricultural Antibiotic Use
Decrease overcrowding
Better diet/sanitation/living conditions
Control heat stress
Vaccination
Increased use
of bacterial cultures and specific antibiotic treatment in animals when indicated
Слайд 134Alternatives to Agricultural Antibiotic Use: Vegetarianism
↓ water/grain needs
↓ animal fecal waste
↓
rendering/mad cow disease
↓ rBGH (→ ↑IGF-1 in milk)
Health benefits
Meatpacking = most dangerous job in US
↓ rBGH (→ ↑IGF-1 in milk)
Health benefits
Meatpacking = most dangerous job in US
Слайд 135Alternatives to Agricultural Antibiotic Use: Vegetarianism
European Union bans antibiotics as growth
promoters in animal feed (1/06)
Слайд 136Food-Borne Illness
¼ of US population affected per year
Each day 200,000 sickened,
900 hospitalized, 14 die
↑d in part due to ↑ing centralization of meat supply
e.g., E. coli OH157
↑d in part due to ↑ing centralization of meat supply
e.g., E. coli OH157
Слайд 137Campylobacter
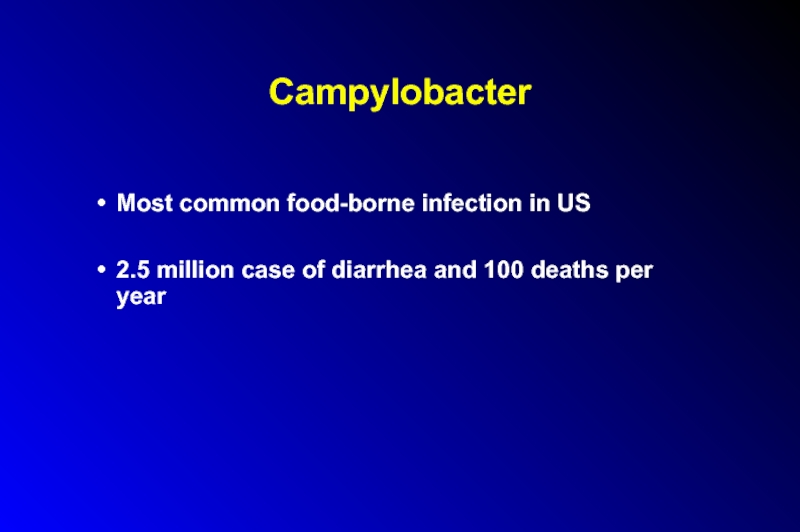
Most common food-borne infection in US
2.5 million case of diarrhea and
100 deaths per year
Слайд 138Campylobacter Resistance to Fluoroquinolones Increasing
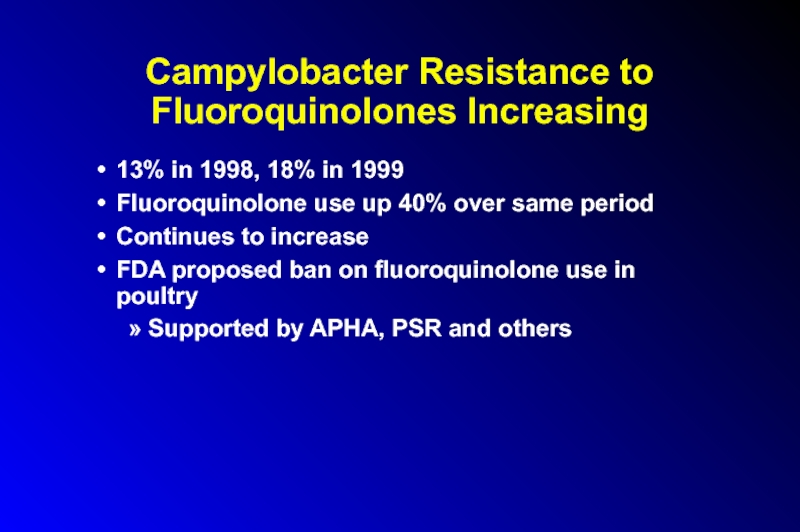
13% in 1998, 18% in 1999
Fluoroquinolone use
up 40% over same period
Continues to increase
FDA proposed ban on fluoroquinolone use in poultry
Supported by APHA, PSR and others
Continues to increase
FDA proposed ban on fluoroquinolone use in poultry
Supported by APHA, PSR and others
Слайд 139Fluoroquinolones
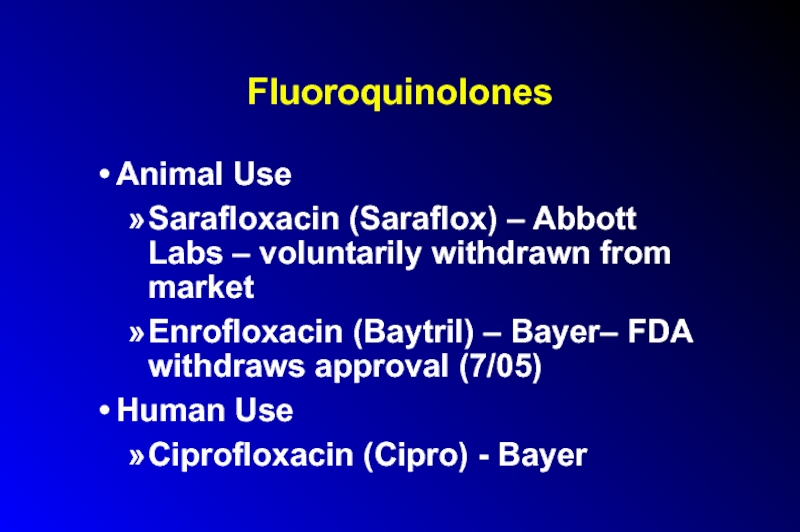
Animal Use
Sarafloxacin (Saraflox) – Abbott Labs – voluntarily withdrawn from market
Enrofloxacin
(Baytril) – Bayer– FDA withdraws approval (7/05)
Human Use
Ciprofloxacin (Cipro) - Bayer
Human Use
Ciprofloxacin (Cipro) - Bayer
Слайд 140Anthrax
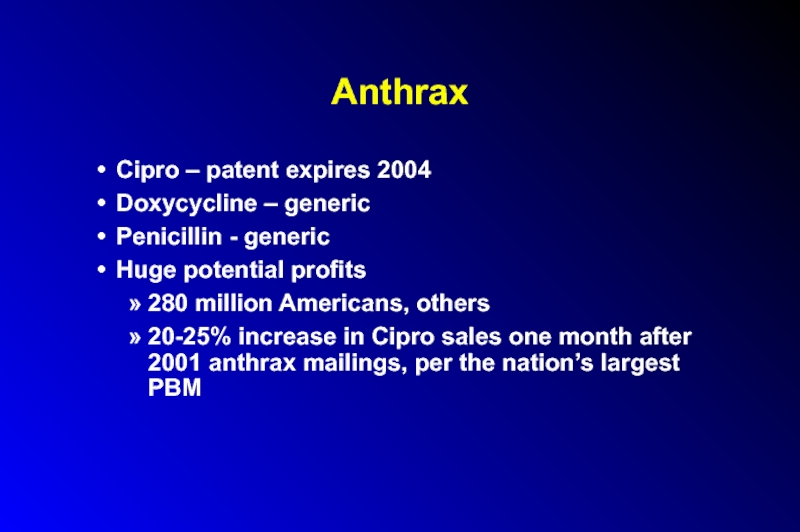
Cipro – patent expires 2004
Doxycycline – generic
Penicillin - generic
Huge potential profits
280
million Americans, others
20-25% increase in Cipro sales one month after 2001 anthrax mailings, per the nation’s largest PBM
20-25% increase in Cipro sales one month after 2001 anthrax mailings, per the nation’s largest PBM
Слайд 141Cipro
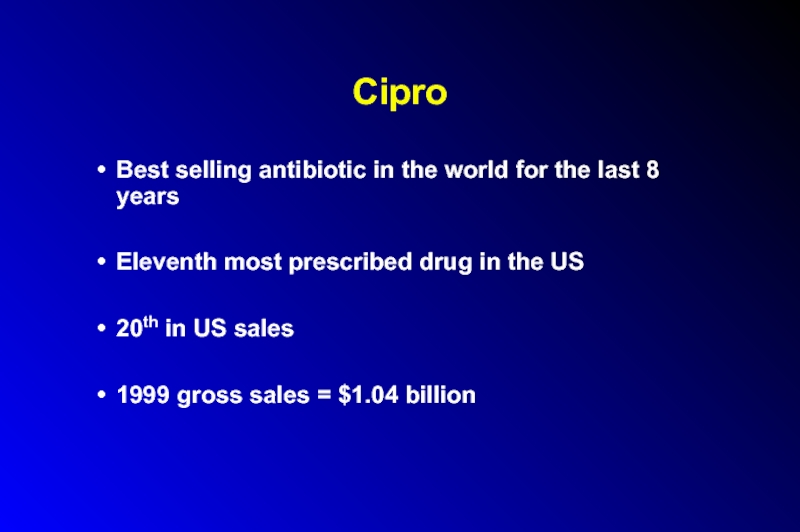
Best selling antibiotic in the world for the last 8 years
Eleventh
most prescribed drug in the US
20th in US sales
1999 gross sales = $1.04 billion
20th in US sales
1999 gross sales = $1.04 billion
Слайд 142Bayer and Cipro
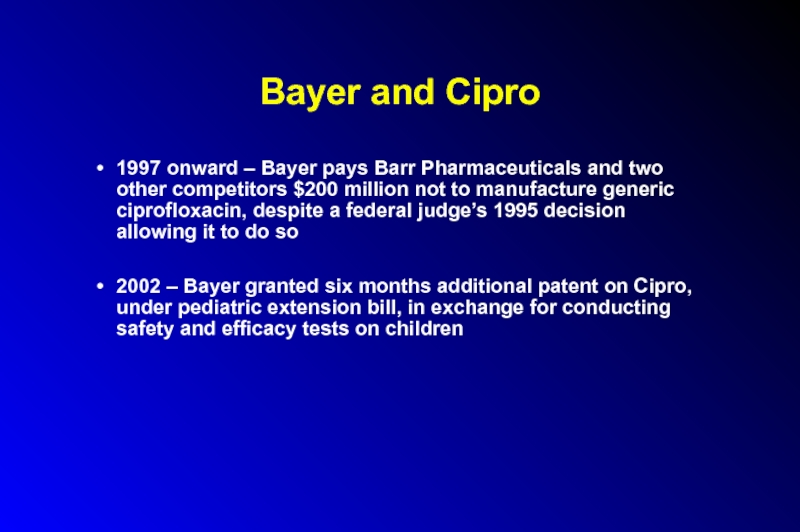
1997 onward – Bayer pays Barr Pharmaceuticals and two
other competitors $200 million not to manufacture generic ciprofloxacin, despite a federal judge’s 1995 decision allowing it to do so
2002 – Bayer granted six months additional patent on Cipro, under pediatric extension bill, in exchange for conducting safety and efficacy tests on children
2002 – Bayer granted six months additional patent on Cipro, under pediatric extension bill, in exchange for conducting safety and efficacy tests on children
Слайд 143Cost of Cipro
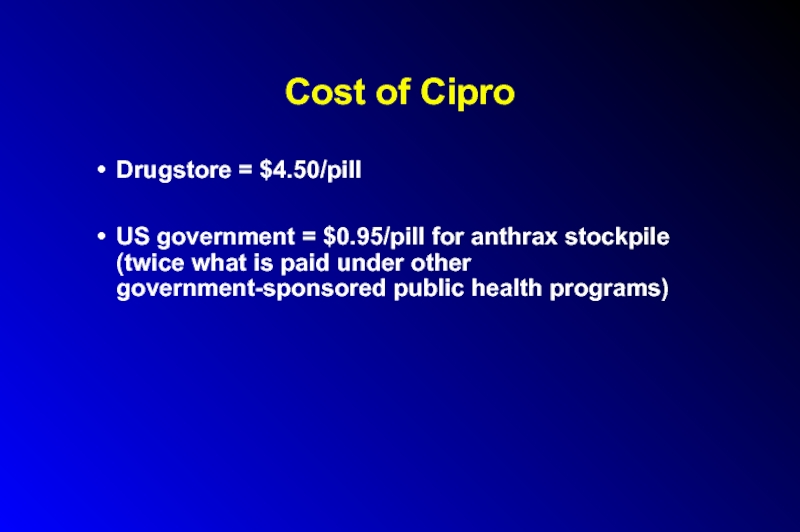
Drugstore = $4.50/pill
US government = $0.95/pill for anthrax stockpile
(twice what is paid under other government-sponsored public health programs)
Слайд 144Cost of Cipro
US government has the authority, under existing law, to
license generic production of ciprofloxacin by other companies for as little as $0.20/pill in the event of a public health emergency
It has failed to do so
Canada did override Bayer’s patent and ordered 1 million tablets from a Canadian manufacturer
It has failed to do so
Canada did override Bayer’s patent and ordered 1 million tablets from a Canadian manufacturer
Слайд 145Why?
Weakening of case at WTO meetings that the massive suffering consequent
to 25 million AIDS cases in Sub-Saharan Africa did not constitute enough of a public health emergency to permit those countries to obtain and produce cheaper generic versions of largely unavailable AIDS drugs
-Africa accounts for 1% of world drug sales
-Africa accounts for 1% of world drug sales
Слайд 146Other Consequences
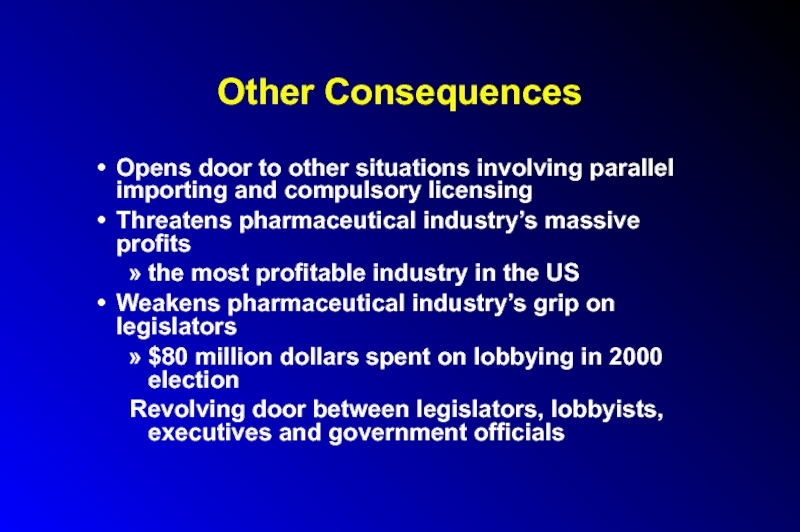
Opens door to other situations involving parallel importing and compulsory
licensing
Threatens pharmaceutical industry’s massive profits
the most profitable industry in the US
Weakens pharmaceutical industry’s grip on legislators
$80 million dollars spent on lobbying in 2000 election
Revolving door between legislators, lobbyists, executives and government officials
Threatens pharmaceutical industry’s massive profits
the most profitable industry in the US
Weakens pharmaceutical industry’s grip on legislators
$80 million dollars spent on lobbying in 2000 election
Revolving door between legislators, lobbyists, executives and government officials
Слайд 147Bayer
Based in Leverkusen, Germany
120,000 employees worldwide
Annual sales = $28 billion
US =
largest market
Слайд 148Bayer
Pharmaceuticals
Third largest manufacturer of herbicides in the world
Dominates insecticide market
Слайд 149Bayer
Number one biotech company in Europe (after 2001 purchase of Aventis
CropScience)
Controls over half of genetically-modified crop varieties up for approval for commercial use
Risks of GMOs
Controls over half of genetically-modified crop varieties up for approval for commercial use
Risks of GMOs
Слайд 150History of Bayer
WW I: invented modern chemical warfare; developed “School for
Chemical Warfare”
WW II: part of IG Farben conglomerate, which exploited slave labor at Auschwitz, conducted unethical human subject experiments
WW II: part of IG Farben conglomerate, which exploited slave labor at Auschwitz, conducted unethical human subject experiments
Слайд 151History of Bayer
Early 1990s – admitted knowingly selling HIV-tainted blood clotting
products which infected up to 50% of hemophiliacs in some developed countries
US Class action suits settled for $100,000 per claimant
European taxpayers left to foot most of bill
US Class action suits settled for $100,000 per claimant
European taxpayers left to foot most of bill
Слайд 152History of Bayer
1995 onward - failed to follow promise to withdraw
its most toxic pesticides from the market
Failed to educate farmers in developing nations re pesticide health risks
2 to 10 million poisonings / 200,000 deaths per year due to pesticides (WHO)
Failed to educate farmers in developing nations re pesticide health risks
2 to 10 million poisonings / 200,000 deaths per year due to pesticides (WHO)
Слайд 153History of Bayer
1998 –pays Scottish adult volunteers $750 to swallow doses
of the insecticide Guthion to “prove product’s safety”
Suing the FDA to lift moratorium on human-derived data
2000 – cited by FDA and FTC for misleading claims regarding aspirin and heart attacks/strokes
Suing the FDA to lift moratorium on human-derived data
2000 – cited by FDA and FTC for misleading claims regarding aspirin and heart attacks/strokes
Слайд 154History of Bayer
2000 – fined by OSHA for workplace safety violations
related to MDA (carcinogen) exposures
2000 – fined by Commerce Dept. for violations of export laws
2000 – fined by Commerce Dept. for violations of export laws
Слайд 155History of Bayer
2001 – FDA-reported violations in quality control contribute to
worldwide clotting factor shortage for hemophiliacs
2002 - Baycol (cholesterol lowering drug) withdrawn from market
2002 - Baycol (cholesterol lowering drug) withdrawn from market
Слайд 156Bayer’s Corporate Agenda
Bluewash: signatory to UN’s Global Compact
Greenwash: “crop protection” (pesticides)
Promotion
of anti-environmental health agenda: “Wise Use,” “Responsible Care” movements
Слайд 157Bayer’s Corporate Agenda
Corporate Front Groups: “Global Crop Protection Federation”
Harrassment / SLAPP
suits against watchdog groups
e.g., Coalition Against Bayer Dangers
e.g., Coalition Against Bayer Dangers
Слайд 158Bayer’s Corporate Agenda
Lobbying / Campaign donations / Influence peddling:
Member of numerous
lobbying groups attacking “trade barriers” (i.e., environmental health and safety laws)
$600,000 over last five years to US politicians
$120,000 to GW Bush’s election campaign
$600,000 over last five years to US politicians
$120,000 to GW Bush’s election campaign
Слайд 159Bayer
Fortune Magazine (2001): one of the “most admired companies” in the
United States
Multinational Monitor (2001): one of the 10 worst corporations of the year
Multinational Monitor (2001): one of the 10 worst corporations of the year
Слайд 160Conclusions
Triumph of corporate profits and influence-peddling over urgent public health needs
Stronger
regulation needed over:
Agricultural antibiotic use
Drug pricing
Stiffer penalties for corporate malfeasance necessary (fines and jail time)
Important role of medical/public health organizations and the media
Agricultural antibiotic use
Drug pricing
Stiffer penalties for corporate malfeasance necessary (fines and jail time)
Important role of medical/public health organizations and the media
Слайд 161Frankenfoods
(aka “Brave New Foods”)
Genetically-engineered seeds are now being used to
plant 25% of America’s corn crop, 30% of it’s soybeans, and 50% of canola
At least 60% of convenience foods now sold in the U.S. contain genetically-altered ingredients
No labeling required
FDA and EPA: Genetically-altered foods “have not been shown to be unsafe.”
1998 Nature study - transgenic traits 20x more likely to “flow” to other plants by cross-pollination
At least 60% of convenience foods now sold in the U.S. contain genetically-altered ingredients
No labeling required
FDA and EPA: Genetically-altered foods “have not been shown to be unsafe.”
1998 Nature study - transgenic traits 20x more likely to “flow” to other plants by cross-pollination
Слайд 162Frankenfoods
Bacillus thuringiensis corn - resistant to the corn-boring bug, but pollen
from corn lands on milkweed, which monarch butterfly larvae and caterpillars eat → death.
Beans and grains with more protein
caffeine-less coffee beans
strawberries packed with more natural sugars
red grass, mauve carnations
Companies - Shell, Monsanto, Mitsubishi, Sandoz, Aventis, Pharmacia, Hoechst
Beans and grains with more protein
caffeine-less coffee beans
strawberries packed with more natural sugars
red grass, mauve carnations
Companies - Shell, Monsanto, Mitsubishi, Sandoz, Aventis, Pharmacia, Hoechst
Слайд 163Frankenfoods
FDA being sued for allowing genetically-engineered foods on the market without
adequate safety review
FDA reviewer worked for Monsanto before and after his FDA tenure
Majority of Americans unaware GM foods already widely marketed
Japan - labeling common; India - bans testing of altered crops; British Medical Association has called for a ban on testing and production
FDA reviewer worked for Monsanto before and after his FDA tenure
Majority of Americans unaware GM foods already widely marketed
Japan - labeling common; India - bans testing of altered crops; British Medical Association has called for a ban on testing and production
Слайд 164Excessive Paper Packaging in Pharmaceutical Samples
Paper packaging 39% of US garbage;
only 42% recycled; landfill space decreasing
Deforestation
One of each IM clinic drug samples:
paper packaging 65% of overall package weight
pill volume/paper product box volume = 0.0132
Sample packages large, waste paper, take up excessive space
Deforestation
One of each IM clinic drug samples:
paper packaging 65% of overall package weight
pill volume/paper product box volume = 0.0132
Sample packages large, waste paper, take up excessive space
Слайд 165The History of U.S. Drug Regulation
1785: Massachusetts - first food
adulteration law
1848: Drug Importation Act – prohibits importation of unsafe or adulterated drugs
1902: Biologics Control Act – gives government regulatory power over antitoxin and vaccine development
1848: Drug Importation Act – prohibits importation of unsafe or adulterated drugs
1902: Biologics Control Act – gives government regulatory power over antitoxin and vaccine development
Слайд 166The History of Drug Regulation
1906: Pure Food and Drug Law
(The Jungle)
1912:
Shirley Amendment
-makes false advertising illegal
1914: Harrison Narcotic Act -criminalizes distribution and possession of certain psychoactive drugs (1960s - LSD, 1980s - Ecstasy)
1914: Harrison Narcotic Act -criminalizes distribution and possession of certain psychoactive drugs (1960s - LSD, 1980s - Ecstasy)
Слайд 167The History of U.S. Drug Regulation
1927: Caustic Poison Act
-warning labels, antidote
information required
1938: Food, Drug and Cosmetic Act -establishes FDA
-Drug safety required pre-marketing
-diethylene glycol in Elixir of Sulfonamide
1938: Food, Drug and Cosmetic Act -establishes FDA
-Drug safety required pre-marketing
-diethylene glycol in Elixir of Sulfonamide
Слайд 168The History of U.S. Drug Regulation
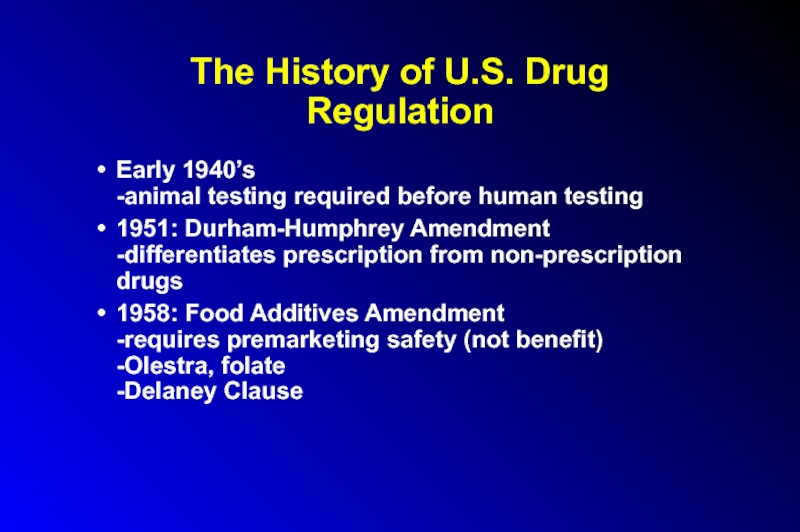
Early 1940’s
-animal testing required before human
testing
1951: Durham-Humphrey Amendment -differentiates prescription from non-prescription drugs
1958: Food Additives Amendment -requires premarketing safety (not benefit) -Olestra, folate -Delaney Clause
1951: Durham-Humphrey Amendment -differentiates prescription from non-prescription drugs
1958: Food Additives Amendment -requires premarketing safety (not benefit) -Olestra, folate -Delaney Clause
Слайд 169The History of U.S. Drug Regulation
1962: Kefauver-Harris Amendment
-response to thalidomide crisis
-requires
pre-marketing effectiveness
1974: Proxmire Amendment:
-“nutritional supplements are not drugs”
1974: Proxmire Amendment:
-“nutritional supplements are not drugs”
Слайд 170The History of Drug Regulation
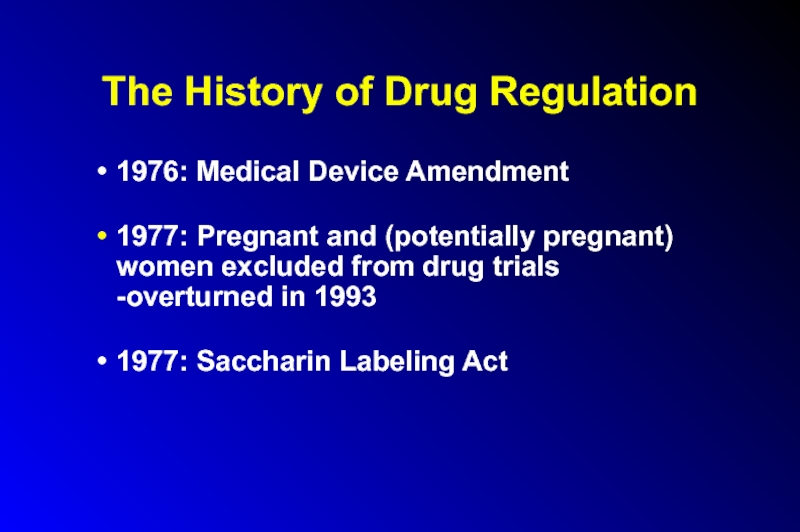
1976: Medical Device Amendment
1977: Pregnant and (potentially
pregnant) women excluded from drug trials
-overturned in 1993
1977: Saccharin Labeling Act
1977: Saccharin Labeling Act
Слайд 171
The History of U.S. Drug Regulation
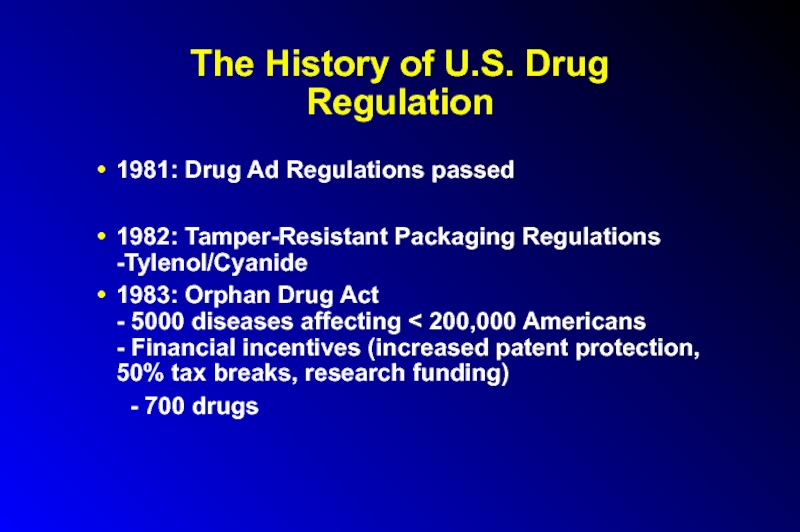
1981: Drug Ad Regulations passed
1982: Tamper-Resistant
Packaging Regulations
-Tylenol/Cyanide
1983: Orphan Drug Act - 5000 diseases affecting < 200,000 Americans - Financial incentives (increased patent protection, 50% tax breaks, research funding)
- 700 drugs
1983: Orphan Drug Act - 5000 diseases affecting < 200,000 Americans - Financial incentives (increased patent protection, 50% tax breaks, research funding)
- 700 drugs
Слайд 172The History of U.S. Drug Regulation
ODA: More than 40 drugs developed,
including 28 new molecular entities
-Ceredase, rHGH, r-EPO
-Controversies
-1991 Modification (patent lapses after $200 million in cumulative sales)
1984: Drug Price Competition and Patent Restoration Act -generic bioequivalance, rather than therapeutic equivalence, now required for approval
-1991 Modification (patent lapses after $200 million in cumulative sales)
1984: Drug Price Competition and Patent Restoration Act -generic bioequivalance, rather than therapeutic equivalence, now required for approval
Слайд 173The History of U.S. Drug Regulation
1994: Dietary Supplement Health and Education
Act
-supplements excluded from purity, composition, effectiveness and safety review
-supported by Orrin Hatch (R-Utah), recipient of $169,000 from pharm ind in 2000, more than any other Senator) -Office of Dietary Supplements established at NIH
-supported by Orrin Hatch (R-Utah), recipient of $169,000 from pharm ind in 2000, more than any other Senator) -Office of Dietary Supplements established at NIH
Слайд 174The FDA: Current Issues
Nicotine/Cigarette regulation
Policies re transgenic foods
Guidelines on industry-sponsored events,
texts and reprints, gifts, speakers fees
Codes of conduct, renunciation of human rights abuses (e.g., use of pharmaceuticals in lethal injections)
Codes of conduct, renunciation of human rights abuses (e.g., use of pharmaceuticals in lethal injections)
Слайд 175The FDA: Current Issues
Waiver of informed consent during wartime
-Pyridostigmine
-Botulinum-toxoid
vaccine
Regulation of drug promotion on the Internet -links between websites -international issues -chatrooms and newsgroups
Funding/existence uncertain -S.B. 830
Regulation of drug promotion on the Internet -links between websites -international issues -chatrooms and newsgroups
Funding/existence uncertain -S.B. 830
Слайд 176The FDA Modernization and Accountability Act of 1997 (SB-830)
Cuts from
2 to 1 the number of trials required to show efficacy and safety for new drugs and devices
Allows manufacturers to make unproved claims regarding the costs and health care consequences of their products to bulk purchasers
Allows device manufacturers to choose their own safety/efficacy reviewer, with whom they can negotiate payment terms directly
Removes mandatory post-marketing surveillance of implantable medical devices
Слайд 177US Drug Regulation
2002: The Best Pharmaceuticals Act for Children
Extends patent protection
when companies promise to conduct additional studies in children
No oversight mechanism
Ethical issues re drug research in children
No oversight mechanism
Ethical issues re drug research in children
Слайд 178FDA Oversight
2100 scientists in 40 labs in Washington, D.C. and around
the U.S.
1100 investigators and inspectors
Monitor and inspect 95,000 FDA-regulated businesses
Visit >15,000 facilities per year
Collect 80,000 domestic and imported product samples for label checks
1100 investigators and inspectors
Monitor and inspect 95,000 FDA-regulated businesses
Visit >15,000 facilities per year
Collect 80,000 domestic and imported product samples for label checks
Слайд 179FDA Oversight
3000 products per year found to be unfit for consumers
and withdrawn from marketplace
30,000 import shipments per year declined at port of entry because the goods appear to be unacceptable for use in the United States
30,000 import shipments per year declined at port of entry because the goods appear to be unacceptable for use in the United States
Слайд 180FDA Oversight
U.S. outpaces Germany and Japan (and equals the UK) in
rate of approving new drugs
Avg. time to approval 14 mos (2000) vs 34 mos (1993)
Regulation success stories -thalidomide
Avg. time to approval 14 mos (2000) vs 34 mos (1993)
Regulation success stories -thalidomide
Слайд 181FDA Oversight
“Me too” drugs vs. “new molecular entities”
FDA approved 341 NMEs
from 1991-2001
User fees speed review and approval
>$300,000/drug
Over half of FDA scientific experts conducting drug application review have financial conflicts of interest because of industry ties.
User fees speed review and approval
>$300,000/drug
Over half of FDA scientific experts conducting drug application review have financial conflicts of interest because of industry ties.
Слайд 182FDA Oversight
17 FDA-initiated market withdrawals, 1970-1995
-temafloxocin, flosequinan, Redux, Rezulin, etc.
9 withdrawals
over last 6 years
Lotronex (off/on), Rezulin, Duract, Policor, Trovan, Raxar, Baycol, etc.
Lotronex (off/on), Rezulin, Duract, Policor, Trovan, Raxar, Baycol, etc.
Слайд 183FDA Oversight: Recalls and Safety Alerts
52 advisories involving 408,500 pacemakers and
114,645 ICDs from 1/90 - 12/00
increasing rate between 1995 and 2000
Over 1000 devices recalled each year
1.3 million device checks and analyses
36,187 device replacements
$870 million
increasing rate between 1995 and 2000
Over 1000 devices recalled each year
1.3 million device checks and analyses
36,187 device replacements
$870 million
Слайд 184FDA Oversight
Ad review and phase 4 studies (post-marketing surveillance) underfunded ($17
million annually for safety review = amount Americans spend on prescription drugs in 90 minutes)
completion rates of phase 4 commitments <10%
more than half the experts hired to advise the FDA on drug safety have industry ties
At 55% of FDA meetings between 1/98 and 6/00, at least half the members had a financial stake in the proceedings
completion rates of phase 4 commitments <10%
more than half the experts hired to advise the FDA on drug safety have industry ties
At 55% of FDA meetings between 1/98 and 6/00, at least half the members had a financial stake in the proceedings
Слайд 185Criminal activities
FTC investigating
Astra-Zeneca for blocking generic competition for Prilosec;
Bristol-Meyers Squibb
for illegally preventing competitors from selling generic versions of Taxol
Mylan laboratories for illegally tying up chemical feed-stocks used to make generic lorazepam
Hoechst for preventing Cardizem CD from going generic
Mylan laboratories for illegally tying up chemical feed-stocks used to make generic lorazepam
Hoechst for preventing Cardizem CD from going generic
Слайд 186Criminal activities
Schering-Plough charged with paying $90 million to 2 competitors to
postpone introduction of generic versions of K-Dur
Pfizer to pay $49 million for Medicaid fraud re Lipitor charges
Schering-Plough to pay $500 million in connection with production o 125 different drugs in factories that failed to comply with good manufacturing practices
Pfizer to pay $49 million for Medicaid fraud re Lipitor charges
Schering-Plough to pay $500 million in connection with production o 125 different drugs in factories that failed to comply with good manufacturing practices
Слайд 187Criminal activities
Lilly pleaded guilty to criminal charges for withholding information from
the FDA about deaths and life-threatening drug reactions due to Oraflex
49 deaths + 1,000 serious injuries
$45,000 fine
SmithKline/Selacryn
36 deaths; 500 cases of liver and kidney damage
$34,000 fine
49 deaths + 1,000 serious injuries
$45,000 fine
SmithKline/Selacryn
36 deaths; 500 cases of liver and kidney damage
$34,000 fine
Слайд 188Criminal activities
Wholesale price manipulation
Bayer AG, Abbott Labs, SmithKline Beecham, Glaxo Wellcome,
and Bristol-Myers Squibb under investigation by HCFA for overcharging Medicare and Medicaid at least $1 billion/year
Vitamin price fixing
Guilty pleas and fines: Hoffman LaRoche, BASF AG, Aventis SA, Takeda, Eisai, and Daichi
Vitamin price fixing
Guilty pleas and fines: Hoffman LaRoche, BASF AG, Aventis SA, Takeda, Eisai, and Daichi
Слайд 189Investigations / Possible Criminal Activities
Justice Department investigating:
Metabolife for falsification of ephedra
safety data
Merck and Co. and Briston-Myers Squibb for sales and accounting practices
Johnson and Johnson for alleged manufacturing improprieties in Puerto Rico
Warner-Lambert for hiding dangers of Rezulin
Merck and Co. and Briston-Myers Squibb for sales and accounting practices
Johnson and Johnson for alleged manufacturing improprieties in Puerto Rico
Warner-Lambert for hiding dangers of Rezulin
Слайд 190Investigations / Possible Criminal Activities
?Criminal charges?
Albuterol-less inhalers from Schering Plough
sloppy manufacturing;
delayed recall
NEJM Editor Drazen cited by FDA in 1999 for making “false and misleading” statements about levalbuterol
NEJM Editor Drazen cited by FDA in 1999 for making “false and misleading” statements about levalbuterol
Слайд 191Drug Companies Behaving Badly:
The 10 Worst Corporations of 2002
*Multinational Monitor
Wyeth
Revealed that
Ayerst (subsidiary) had funded Dr Robert Wilson’s 1966 book “Feminine Forever”
Labeling menopause as a disease, promoting HRT as “cure” for maintenance of beauty
Schering Plough:
Justice Dept. investigation for price-fixing
Federal investigation of Medicaid fraud
$500 million fine for repeated failures to fix manufacturing plant problems in NJ and Puerto Rico
Labeling menopause as a disease, promoting HRT as “cure” for maintenance of beauty
Schering Plough:
Justice Dept. investigation for price-fixing
Federal investigation of Medicaid fraud
$500 million fine for repeated failures to fix manufacturing plant problems in NJ and Puerto Rico
Слайд 192Third World “Donations” (Dumping) of Pharmaceuticals
Genuine gifts
Dubious “gifts” -- reasons:
-clear
out stocks of nearly-expired drugs/poor sellers
-tax write-offs (up to 2x production costs)
Слайд 193Third World “Donations” (Dumping)
of Pharmaceuticals
Egregious Examples:
-Expired Ceclor to Central
Africa
-Garlic pills and TUMS to Rwanda
-50% of donations to Bosnia expired or medically worthless
Recommendations: -WHO list of essential drugs -Expired date at least 1 year away
-50% of donations to Bosnia expired or medically worthless
Recommendations: -WHO list of essential drugs -Expired date at least 1 year away
Слайд 194Anti-AIDS Drugs and Africa
36 million infected with HIV; 2/3 in sub-Saharan
Africa (1.3% of global pharmaceutical market)
Only 1/1000 S. African AIDS patients getting anti-HIV drugs
PHRMA lawsuit vs South Africa (supported by US govt)
parallel importing
compulsory licensing
dropped after activist campaign
US donation to UN AIDS Relief Fund = $200 million
Only 1/1000 S. African AIDS patients getting anti-HIV drugs
PHRMA lawsuit vs South Africa (supported by US govt)
parallel importing
compulsory licensing
dropped after activist campaign
US donation to UN AIDS Relief Fund = $200 million
Слайд 195The FDA: The Future
Trade name review prior to marketing approval
-Losec/Lasix
Mandated patient
package inserts
Criminal sanctions for repeat advertising regulations violators
Simplify oversight -problems with benzodiazepine triplicate forms
International clinical trials registry
Criminal sanctions for repeat advertising regulations violators
Simplify oversight -problems with benzodiazepine triplicate forms
International clinical trials registry
Слайд 196The Internet and Pharmaceuticals
New website created q 3 seconds
1/4 of websites
have health information
Unethical sales (e.g., Viagra)
AMA and FDA oppose on-line prescribing; states passing laws to prohibit
Unethical sales (e.g., Viagra)
AMA and FDA oppose on-line prescribing; states passing laws to prohibit
Слайд 197The Internet and Pharmaceuticals
Free software / Physician profiling
“ePocrates”
Internet pharmacies
$1.9 billion sales
(1999); expected to reach $20-25 billion by 2005
privacy concerns
privacy concerns
Слайд 198Physician Prescribing Habits
Influences
-texts, journals, colleagues, marketing and advertising
-ego bias
-how benefits presented
-average
vs stratified life expectancy gains
-NNT
-Cost effectiveness
-how side effects presented
-# affected vs # withdrawing from study
Слайд 199Physician Prescribing Habits
Influences
-texts, journals, colleagues, marketing, and advertising
-ego bias
-how benefits presented
-average
vs stratified life expectancy gains
NNT
-Cost effectiveness
-how side effects presented
-# affected vs # withdrawing from study
Слайд 200Physician Prescribing Habits
Up to 85% of residents prescribe to non-patients
50% of
residents self-prescribe
early 1990s - benzos
2000 - SSRIS for depression, antihistamines for sleep
early 1990s - benzos
2000 - SSRIS for depression, antihistamines for sleep
Слайд 201Pharmaceuticals Sales Reps’ Techniques
Appeal to authority
Appeal to popularity
The “red herring”
Appeal to
pity (Dryden - “Pity melts the mind”)
Слайд 202Pharmaceuticals Sales Reps’ Techniques
Appeal to curiosity
Free food/gifts
Testimonials
Relationship building/face time
Слайд 203Pharmaceutical Sales Reps’ Techniques
Active learning -- reinforcement plus change
Favorable but
inaccurate statements
Negative comments re competitors’ products
Reprints not conforming to FDA regulations
Negative comments re competitors’ products
Reprints not conforming to FDA regulations
Слайд 204Relating to Pharmaceutical Reps
Awareness of sales tactics
Question them, ask for references
Level
of presence
-open vs locked-out (it would cost < $100,000/yr to feed 30 residents lunch each weekday)
-benefits/harms
-benefits/harms
Слайд 205Academia and Industry
US R&D (2000):
industry - $55-60 billion
federal government - $25
billion
private foundations - $8-10 billion
Industry funds 8-40% of university research (a 7-fold increase since 1970)
private foundations - $8-10 billion
Industry funds 8-40% of university research (a 7-fold increase since 1970)
Слайд 206Academia and Industry
1991: 80% of industry sponsored clinical trials performed in
non-profit academic medical centers
70¢ of every pharmaceutical industry research dollar
2001: 40% (60% in CROs)
34¢
70¢ of every pharmaceutical industry research dollar
2001: 40% (60% in CROs)
34¢
Слайд 207CROs and SMOs
Contract Research Organizations (CROs): provide central oversight and management
of clinical trials
Site Management Organizations (SMOs): organize physicians’ offices into trial networks and oversee the rapid recruitment of patients
Site Management Organizations (SMOs): organize physicians’ offices into trial networks and oversee the rapid recruitment of patients
Слайд 208Academia and Industry
3-fold increase in the number of physicians conducting “research”
in the last decade
“Investigators” can make from $500 to $6000 per enrolled subject
Active recruiters can make from $500,000 to $1 million per year
“Investigators” can make from $500 to $6000 per enrolled subject
Active recruiters can make from $500,000 to $1 million per year
Слайд 209Unfunded Studies
23% in 1 month
-53% of these were case series
29% involved
unaccounted-for direct clinical costs
-?passed on to patients or 3rd party payers?
Слайд 210Academia and Industry
Majority of authors of Clinical Practice Guidelines have industry
ties
Authors of NEJM reviews and editorials can accept up to $10,000/year in speaking and consulting fees from each company about whose products they are writing
Authors of NEJM reviews and editorials can accept up to $10,000/year in speaking and consulting fees from each company about whose products they are writing
Слайд 211Academia and Industry
Increasing exclusive university - corporate agreements
MIT – 5 yr,
$15 million deal with Merck and Co. for patent rights to joint discoveries
DFCI – Novartis
Many other examples
DFCI – Novartis
Many other examples
Слайд 212Academia, Industry and Medical Research
1999-2001: Federal authorities restricted or shut down
human subject research at 9 universities
E.g., Jesse Geisinger case at U Penn:
Gene therapy experiment
Not disclosed to patient:
University had equity stake in the company sponsoring the study
Reports of serious adverse events and deaths in monkeys
E.g., Jesse Geisinger case at U Penn:
Gene therapy experiment
Not disclosed to patient:
University had equity stake in the company sponsoring the study
Reports of serious adverse events and deaths in monkeys
Слайд 213Academia - Industry Collaboration
¼ of scientific investigators have industry affiliations
2/3 of
academic institutions hold equity in start-ups that sponsor research at the same institutions
Up to 80% of science and engineering faculty perform outside consultations
Academic entrepreneurs, patents -e.g., Herbert Boyer, U.C.S.F., Genentech
Up to 80% of science and engineering faculty perform outside consultations
Academic entrepreneurs, patents -e.g., Herbert Boyer, U.C.S.F., Genentech
Слайд 214Collaboration Difficulties
Complicated university beaureacracies/regulations - 50%
Disputes over intellectual property - 34%
Changes
in academic research focus - 33%
Conflict of interest - 30%
Misconduct/poor science - 12%
Conflict of interest - 30%
Misconduct/poor science - 12%
Слайд 215Collaboration Difficulties
Impaired sharing of knowledge, materials
Difficulty in repeating/verifying important research
Driven by
usual academic competitive jealousies, fears of contract violations and subsequent litigation, and desire to protect financial interests and keep stock prices high
Слайд 216Educational Concerns Regarding Industry Funded Research
Diversion of faculty away from teaching,
towards more remunerative consultations
Faculty change research direction
Fellows/post-docs diverted to industry-related topics
Publication delays affect career development
Faculty change research direction
Fellows/post-docs diverted to industry-related topics
Publication delays affect career development
Слайд 217Concerns Re Research in the U.S.
Inverse relationship between growth in NIH
awards during the past decade and managed care penetration
Decreasing funding for patient-oriented research
Low enrollment causing delays in evaluating cancer medications (< 5% of patients participate in clinical trials)
Insurance coverage of clinical trials decreasing
Decreasing funding for patient-oriented research
Low enrollment causing delays in evaluating cancer medications (< 5% of patients participate in clinical trials)
Insurance coverage of clinical trials decreasing
Слайд 218Withholding of Data
Only 12% of university conflict of interest policies
specify limits on permissible delays in publication
Reasons for withholding of data: -Competition -Recognition/protect scientific lead -Patent application -Intellectual property disputes
Results of withholding of data: -Unnecessary duplication -Slows development and testing of new drugs
Reasons for withholding of data: -Competition -Recognition/protect scientific lead -Patent application -Intellectual property disputes
Results of withholding of data: -Unnecessary duplication -Slows development and testing of new drugs
Слайд 219Withholding of Data: Examples
Chamberlin family - obstetrical forceps
UCSF Synthroid study (Boots/Knoll
Pharmaceuticals)
JAMA Celebrex (Pharmacia) study: fewer ulcers than ibuprofen at 6 months, but no difference at one year (only 6 month data submitted and published)
comparisons with genetic code
implications for health services research, public health
JAMA Celebrex (Pharmacia) study: fewer ulcers than ibuprofen at 6 months, but no difference at one year (only 6 month data submitted and published)
comparisons with genetic code
implications for health services research, public health
Слайд 220Industry/Special Interest Groups and Researchers
CDC gun violence studies - NRA
Breast Implants
- Congress, Women’s Groups
Lead exposure studies - (Needleman) - lead industry
Lead exposure studies - (Needleman) - lead industry
Слайд 221Industry/Special Interest Groups and Researchers
Spinal fusion - North American Spine Society,
pedicle screw manufacturers
Multiple Chemical Sensitivity Syndrome - patient advocacy groups, attorneys, immunodiagnostic testing labs
Pharmaceutical company / tobacco company financial ties, conflicts of interest
Multiple Chemical Sensitivity Syndrome - patient advocacy groups, attorneys, immunodiagnostic testing labs
Pharmaceutical company / tobacco company financial ties, conflicts of interest
Слайд 222Harassment of Researchers
Betty Dong/UCSF (Synthroid) - Boots/Knoll Pharmaceuticals
Nancy Oliveri/University of Toronto
(deferipone) - Apotex
UCSF (Remimmune) - Immune Response Corporation
UCSF (Remimmune) - Immune Response Corporation
Слайд 223Harassment of Researchers
David Healy/University of Toronto (Prozac) - Eli Lilly
Anne Holbrook/McMaster
U/ PUD-GERD panel (Prilosec) - Astra Zeneca
David Kern/Brown U (“flock workers’ lung) – Microfibres
Tobacco companies – multiple lawsuits against universities
David Kern/Brown U (“flock workers’ lung) – Microfibres
Tobacco companies – multiple lawsuits against universities
Слайд 224The Pharmaceutical Industry and Medical Ethics
Funding of conferences, Centers of Ethics,
individual investigators
E.g., $1 million gift from SmithKline Beecham to Stanford University Center for Biomedical Ethics
Rapid growth of for-profit non-institutional review boards (NIRBs)
Using patents to inhibit other companies’ research
The Tragedy of the Anti-Commons
E.g., $1 million gift from SmithKline Beecham to Stanford University Center for Biomedical Ethics
Rapid growth of for-profit non-institutional review boards (NIRBs)
Using patents to inhibit other companies’ research
The Tragedy of the Anti-Commons
Слайд 225The Pharmaceutical Industry and Medical Ethics
Ethics consultants serving on corporate boards
E.g.,
Harold Shapiro continued to draw annual director’s salary from Dow Chemical while serving as Chair of NBAC
Most bioethics journals do not require conflict of interest disclosures
Loss of appearance of independence; damage to credibility
Pharmaceutical industry involvement in research and production of chemical warfare agents and drugs used to facilitate executions
Most bioethics journals do not require conflict of interest disclosures
Loss of appearance of independence; damage to credibility
Pharmaceutical industry involvement in research and production of chemical warfare agents and drugs used to facilitate executions
Слайд 226Recommendations for Industry-Sponsored Research
Written agreements with university, not researcher
Alternatives selected based
on clinical relevance
Stepwise project results not provided to sponsor until study is funded and open publication guaranteed
Stepwise project results not provided to sponsor until study is funded and open publication guaranteed
Слайд 227Recommendations for Industry-Sponsored Research
Full disclosure of conflicts of interest
No gag
clauses regarding publication
Investigator not to act as consultant during study
Database of clinical trials
Investigator not to act as consultant during study
Database of clinical trials
Слайд 228Industry/Special Interest Groups and Researchers/Societies
Pork barrel research funding - Congress
c.f., legislating
medical practice - e.g., drive-through deliveries
APHA: Colgate-Palmolive; AHA: Genentech; AMA - Sunbeam (dissolved)
APHA: Colgate-Palmolive; AHA: Genentech; AMA - Sunbeam (dissolved)
Слайд 229AMA Guidelines Re Gifts to Physicians from Industry
Minimal value gifts
O.K.
-pens, notepads, modest meals, textbooks
Film, videos, CDs; “Dinner to Go” (Merck); “Look for a Book” GlaxoSmithKline PLC); Palm Pilots (Dupont)
No cash gifts
Film, videos, CDs; “Dinner to Go” (Merck); “Look for a Book” GlaxoSmithKline PLC); Palm Pilots (Dupont)
No cash gifts
Слайд 230AMA Guidelines Re Gifts to Physicians from Industry
No gifts with strings
attached
CME sponsorship money to conference sponsor, not participating physicians
Meeting expenses for trainees funneled through institution
CME sponsorship money to conference sponsor, not participating physicians
Meeting expenses for trainees funneled through institution
Слайд 231AMA Guidelines Re Gifts to Physicians from Industry
AMA $1 million “educational”
campaign:
- $325,000 from AMA
- 9 drug companies to contribute the rest
Vermont law now requires physicians to disclose all gifts over $25
- $325,000 from AMA
- 9 drug companies to contribute the rest
Vermont law now requires physicians to disclose all gifts over $25
Слайд 232Patients’ Attitudes Toward Pharmaceutical Company Gifts
(Gibbons et al.)
200 patients, 270 physicians
1/2
of patients aware
1/4 believe their doctor(s) accepted gifts
1/3 felt costs passed along to patients
Patients felt gifts less appropriate then did physicians
Physicians and patients disagree on appropriateness of seeding trial payments (La Puma, et al.)
1/4 believe their doctor(s) accepted gifts
1/3 felt costs passed along to patients
Patients felt gifts less appropriate then did physicians
Physicians and patients disagree on appropriateness of seeding trial payments (La Puma, et al.)
Слайд 233Guidelines for Speakers at Industry-Sponsored Events
Educational, not promotional
Based on
scientific data and clinical experience
Full disclosure of relationship with company and honoraria
Travel expenses not lavish
Few mechanisms for surveillance/guideline enforcement
Full disclosure of relationship with company and honoraria
Travel expenses not lavish
Few mechanisms for surveillance/guideline enforcement
Слайд 234Trends to Watch For
Drug companies buying health providers
-Zeneca Group/Salick Health Care
Drug
companies purchasing Pharmaceutical Benefits Managers and Disease Management Groups
Слайд 235Trends to Watch For
Medical school / drug company alliances
Novartis - UC
Berkeley; Pharmacia - Wash U. in St Louis; Ribazyme - Univ. of CO; Pfizer -BIH; Novartis -DFCI; Shiseido - MGH
CME - Medical Education and Communication Companies
paid mainly by drug companies; provide “educational” materials gratis
1/2 of the $1.1 billion spent on CME in 1999
CME - Medical Education and Communication Companies
paid mainly by drug companies; provide “educational” materials gratis
1/2 of the $1.1 billion spent on CME in 1999
Слайд 236Human Experimentation: US and Abroad
90% of health research dollars are spent
on the health problems of 10% of the world’s population - research on major diseases of the developing world underfunded, not profitable
Third World experimentation with inappropriate placebo-controls: AIDS drugs/Africa; Sulfazyme/Brazil
Stop-gap source of care / meds for poor
Third World experimentation with inappropriate placebo-controls: AIDS drugs/Africa; Sulfazyme/Brazil
Stop-gap source of care / meds for poor
Слайд 237Human Experimentation: US and Abroad
Human Experimentation Companies
For-Profit IRBs
Private-practice-based “investigators”
Слайд 238Enhancing Cooperation Between Physicians and the Pharmaceutical Industry
Improving compliance
Decreasing adverse events
Promotion
and funding of basic science and clinical research
Слайд 239Conclusions
Pharmaceuticals and Biotechnology Industries
-Tremendous contributions to health
-Motivation = “alleviate suffering”
-Primary responsibility
= “make money for shareholders”
Awareness of worrisome trends in the business of drugs, research and health care
Advocate locally and nationally for solutions
Awareness of worrisome trends in the business of drugs, research and health care
Advocate locally and nationally for solutions
Слайд 240Useful Phone Numbers
FDA and Regulated Products Info
1-800-222-0185
Medwatch/Adverse Events Reporting
1-800-332-1088
Advertising/Promotion/Marketing Concerns
1-800-238-7332
Prescription Drug
Indigent Programs
1-800-PMA-INFO
Medications Assistance Program (OHSU) x4-1457
Medications Assistance Program (OHSU) x4-1457

