- Главная
- Разное
- Дизайн
- Бизнес и предпринимательство
- Аналитика
- Образование
- Развлечения
- Красота и здоровье
- Финансы
- Государство
- Путешествия
- Спорт
- Недвижимость
- Армия
- Графика
- Культурология
- Еда и кулинария
- Лингвистика
- Английский язык
- Астрономия
- Алгебра
- Биология
- География
- Детские презентации
- Информатика
- История
- Литература
- Маркетинг
- Математика
- Медицина
- Менеджмент
- Музыка
- МХК
- Немецкий язык
- ОБЖ
- Обществознание
- Окружающий мир
- Педагогика
- Русский язык
- Технология
- Физика
- Философия
- Химия
- Шаблоны, картинки для презентаций
- Экология
- Экономика
- Юриспруденция
Equity Valuation презентация
Содержание
- 1. Equity Valuation
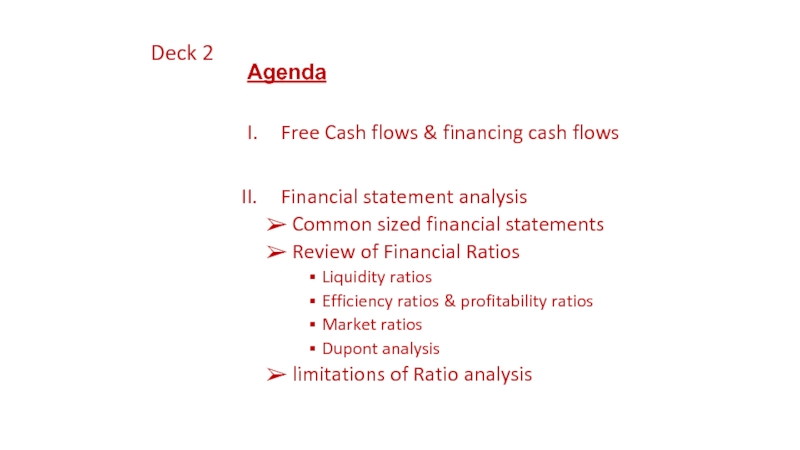
- 2. Deck 2 Agenda Free Cash
- 3. Section I Free Cash flows & financing cash flows
- 4. Let’s dive into Cash Flows CF versus
- 5. Cash flows? Free Cash Flow
- 6. CF statement The CF Statement shows the
- 7. Sections in the Cash Flow Statement Cash
- 8. Free Cash Flow Free Cash Flow (FCF):
- 9. Operating cash flows Cash flows linked to
- 10. Computing Operating CF Operating CF = EBIT
- 11. Investing cash flows Cash flows describing the
- 12. Computing Investing CF investing cash flow has
- 13. Financing Cash Flows A firm can either
- 14. Computing the Financing CF Financing Cash
- 15. Cash Flow Statement Direct vs. Indirect Method
- 16. FCF FCF = Operating CF + investing
- 17. Interpreting Free Cash Flows Does Positive or
- 18. Incremental cash flows Further, after-tax free cash
- 19. Beware of diverted cash flows Not all
- 20. Working capital requirement New projects require infusion
- 21. Sunk Costs Sunk costs are cash flows
- 22. Opportunity Costs Opportunity cost refers to cash
- 23. Overhead Costs Incremental overhead costs or costs
- 24. Interest Payments and Financing Costs Interest payments
- 25. What is FCFF? The Free Cash Flow
- 26. Indirect methods for FCFF FCFF =
- 27. Section II Financial statement analysis
- 28. Standardized Financial Statements Common-Size Balance Sheets: Compute
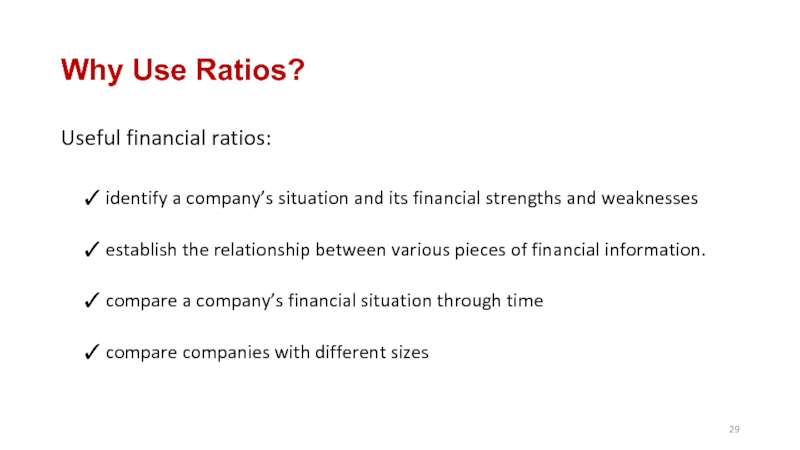
- 29. Why Use Ratios? Useful financial ratios:
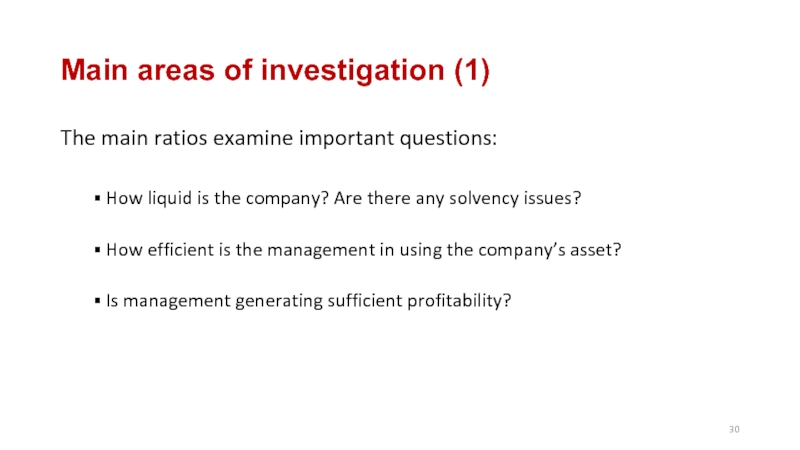
- 30. Main areas of investigation (1) The main
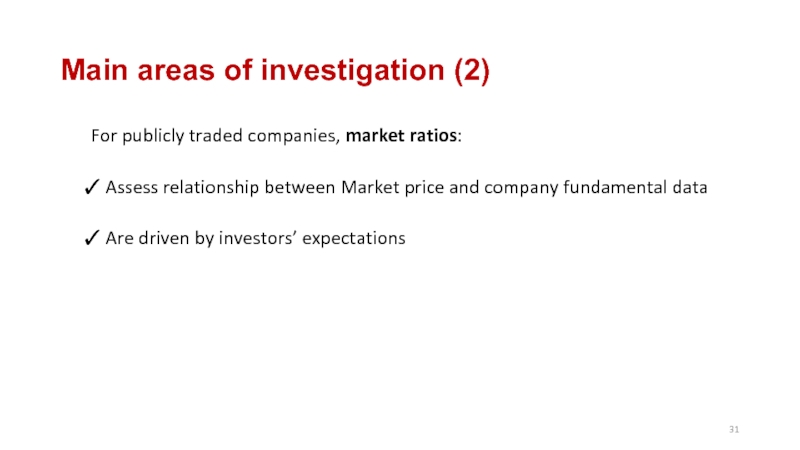
- 31. Main areas of investigation (2) For publicly
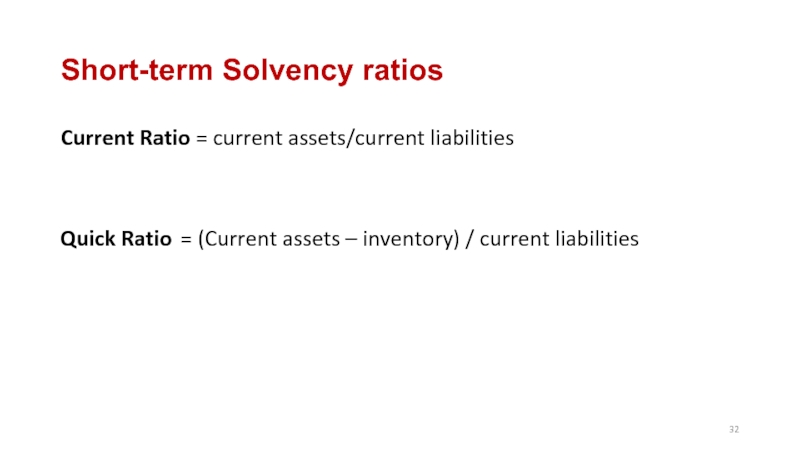
- 32. Short-term Solvency ratios Current Ratio = current
- 33. Long-term solvency measures Debt ratio is the
- 34. Efficiency ratios (1) Inventory Turnover: How many
- 35. Efficiency ratios (2) Account receivables turnover: How
- 36. Efficiency ratios (3) Account payables turnover: How
- 37. Cash Conversion Cycle Sum of the days
- 38. Asset Turnover ratios Total Asset Turnover =
- 39. Operating Profitability measures Operating Profitability measures focus
- 40. Net Profitability measures The focus here is
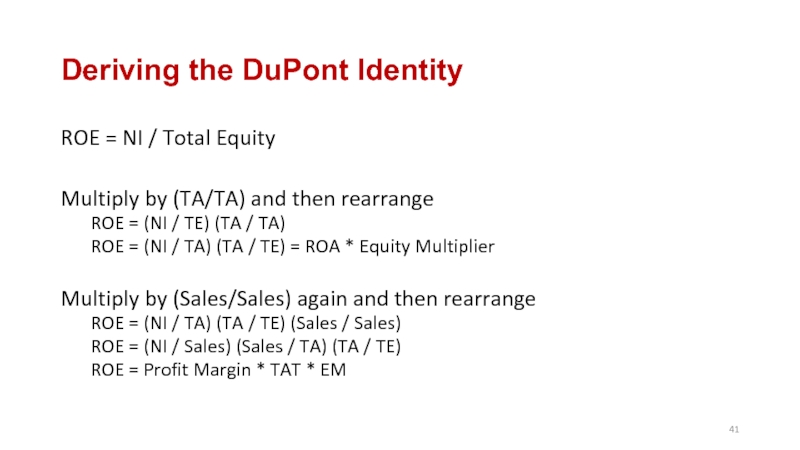
- 41. Deriving the DuPont Identity ROE = NI
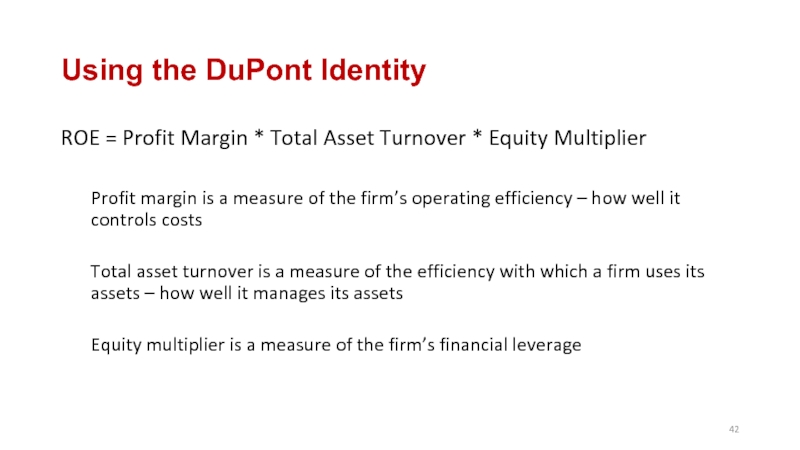
- 42. Using the DuPont Identity ROE = Profit
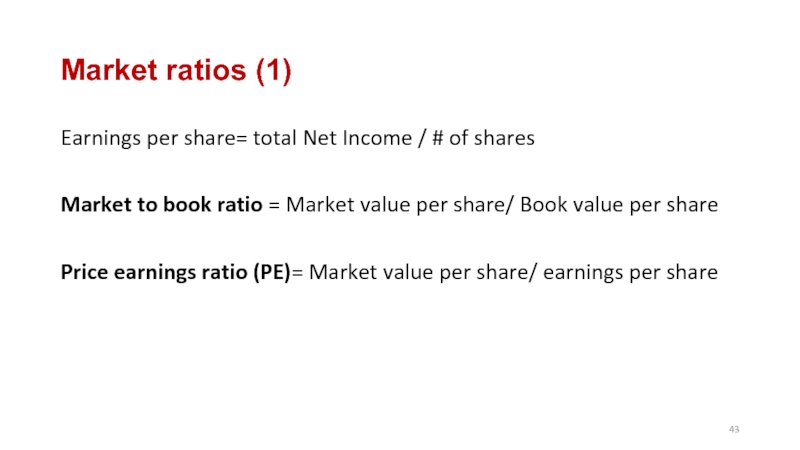
- 43. Market ratios (1) Earnings per share= total
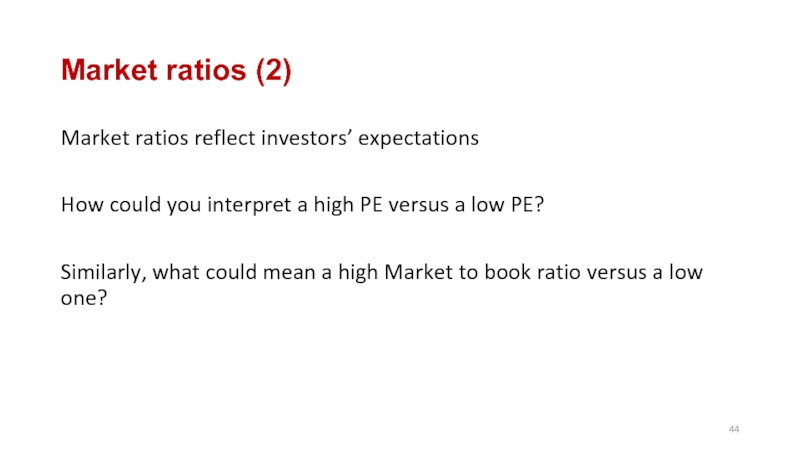
- 44. Market ratios (2) Market ratios reflect investors’
- 45. Remember why we compute ratios A ratio
- 46. Benchmarking (1): Trend analysis Analyzing data through
- 47. Benchmarking (2): Peer group and competitor analysis
- 48. Limitations of Ratio analysis Differences in
- 49. Potential Problems no underlying theory states which
Слайд 2Deck 2
Agenda
Free Cash flows & financing cash flows
Financial statement analysis
Common sized
financial statements
Review of Financial Ratios
Liquidity ratios
Efficiency ratios & profitability ratios
Market ratios
Dupont analysis
limitations of Ratio analysis
Review of Financial Ratios
Liquidity ratios
Efficiency ratios & profitability ratios
Market ratios
Dupont analysis
limitations of Ratio analysis
Слайд 4Let’s dive into Cash Flows
CF versus profit
Firms with recurring negative cash
flows can go bankrupt, even with positive net incomes
Слайд 5
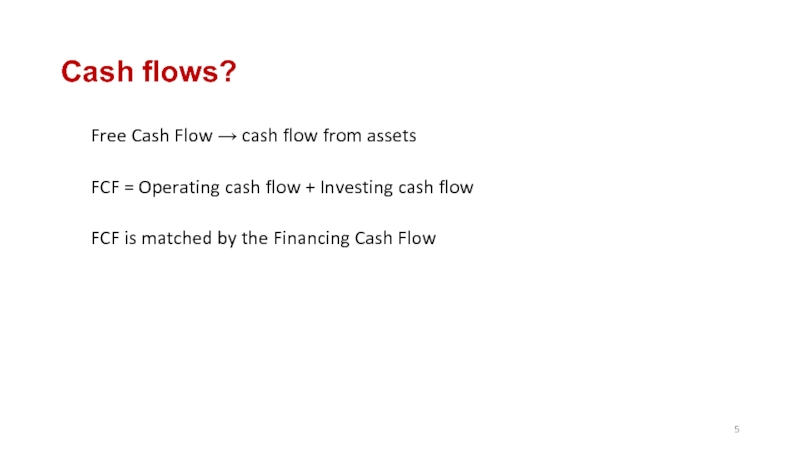
Cash flows?
Free Cash Flow → cash flow from assets
FCF = Operating
cash flow + Investing cash flow
FCF is matched by the Financing Cash Flow
FCF is matched by the Financing Cash Flow
Слайд 6CF statement
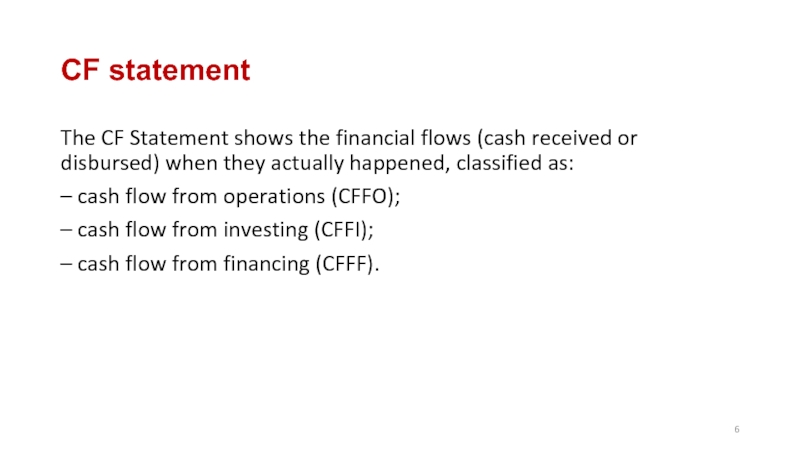
The CF Statement shows the financial flows (cash received or
disbursed) when they actually happened, classified as:
– cash flow from operations (CFFO);
– cash flow from investing (CFFI);
– cash flow from financing (CFFF).
– cash flow from operations (CFFO);
– cash flow from investing (CFFI);
– cash flow from financing (CFFF).
Слайд 7Sections in the Cash Flow Statement
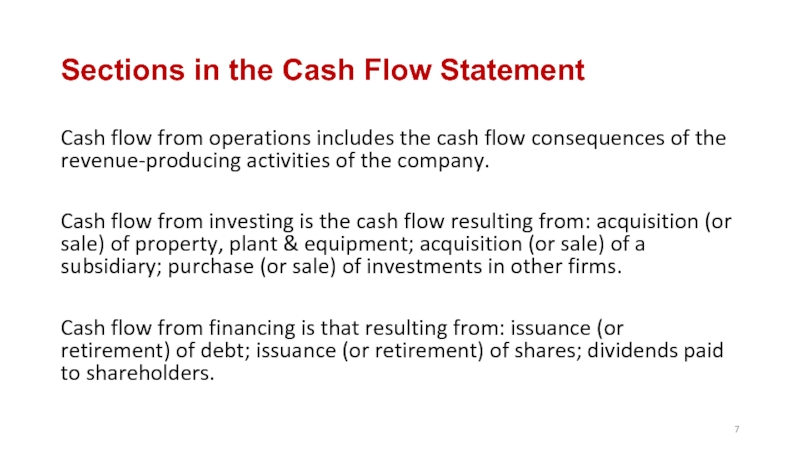
Cash flow from operations includes the
cash flow consequences of the revenue-producing activities of the company.
Cash flow from investing is the cash flow resulting from: acquisition (or sale) of property, plant & equipment; acquisition (or sale) of a subsidiary; purchase (or sale) of investments in other firms.
Cash flow from financing is that resulting from: issuance (or retirement) of debt; issuance (or retirement) of shares; dividends paid to shareholders.
Слайд 8Free Cash Flow
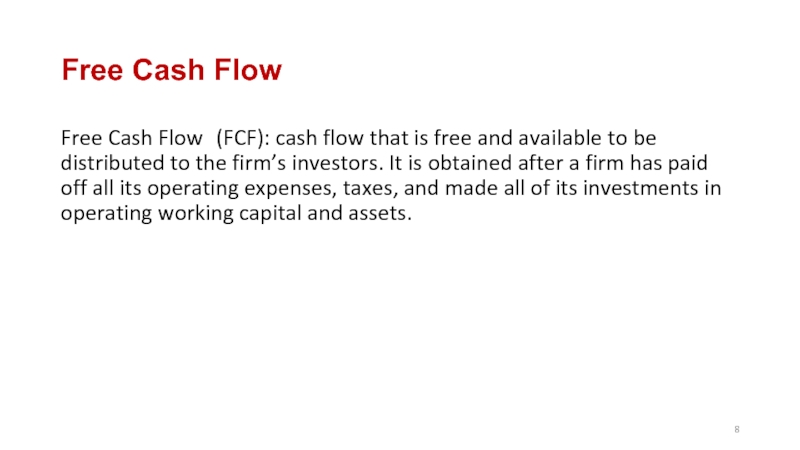
Free Cash Flow (FCF): cash flow that is free
and available to be distributed to the firm’s investors. It is obtained after a firm has paid off all its operating expenses, taxes, and made all of its investments in operating working capital and assets.
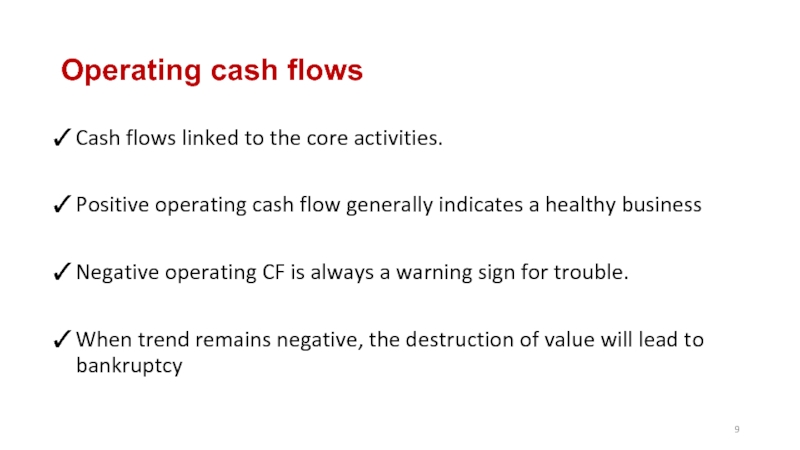
Слайд 9Operating cash flows
Cash flows linked to the core activities.
Positive operating
cash flow generally indicates a healthy business
Negative operating CF is always a warning sign for trouble.
When trend remains negative, the destruction of value will lead to bankruptcy
Negative operating CF is always a warning sign for trouble.
When trend remains negative, the destruction of value will lead to bankruptcy
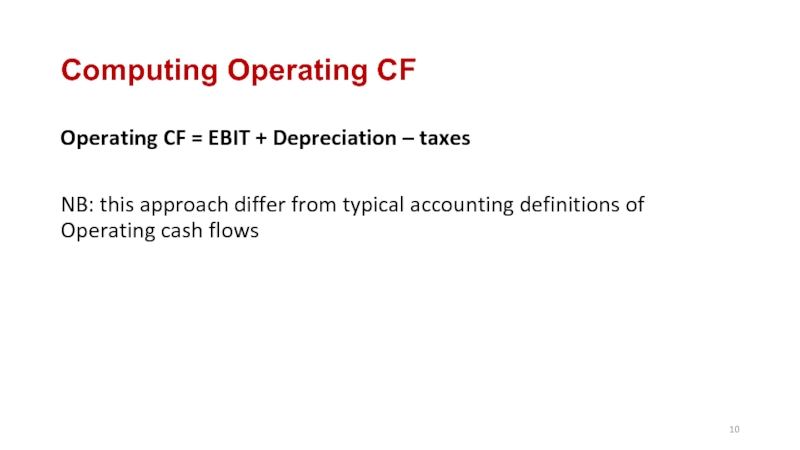
Слайд 10Computing Operating CF
Operating CF = EBIT + Depreciation – taxes
NB: this
approach differ from typical accounting definitions of Operating cash flows
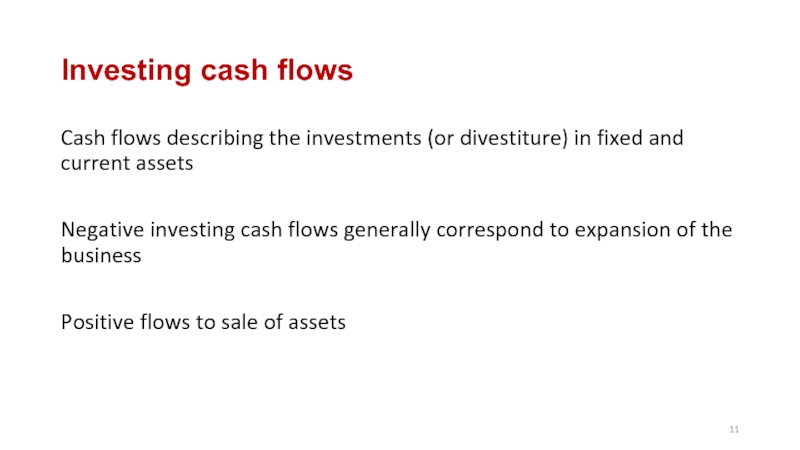
Слайд 11Investing cash flows
Cash flows describing the investments (or divestiture) in fixed
and current assets
Negative investing cash flows generally correspond to expansion of the business
Positive flows to sale of assets
Negative investing cash flows generally correspond to expansion of the business
Positive flows to sale of assets
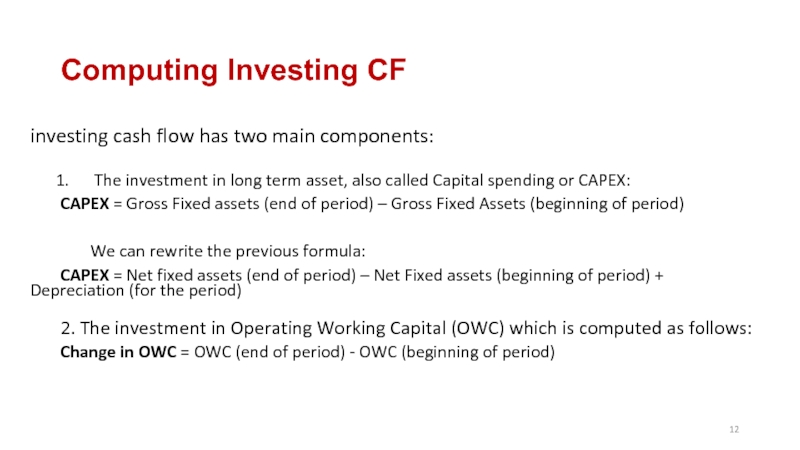
Слайд 12Computing Investing CF
investing cash flow has two main components:
The investment in
long term asset, also called Capital spending or CAPEX:
CAPEX = Gross Fixed assets (end of period) – Gross Fixed Assets (beginning of period)
We can rewrite the previous formula:
CAPEX = Net fixed assets (end of period) – Net Fixed assets (beginning of period) + Depreciation (for the period)
2. The investment in Operating Working Capital (OWC) which is computed as follows:
Change in OWC = OWC (end of period) - OWC (beginning of period)
Слайд 13Financing Cash Flows
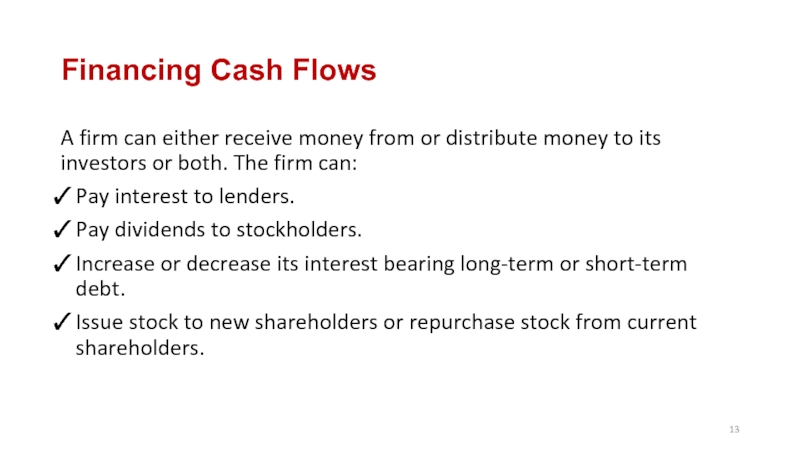
A firm can either receive money from or distribute
money to its investors or both. The firm can:
Pay interest to lenders.
Pay dividends to stockholders.
Increase or decrease its interest bearing long-term or short-term debt.
Issue stock to new shareholders or repurchase stock from current shareholders.
Pay interest to lenders.
Pay dividends to stockholders.
Increase or decrease its interest bearing long-term or short-term debt.
Issue stock to new shareholders or repurchase stock from current shareholders.
Слайд 14Computing the Financing CF
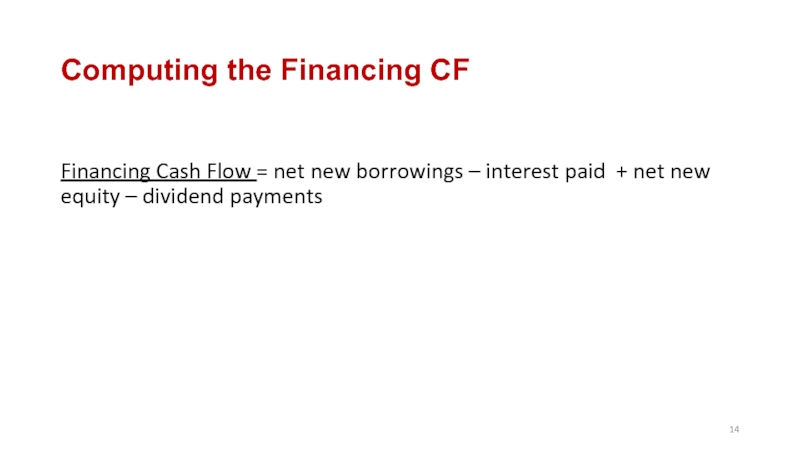
Financing Cash Flow = net new borrowings –
interest paid + net new equity – dividend payments
Слайд 15Cash Flow Statement
Direct vs. Indirect Method
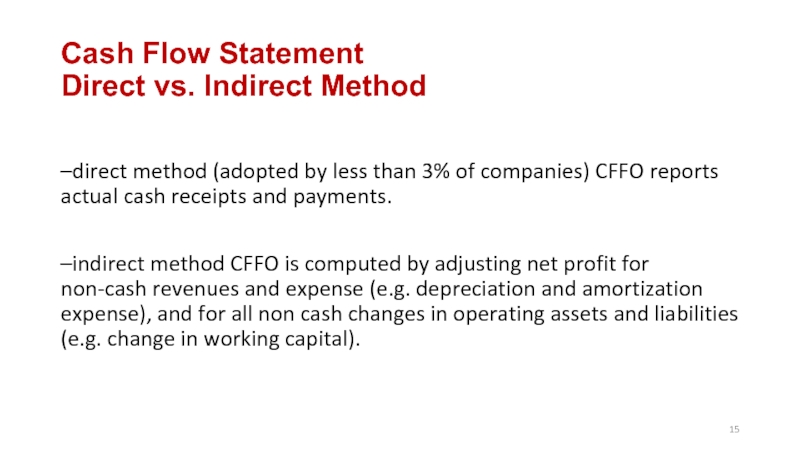
–direct method (adopted by less than
3% of companies) CFFO reports actual cash receipts and payments.
–indirect method CFFO is computed by adjusting net profit for non-cash revenues and expense (e.g. depreciation and amortization expense), and for all non cash changes in operating assets and liabilities (e.g. change in working capital).
–indirect method CFFO is computed by adjusting net profit for non-cash revenues and expense (e.g. depreciation and amortization expense), and for all non cash changes in operating assets and liabilities (e.g. change in working capital).
Слайд 16FCF
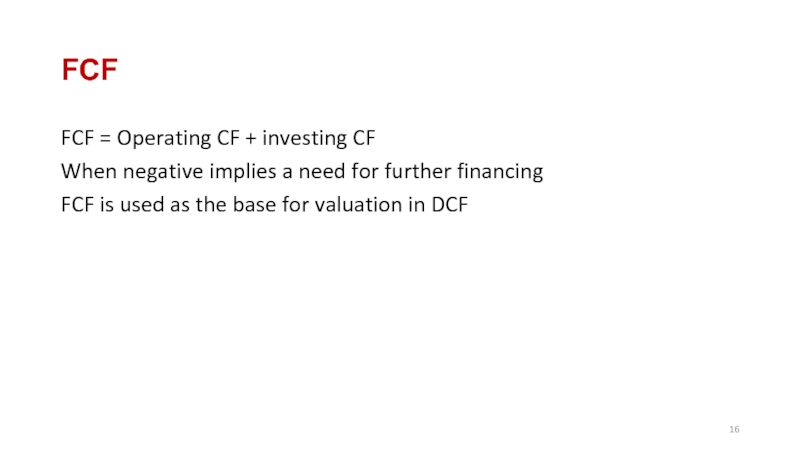
FCF = Operating CF + investing CF
When negative implies a need
for further financing
FCF is used as the base for valuation in DCF
FCF is used as the base for valuation in DCF
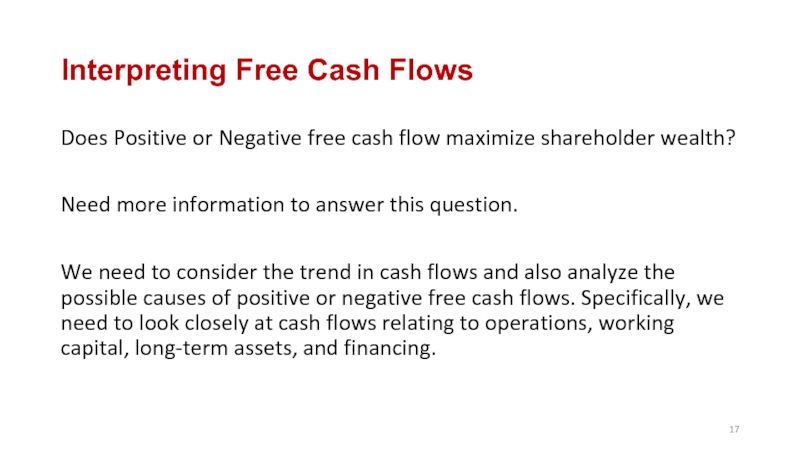
Слайд 17Interpreting Free Cash Flows
Does Positive or Negative free cash flow maximize
shareholder wealth?
Need more information to answer this question.
We need to consider the trend in cash flows and also analyze the possible causes of positive or negative free cash flows. Specifically, we need to look closely at cash flows relating to operations, working capital, long-term assets, and financing.
Need more information to answer this question.
We need to consider the trend in cash flows and also analyze the possible causes of positive or negative free cash flows. Specifically, we need to look closely at cash flows relating to operations, working capital, long-term assets, and financing.
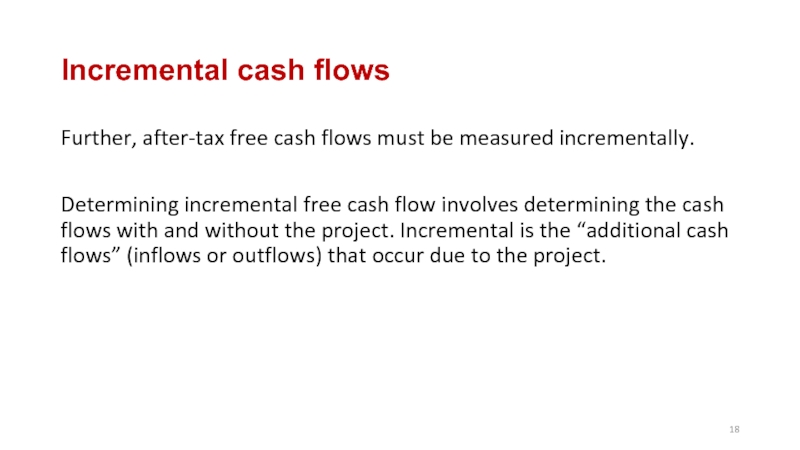
Слайд 18Incremental cash flows
Further, after-tax free cash flows must be measured incrementally.
Determining incremental free cash flow involves determining the cash flows with and without the project. Incremental is the “additional cash flows” (inflows or outflows) that occur due to the project.
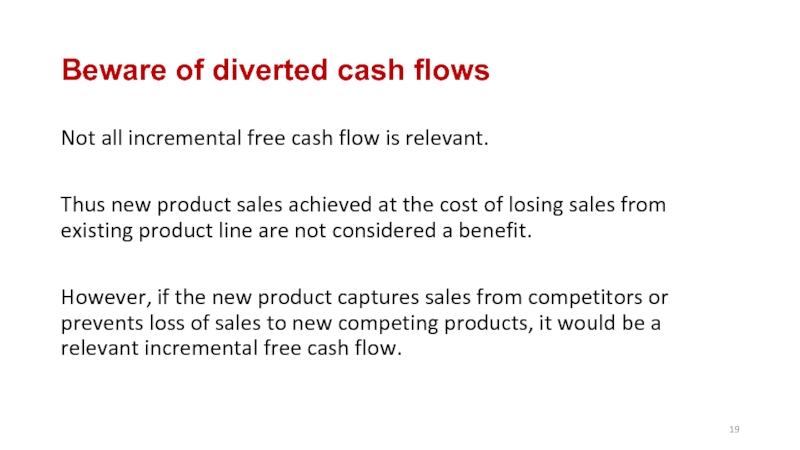
Слайд 19Beware of diverted cash flows
Not all incremental free cash flow is
relevant.
Thus new product sales achieved at the cost of losing sales from existing product line are not considered a benefit.
However, if the new product captures sales from competitors or prevents loss of sales to new competing products, it would be a relevant incremental free cash flow.
Thus new product sales achieved at the cost of losing sales from existing product line are not considered a benefit.
However, if the new product captures sales from competitors or prevents loss of sales to new competing products, it would be a relevant incremental free cash flow.
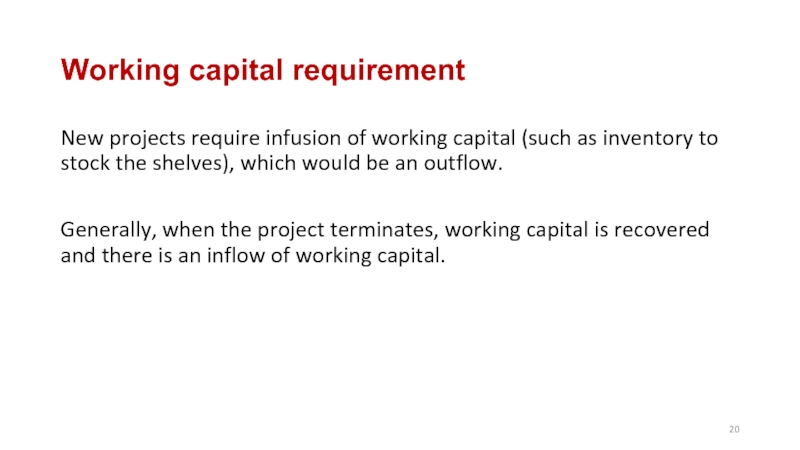
Слайд 20Working capital requirement
New projects require infusion of working capital (such as
inventory to stock the shelves), which would be an outflow.
Generally, when the project terminates, working capital is recovered and there is an inflow of working capital.
Generally, when the project terminates, working capital is recovered and there is an inflow of working capital.
Слайд 21Sunk Costs
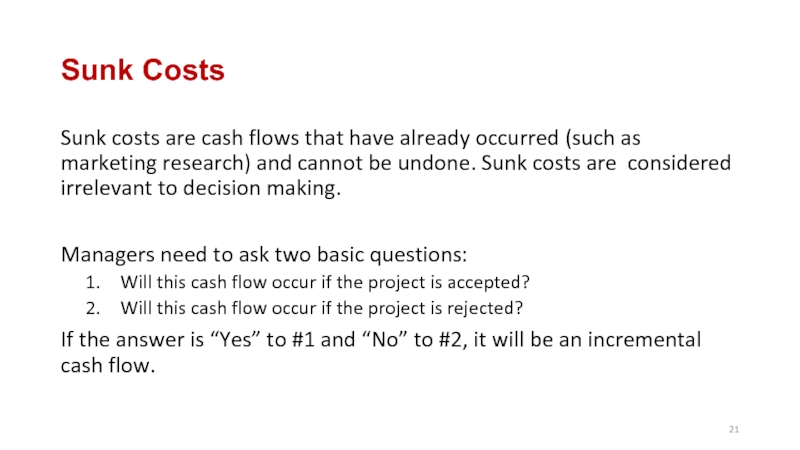
Sunk costs are cash flows that have already occurred (such
as marketing research) and cannot be undone. Sunk costs are considered irrelevant to decision making.
Managers need to ask two basic questions:
Will this cash flow occur if the project is accepted?
Will this cash flow occur if the project is rejected?
If the answer is “Yes” to #1 and “No” to #2, it will be an incremental cash flow.
Managers need to ask two basic questions:
Will this cash flow occur if the project is accepted?
Will this cash flow occur if the project is rejected?
If the answer is “Yes” to #1 and “No” to #2, it will be an incremental cash flow.
Слайд 22Opportunity Costs
Opportunity cost refers to cash flows that are lost because
of accepting the current project.
For example, using the building space for the project will mean loss of potential rental revenue.
For example, using the building space for the project will mean loss of potential rental revenue.
Слайд 23Overhead Costs
Incremental overhead costs or costs that were incurred as a
result of the project and relevant to capital budgeting must be included.
Note, not all overhead costs may be relevant (for example, the utilities bill may have been the same with or without the project).
Note, not all overhead costs may be relevant (for example, the utilities bill may have been the same with or without the project).
Слайд 24Interest Payments and Financing Costs
Interest payments and other financing cash flows
that might result from raising funds to finance a project are not relevant cash flows.
Reason: Required rate of return implicitly accounts for the cost of raising funds to finance a new project.
Reason: Required rate of return implicitly accounts for the cost of raising funds to finance a new project.
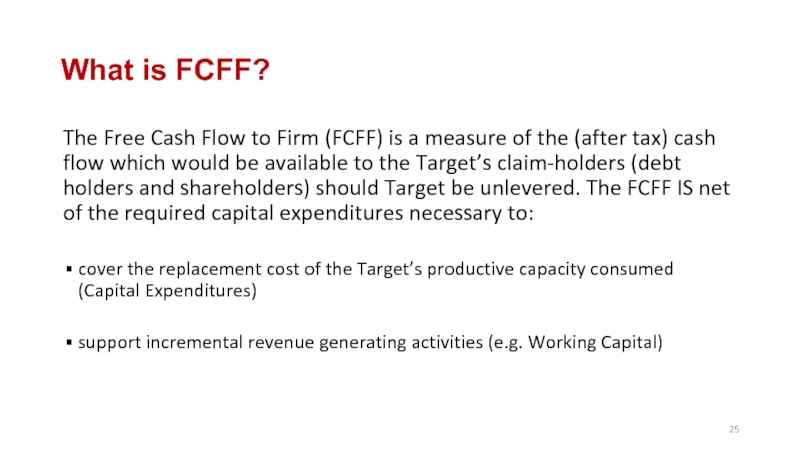
Слайд 25What is FCFF?
The Free Cash Flow to Firm (FCFF) is a
measure of the (after tax) cash flow which would be available to the Target’s claim-holders (debt holders and shareholders) should Target be unlevered. The FCFF IS net of the required capital expenditures necessary to:
cover the replacement cost of the Target’s productive capacity consumed (Capital Expenditures)
support incremental revenue generating activities (e.g. Working Capital)
cover the replacement cost of the Target’s productive capacity consumed (Capital Expenditures)
support incremental revenue generating activities (e.g. Working Capital)
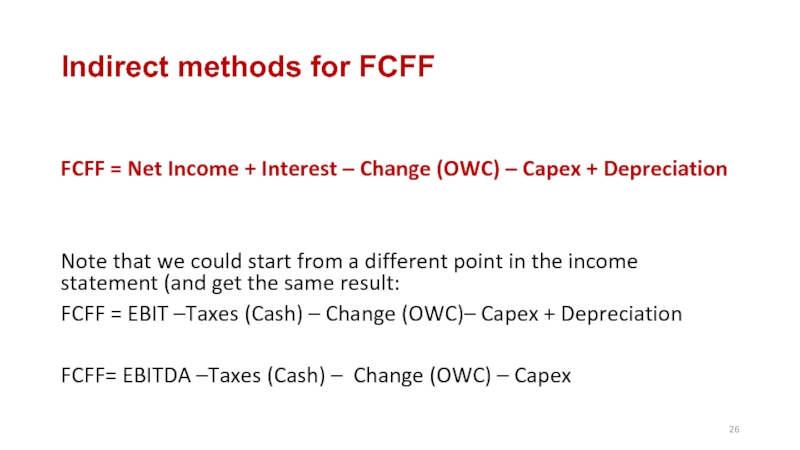
Слайд 26Indirect methods for FCFF
FCFF = Net Income + Interest – Change
(OWC) – Capex + Depreciation
Note that we could start from a different point in the income statement (and get the same result:
FCFF = EBIT –Taxes (Cash) – Change (OWC)– Capex + Depreciation
FCFF= EBITDA –Taxes (Cash) – Change (OWC) – Capex
Note that we could start from a different point in the income statement (and get the same result:
FCFF = EBIT –Taxes (Cash) – Change (OWC)– Capex + Depreciation
FCFF= EBITDA –Taxes (Cash) – Change (OWC) – Capex
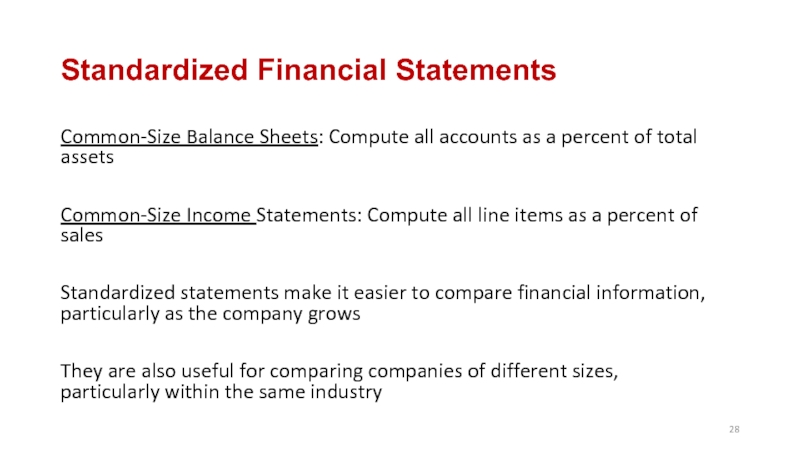
Слайд 28Standardized Financial Statements
Common-Size Balance Sheets: Compute all accounts as a percent
of total assets
Common-Size Income Statements: Compute all line items as a percent of sales
Standardized statements make it easier to compare financial information, particularly as the company grows
They are also useful for comparing companies of different sizes, particularly within the same industry
Common-Size Income Statements: Compute all line items as a percent of sales
Standardized statements make it easier to compare financial information, particularly as the company grows
They are also useful for comparing companies of different sizes, particularly within the same industry
Слайд 29Why Use Ratios?
Useful financial ratios:
identify a company’s situation and its financial
strengths and weaknesses
establish the relationship between various pieces of financial information.
compare a company’s financial situation through time
compare companies with different sizes
establish the relationship between various pieces of financial information.
compare a company’s financial situation through time
compare companies with different sizes
Слайд 30Main areas of investigation (1)
The main ratios examine important questions:
How liquid
is the company? Are there any solvency issues?
How efficient is the management in using the company’s asset?
Is management generating sufficient profitability?
How efficient is the management in using the company’s asset?
Is management generating sufficient profitability?
Слайд 31Main areas of investigation (2)
For publicly traded companies, market ratios:
Assess relationship
between Market price and company fundamental data
Are driven by investors’ expectations
Are driven by investors’ expectations
Слайд 32Short-term Solvency ratios
Current Ratio = current assets/current liabilities
Quick Ratio = (Current assets
– inventory) / current liabilities
Слайд 33Long-term solvency measures
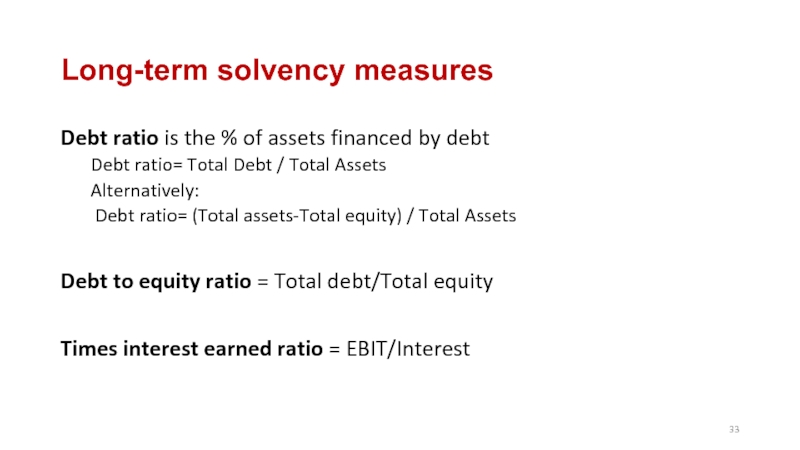
Debt ratio is the % of assets financed by
debt
Debt ratio= Total Debt / Total Assets
Alternatively:
Debt ratio= (Total assets-Total equity) / Total Assets
Debt to equity ratio = Total debt/Total equity
Times interest earned ratio = EBIT/Interest
Debt ratio= Total Debt / Total Assets
Alternatively:
Debt ratio= (Total assets-Total equity) / Total Assets
Debt to equity ratio = Total debt/Total equity
Times interest earned ratio = EBIT/Interest
Слайд 34Efficiency ratios (1)
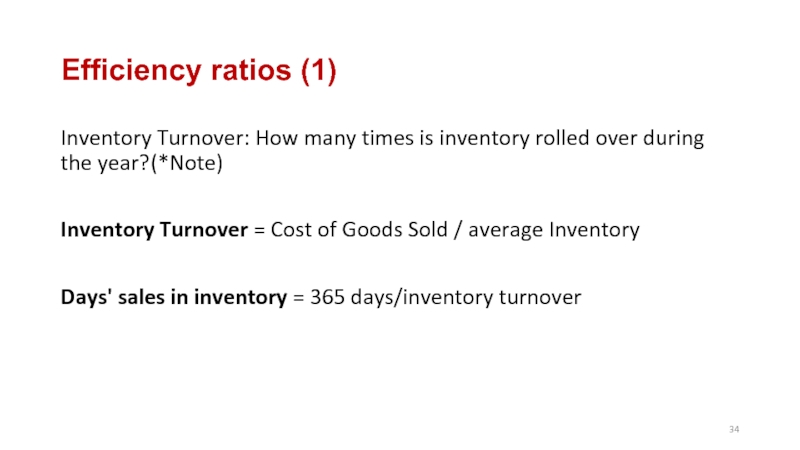
Inventory Turnover: How many times is inventory rolled over
during the year? (*Note)
Inventory Turnover = Cost of Goods Sold / average Inventory
Days' sales in inventory = 365 days/inventory turnover
Inventory Turnover = Cost of Goods Sold / average Inventory
Days' sales in inventory = 365 days/inventory turnover
Слайд 35Efficiency ratios (2)
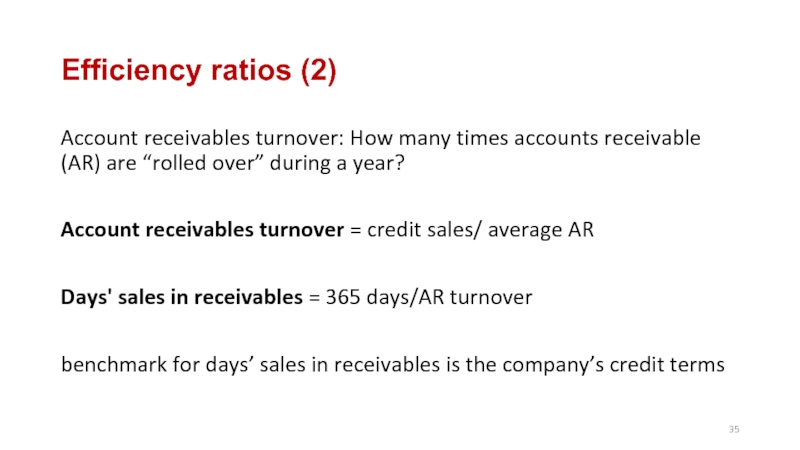
Account receivables turnover: How many times accounts receivable (AR)
are “rolled over” during a year?
Account receivables turnover = credit sales/ average AR
Days' sales in receivables = 365 days/AR turnover
benchmark for days’ sales in receivables is the company’s credit terms
Account receivables turnover = credit sales/ average AR
Days' sales in receivables = 365 days/AR turnover
benchmark for days’ sales in receivables is the company’s credit terms
Слайд 36Efficiency ratios (3)
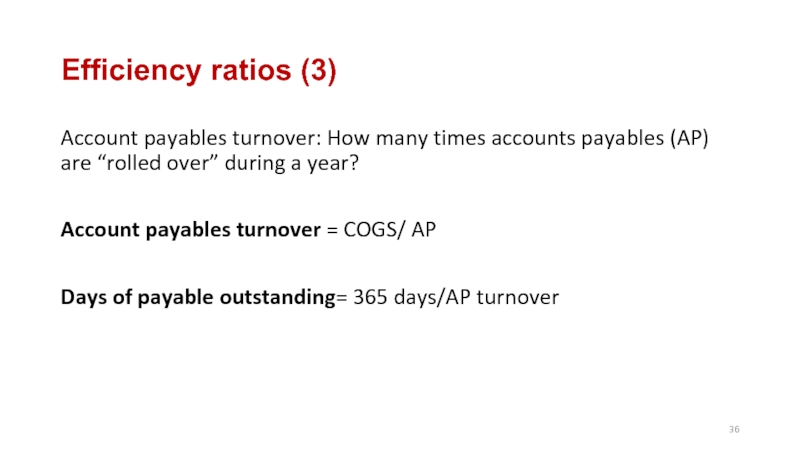
Account payables turnover: How many times accounts payables (AP)
are “rolled over” during a year?
Account payables turnover = COGS/ AP
Days of payable outstanding= 365 days/AP turnover
Account payables turnover = COGS/ AP
Days of payable outstanding= 365 days/AP turnover
Слайд 37Cash Conversion Cycle
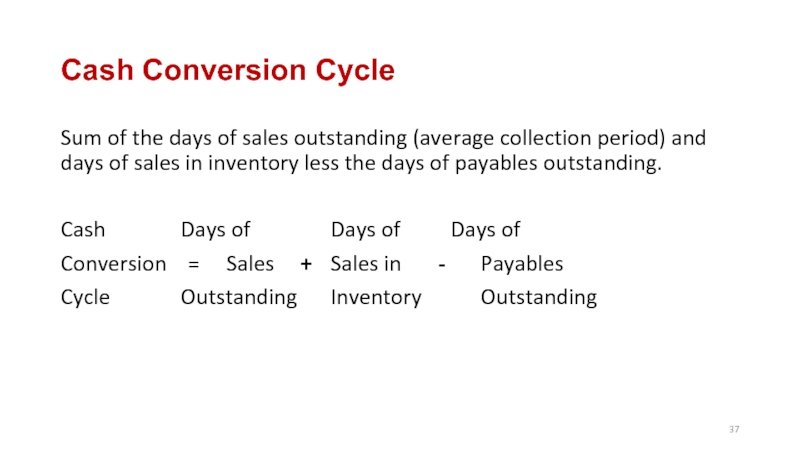
Sum of the days of sales outstanding (average collection
period) and days of sales in inventory less the days of payables outstanding.
Cash Days of Days of Days of
Conversion = Sales + Sales in - Payables
Cycle Outstanding Inventory Outstanding
Cash Days of Days of Days of
Conversion = Sales + Sales in - Payables
Cycle Outstanding Inventory Outstanding
Слайд 38Asset Turnover ratios
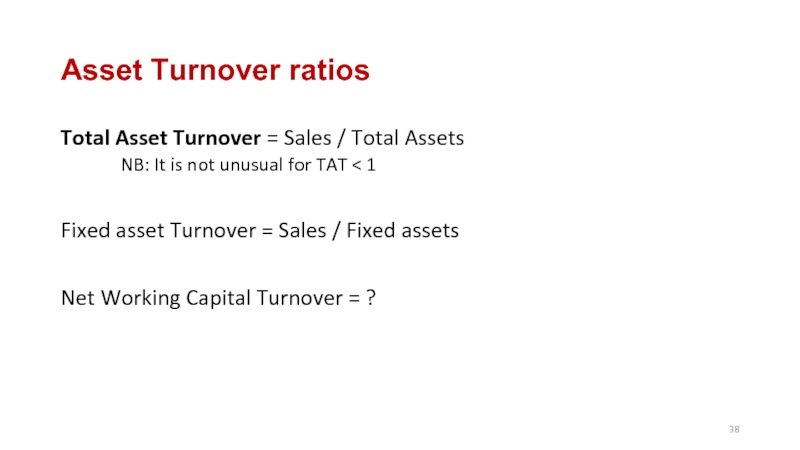
Total Asset Turnover = Sales / Total Assets
NB: It
is not unusual for TAT < 1
Fixed asset Turnover = Sales / Fixed assets
Net Working Capital Turnover = ?
Fixed asset Turnover = Sales / Fixed assets
Net Working Capital Turnover = ?
Слайд 39Operating Profitability measures
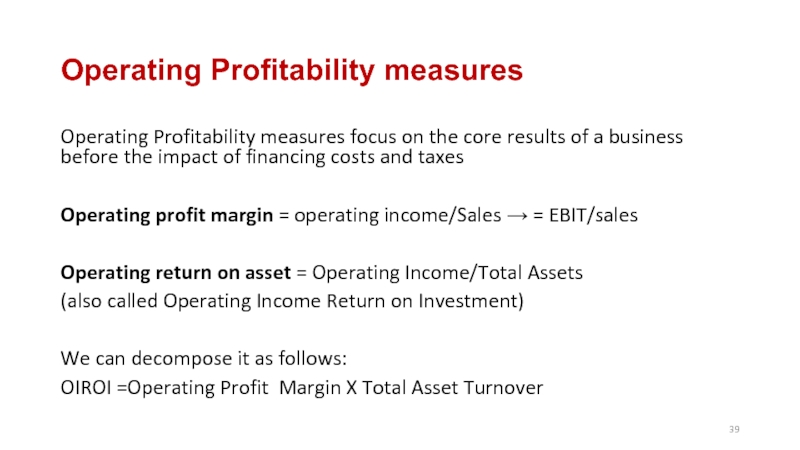
Operating Profitability measures focus on the core results of
a business before the impact of financing costs and taxes
Operating profit margin = operating income/Sales → = EBIT/sales
Operating return on asset = Operating Income/Total Assets
(also called Operating Income Return on Investment)
We can decompose it as follows:
OIROI =Operating Profit Margin X Total Asset Turnover
Operating profit margin = operating income/Sales → = EBIT/sales
Operating return on asset = Operating Income/Total Assets
(also called Operating Income Return on Investment)
We can decompose it as follows:
OIROI =Operating Profit Margin X Total Asset Turnover
Слайд 40Net Profitability measures
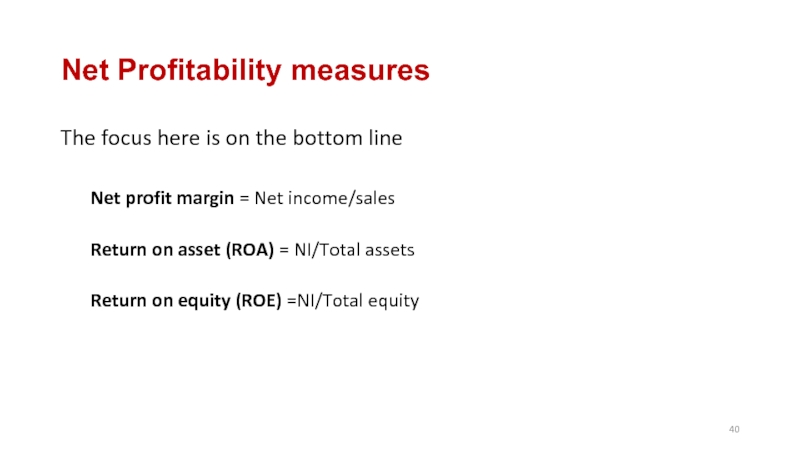
The focus here is on the bottom line
Net profit
margin = Net income/sales
Return on asset (ROA) = NI/Total assets
Return on equity (ROE) =NI/Total equity
Return on asset (ROA) = NI/Total assets
Return on equity (ROE) =NI/Total equity
Слайд 41Deriving the DuPont Identity
ROE = NI / Total Equity
Multiply by (TA/TA)
and then rearrange
ROE = (NI / TE) (TA / TA)
ROE = (NI / TA) (TA / TE) = ROA * Equity Multiplier
Multiply by (Sales/Sales) again and then rearrange
ROE = (NI / TA) (TA / TE) (Sales / Sales)
ROE = (NI / Sales) (Sales / TA) (TA / TE)
ROE = Profit Margin * TAT * EM
ROE = (NI / TE) (TA / TA)
ROE = (NI / TA) (TA / TE) = ROA * Equity Multiplier
Multiply by (Sales/Sales) again and then rearrange
ROE = (NI / TA) (TA / TE) (Sales / Sales)
ROE = (NI / Sales) (Sales / TA) (TA / TE)
ROE = Profit Margin * TAT * EM
Слайд 42Using the DuPont Identity
ROE = Profit Margin * Total Asset Turnover
* Equity Multiplier
Profit margin is a measure of the firm’s operating efficiency – how well it controls costs
Total asset turnover is a measure of the efficiency with which a firm uses its assets – how well it manages its assets
Equity multiplier is a measure of the firm’s financial leverage
Profit margin is a measure of the firm’s operating efficiency – how well it controls costs
Total asset turnover is a measure of the efficiency with which a firm uses its assets – how well it manages its assets
Equity multiplier is a measure of the firm’s financial leverage
Слайд 43Market ratios (1)
Earnings per share= total Net Income / # of
shares
Market to book ratio = Market value per share/ Book value per share
Price earnings ratio (PE)= Market value per share/ earnings per share
Market to book ratio = Market value per share/ Book value per share
Price earnings ratio (PE)= Market value per share/ earnings per share
Слайд 44Market ratios (2)
Market ratios reflect investors’ expectations
How could you interpret a
high PE versus a low PE?
Similarly, what could mean a high Market to book ratio versus a low one?
Similarly, what could mean a high Market to book ratio versus a low one?
Слайд 45Remember why we compute ratios
A ratio needs to tell you something
about the company you analyze.
Ratio analysis will allow you to:
connect various components of a business and high light its strengths and weaknesses
Catch the trends (in other words evolution through time) of those components
Compare a company with its competitors and more broadly to its industry
Ratio analysis will allow you to:
connect various components of a business and high light its strengths and weaknesses
Catch the trends (in other words evolution through time) of those components
Compare a company with its competitors and more broadly to its industry
Слайд 46Benchmarking (1): Trend analysis
Analyzing data through time:
Quarterly evolutions: spots seasonality and
or extraordinary events
Annual comparisons allows an analysis of bigger trends and often underline the impact of macro economic cycles
Annual comparisons allows an analysis of bigger trends and often underline the impact of macro economic cycles
Слайд 47Benchmarking (2): Peer group and competitor analysis
Makes sense both from a
managerial and an investment point of view
Highlight the specific competitive advantages of the company as well as its differences in capital structure
leads a “normative” view on the company performance
Highlight differences between industries
Highlight the specific competitive advantages of the company as well as its differences in capital structure
leads a “normative” view on the company performance
Highlight differences between industries
Слайд 48Limitations of Ratio analysis
Differences in accounting practices
Subjectivity in the interpretation
of ratios
Seasonal biases
Difficulty in identifying proper comparable peers.
Published peer group or industry averages are only approximations and subject to distortion.
Industry averages are not always desirable targets or norms→ e.g. industry downfall or market wide overvaluation.
Seasonal biases
Difficulty in identifying proper comparable peers.
Published peer group or industry averages are only approximations and subject to distortion.
Industry averages are not always desirable targets or norms→ e.g. industry downfall or market wide overvaluation.
Слайд 49Potential Problems
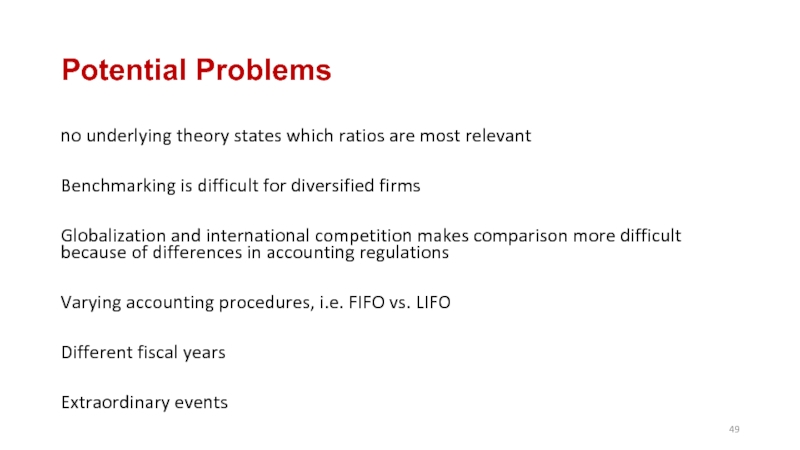
no underlying theory states which ratios are most relevant
Benchmarking is
difficult for diversified firms
Globalization and international competition makes comparison more difficult because of differences in accounting regulations
Varying accounting procedures, i.e. FIFO vs. LIFO
Different fiscal years
Extraordinary events
Globalization and international competition makes comparison more difficult because of differences in accounting regulations
Varying accounting procedures, i.e. FIFO vs. LIFO
Different fiscal years
Extraordinary events
