Where are We on The Demand Driven Journey?
- Главная
- Разное
- Дизайн
- Бизнес и предпринимательство
- Аналитика
- Образование
- Развлечения
- Красота и здоровье
- Финансы
- Государство
- Путешествия
- Спорт
- Недвижимость
- Армия
- Графика
- Культурология
- Еда и кулинария
- Лингвистика
- Английский язык
- Астрономия
- Алгебра
- Биология
- География
- Детские презентации
- Информатика
- История
- Литература
- Маркетинг
- Математика
- Медицина
- Менеджмент
- Музыка
- МХК
- Немецкий язык
- ОБЖ
- Обществознание
- Окружающий мир
- Педагогика
- Русский язык
- Технология
- Физика
- Философия
- Химия
- Шаблоны, картинки для презентаций
- Экология
- Экономика
- Юриспруденция
Where are We on The Demand Driven Journey? презентация
Содержание
- 1. Where are We on The Demand Driven Journey?
- 2. Lora Cecere - Founder of Supply Chain
- 3. “Qualifications to Incite the Riot” P&G Demand Driven Architect Accenture/Gartner Recognized “Outside In” Expert
- 4. Ground Rules “How did we get
- 5. Story of the $1Billion Dollar Brand
- 6. Business Driver Translation Leaving Revenue/Margin on
- 7. TM P&G
- 8. Vision Make
- 9. Supply Network Daily Demand
- 10. Roadmap to Progress
- 11. Consumer-driven Supply Networks: Defined by P&G in
- 13. Definition Does not mean Make to order
- 14. Demand Driven MRP? Material Requirements Planning (MRP)
- 15. Crawl/Walk/Run It’s a Continuous Journey Reliable/Predictable Supply
- 16. Real Time Operations Seamless E2E Synchronization Synchronize
- 18. “End State” Business Sufficiency Supply chain –
- 19. Panelist’s Perspective Initial Thoughts on: Level
- 21. Make the Supply Chain
- 22. Demand Driven Success? Creation of Roadmap –
- 23. So …. Is Demand Driven Still Alive?
- 25. Supplemental Slides
- 26. Traditional Process Design is “Blind” Barrier to Progress Enterprise Wide Planning/Optimization Process Design
- 27. Most MISS the POINT
- 28. Sense Evaluate Decide Act Business Outcomes
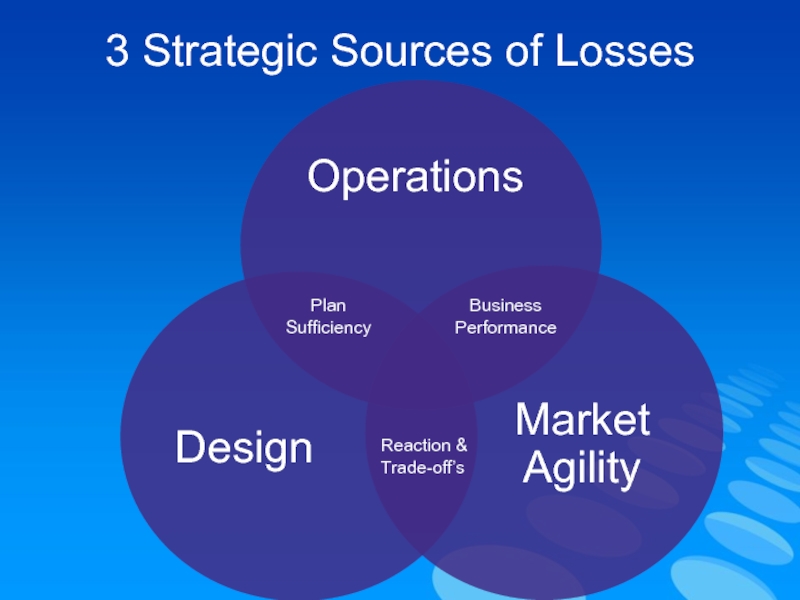
- 29. 3 Strategic Sources of Losses Market
Слайд 1Jake Barr - CEO
BlueWorld Supply Chain Consulting
Retired – Global Director –
Слайд 2Lora Cecere - Founder of Supply Chain Insights
Carol Ptak –
Founder
Referee/Judge
Welcome to…..
Слайд 3“Qualifications to Incite the Riot”
P&G Demand Driven Architect
Accenture/Gartner Recognized “Outside In”
Слайд 4Ground Rules
“How did we get here”
Perspective on Barriers to
Panelist View of our Current State
Your Take on the State of Affairs
Closing thoughts
The Great Debate - September 2015
Слайд 5Story of the $1Billion Dollar Brand
How to Deliver Game Changing
at the Two Moments of Truth
How Did We Get Here?
Deliver superior consumer value cheaper/better/faster
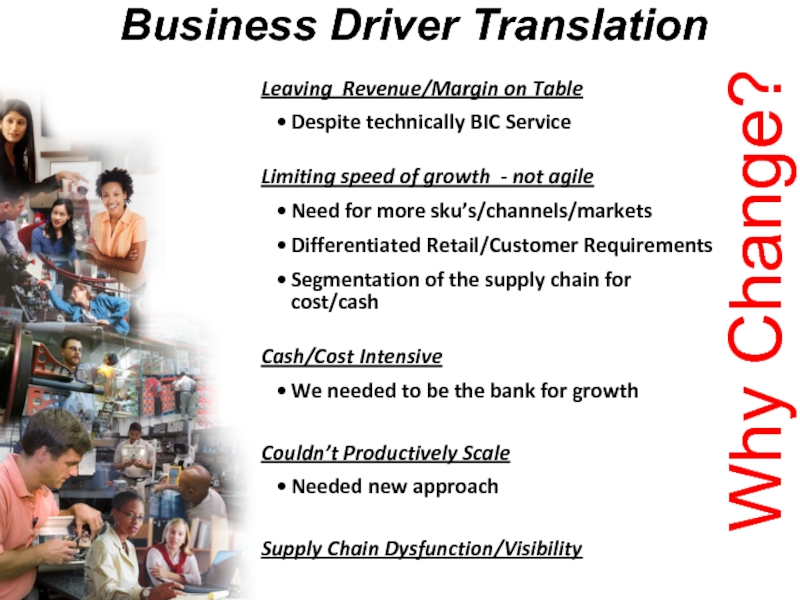
Слайд 6Business Driver Translation
Leaving Revenue/Margin on Table
Despite technically BIC Service
Limiting speed
Need for more sku’s/channels/markets
Differentiated Retail/Customer Requirements
Segmentation of the supply chain for cost/cash
Cash/Cost Intensive
We needed to be the bank for growth
Couldn’t Productively Scale
Needed new approach
Supply Chain Dysfunction/Visibility
Why Change?
Слайд 8
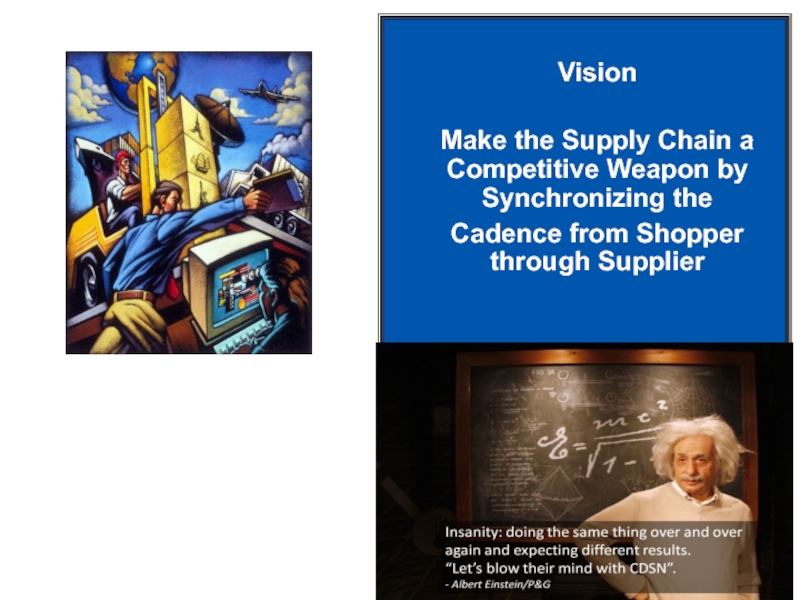
Vision
Make the Supply Chain a Competitive Weapon by Synchronizing
Cadence from Shopper through Supplier
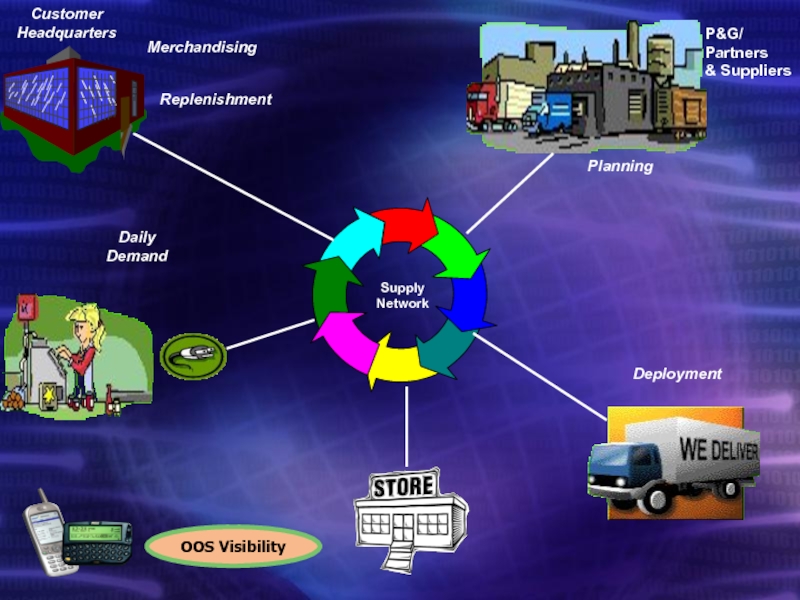
Слайд 9Supply
Network
Daily Demand
Replenishment
Customer Headquarters
Planning
P&G/
Partners
& Suppliers
Deployment
OOS Visibility
Merchandising
Слайд 10Roadmap to Progress
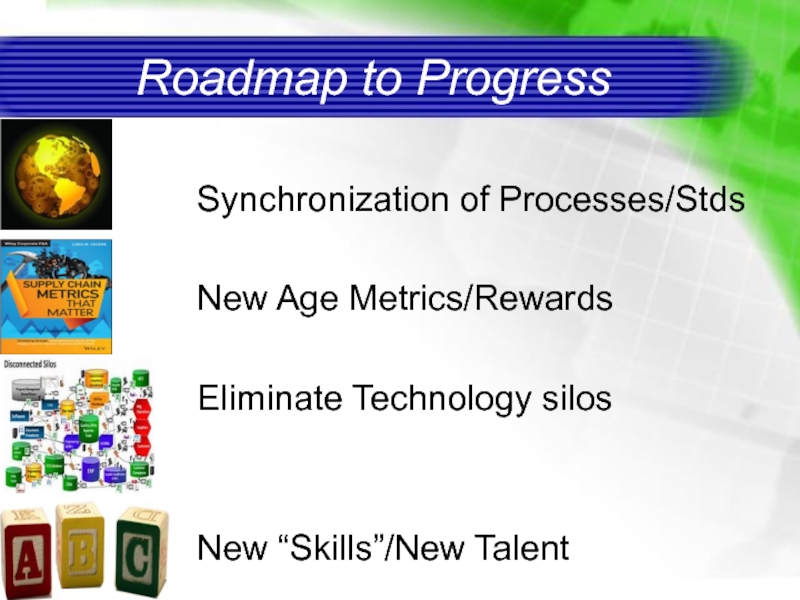
Synchronization
New Age Metrics/Rewards
Eliminate Technology silos
New “Skills”/New Talent
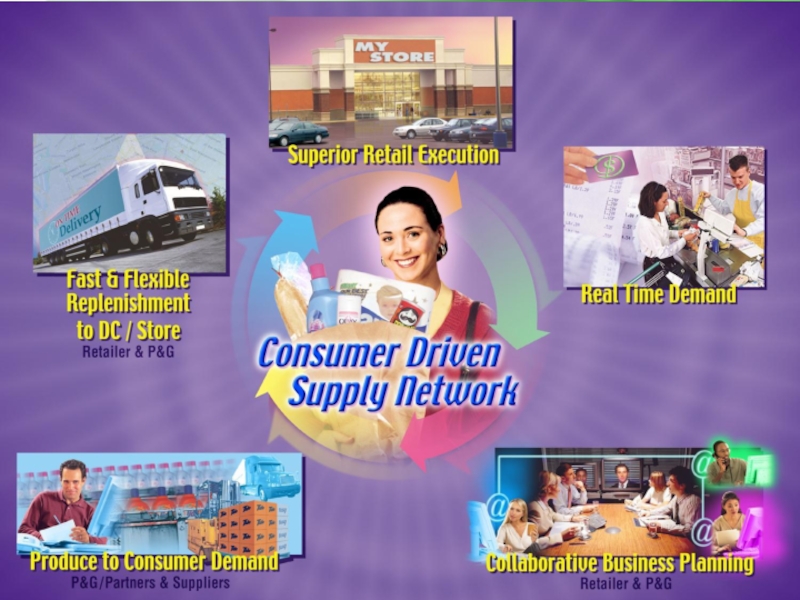
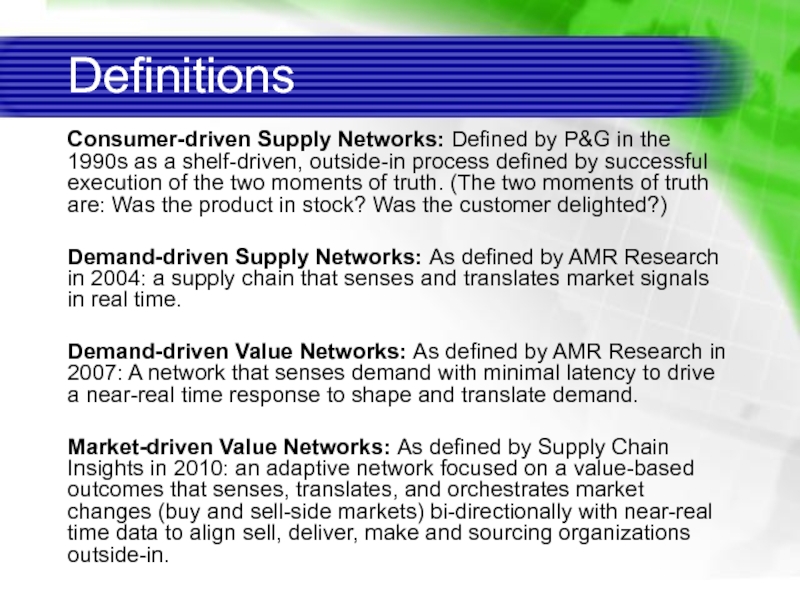
Слайд 11Consumer-driven Supply Networks: Defined by P&G in the 1990s as a
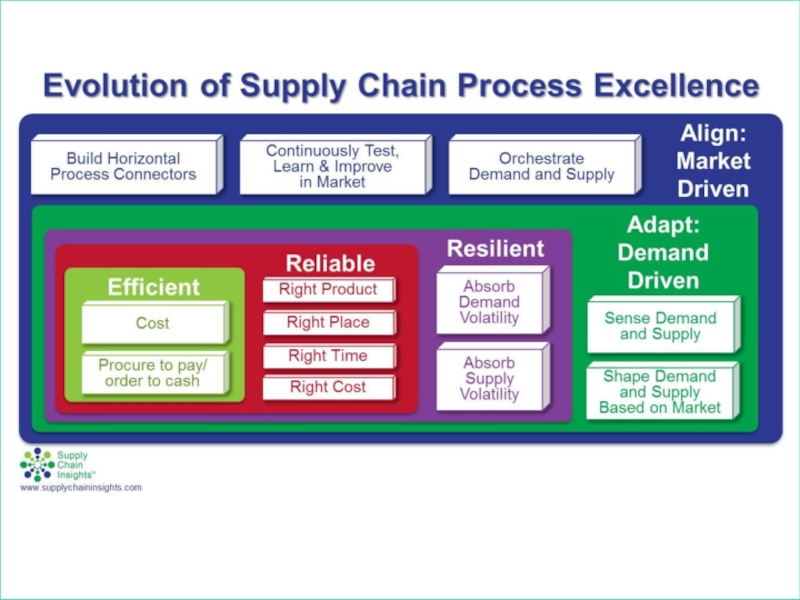
Demand-driven Supply Networks: As defined by AMR Research in 2004: a supply chain that senses and translates market signals in real time.
Demand-driven Value Networks: As defined by AMR Research in 2007: A network that senses demand with minimal latency to drive a near-real time response to shape and translate demand.
Market-driven Value Networks: As defined by Supply Chain Insights in 2010: an adaptive network focused on a value-based outcomes that senses, translates, and orchestrates market changes (buy and sell-side markets) bi-directionally with near-real time data to align sell, deliver, make and sourcing organizations outside-in.
Definitions
Слайд 13Definition
Does not mean
Make to order everything
Simple pull
Inventory everywhere
Does mean
Sensing changing customer
All material and content © copyright 2015 Demand Driven Institute. All rights reserved.
Certified Demand Driven Planner (CDDP) is a trademark of the ISCEA
Слайд 14Demand Driven MRP?
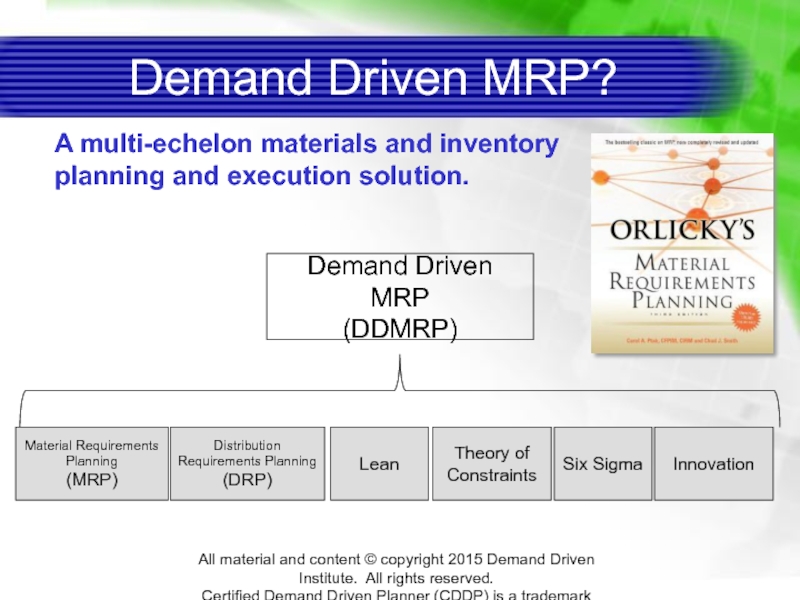
Material Requirements Planning
(MRP)
Distribution Requirements Planning
(DRP)
Lean
Theory of Constraints
Innovation
A multi-echelon materials
Six Sigma
All material and content © copyright 2015 Demand Driven Institute. All rights reserved.
Certified Demand Driven Planner (CDDP) is a trademark of the ISCEA
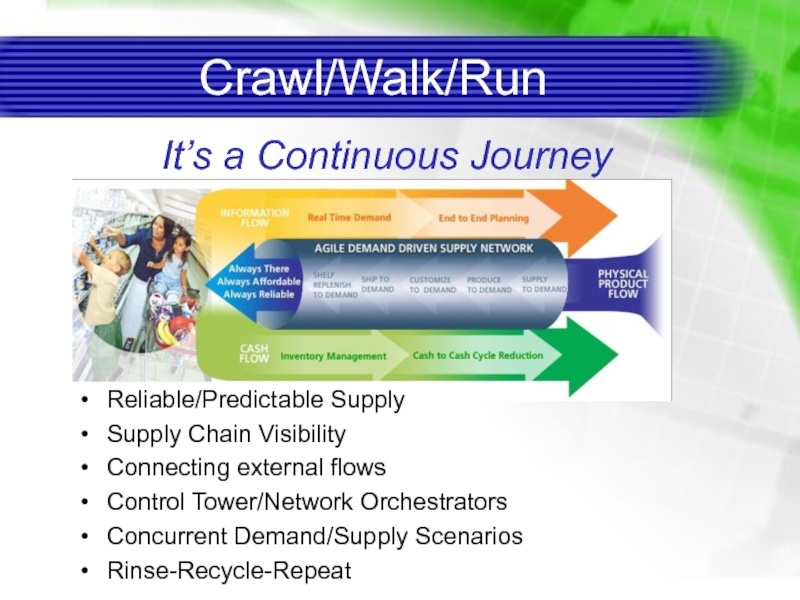
Слайд 15Crawl/Walk/Run
It’s a Continuous Journey
Reliable/Predictable Supply
Supply Chain Visibility
Connecting external flows
Control Tower/Network Orchestrators
Concurrent
Rinse-Recycle-Repeat
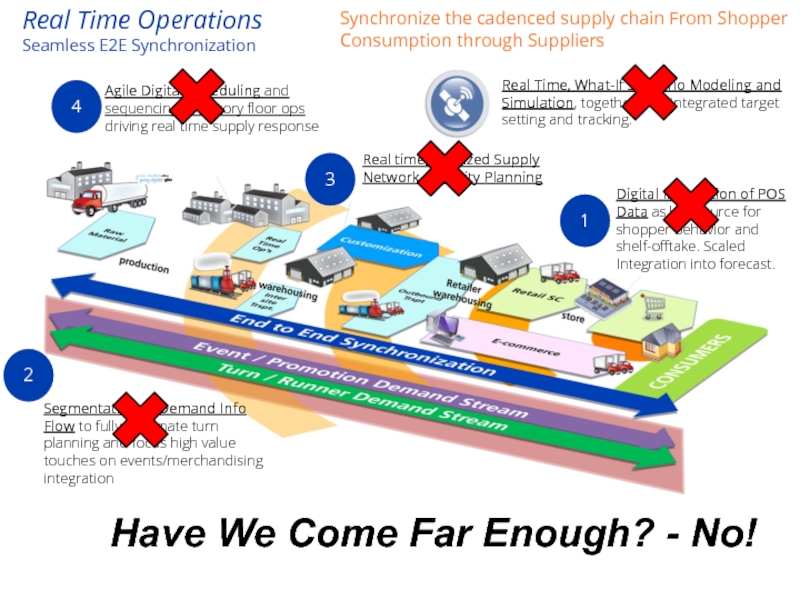
Слайд 16Real Time Operations
Seamless E2E Synchronization
Synchronize the cadenced supply chain From Shopper
Digital Integration of POS Data as key source for shopper behavior and shelf-offtake. Scaled Integration into forecast.
Real time, Digitized Supply Network Capacity Planning
Agile Digital Scheduling and sequencing of factory floor ops driving real time supply response
Segmentation of Demand Info Flow to fully automate turn planning and focus high value touches on events/merchandising integration
Real Time, What-If Scenario Modeling and Simulation, together with integrated target setting and tracking.
1
2
3
4
Have We Come Far Enough? - No!
Слайд 17
Sum it Up:
Why Haven’t We
Three GAPS:
Process
Technology
Organization
Culture
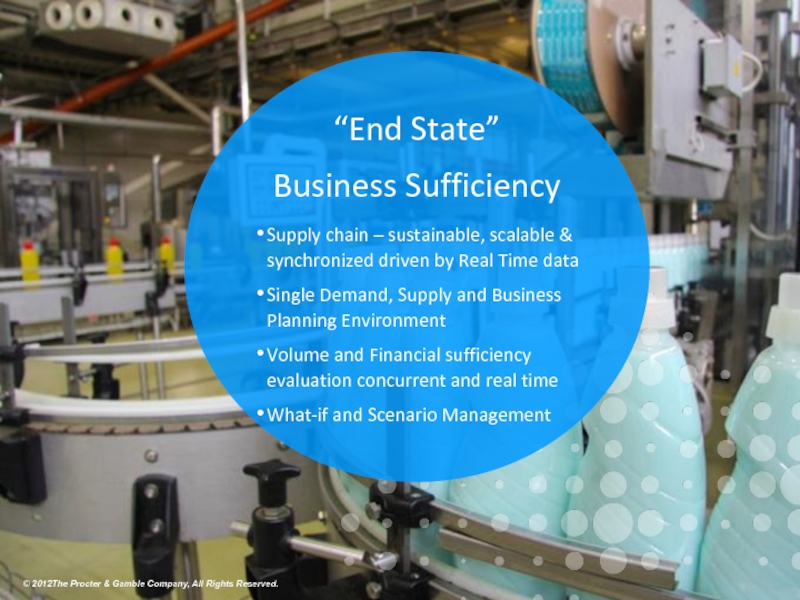
Слайд 18“End State”
Business Sufficiency
Supply chain – sustainable, scalable & synchronized driven by
Single Demand, Supply and Business Planning Environment
Volume and Financial sufficiency evaluation concurrent and real time
What-if and Scenario Management
© 2012The Procter & Gamble Company, All Rights Reserved.
Слайд 19Panelist’s Perspective
Initial Thoughts on:
Level Set – What’s Your Definition of
Demand Driven – Dead or Alive?
What is behind the lack of broad scale success given
the potential offered?
What are some practical interventions or
advancements that would significantly change the
game here?
How do we deal with driving the improvement in the
crossover of source, make, deliver?
Compelling thought you want to leave the audience with.
Слайд 21
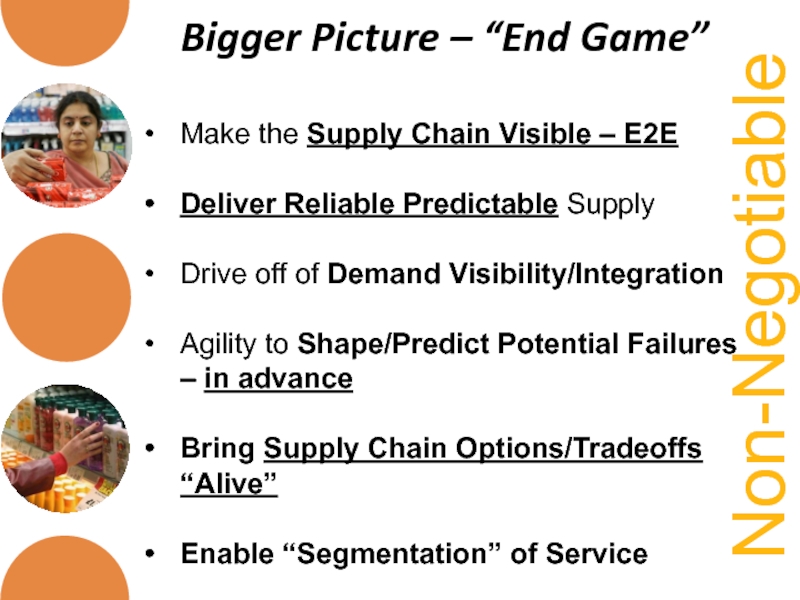
Make the Supply Chain Visible – E2E
Deliver Reliable Predictable Supply
Drive off
Agility to Shape/Predict Potential Failures – in advance
Bring Supply Chain Options/Tradeoffs
“Alive”
Enable “Segmentation” of Service
Non-Negotiable
Bigger Picture – “End Game”
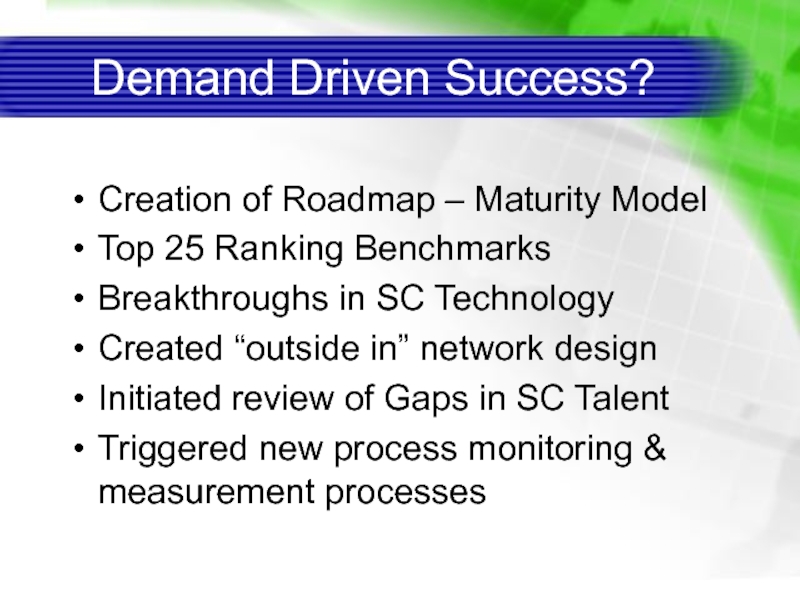
Слайд 22Demand Driven Success?
Creation of Roadmap – Maturity Model
Top 25 Ranking Benchmarks
Breakthroughs
Created “outside in” network design
Initiated review of Gaps in SC Talent
Triggered new process monitoring & measurement processes
Слайд 26Traditional Process Design is “Blind”
Barrier to Progress
Enterprise Wide Planning/Optimization
Process Design
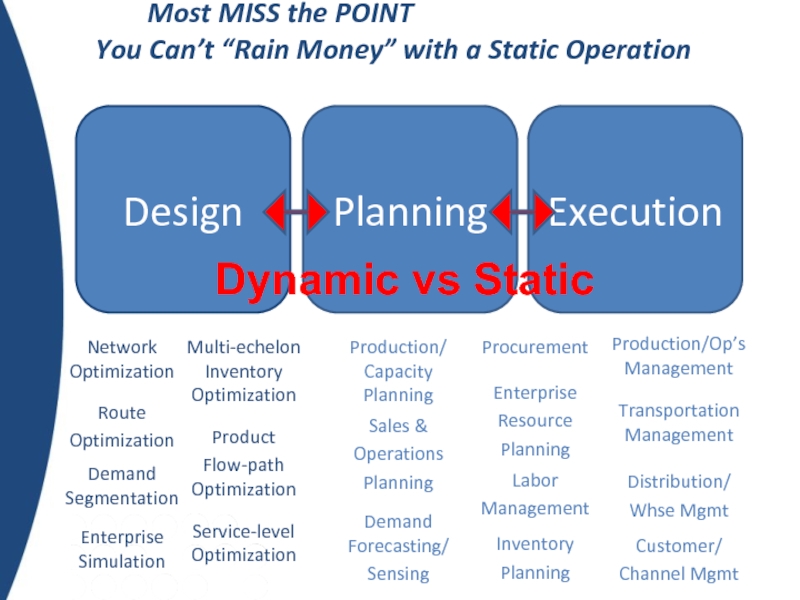
Слайд 27 Most MISS the POINT You Can’t “Rain
Transportation Management
Execution
Planning
Design
Enterprise
Resource
Planning
Distribution/
Whse Mgmt
Labor
Management
Production/ Capacity Planning
Customer/
Channel Mgmt
Sales &
Operations
Planning
Demand Forecasting/
Sensing
Inventory
Planning
Procurement
Network Optimization
Multi-echelon Inventory Optimization
Route
Optimization
Product
Flow-path Optimization
Demand Segmentation
Service-level Optimization
Enterprise Simulation
Production/Op’s Management
Dynamic vs Static
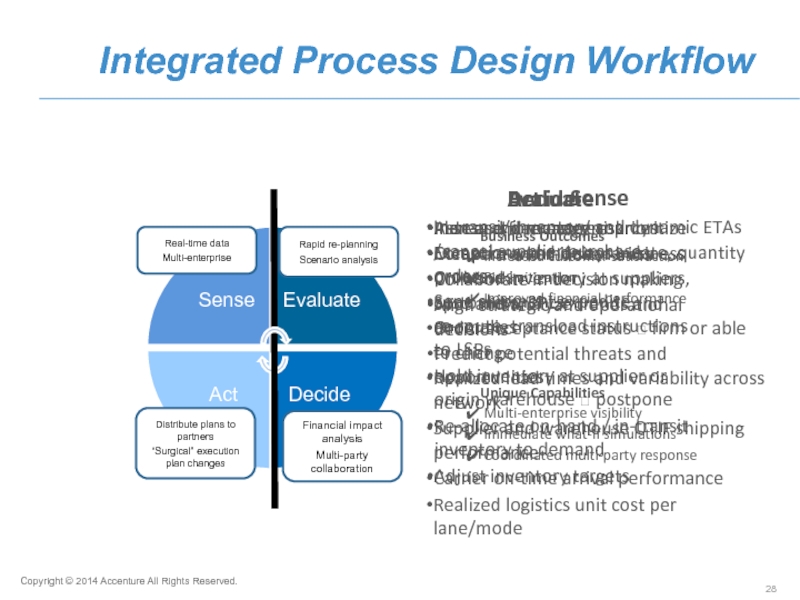
Слайд 28Sense
Evaluate
Decide
Act
Business Outcomes
Increased customer satisfaction
Risk mitigation
Improved financial performance
Unique Capabilities
Immediate what-if simulations
Coordinated multi-party response
Real-time data
Multi-enterprise
Rapid re-planning
Scenario analysis
Distribute plans to partners
“Surgical” execution plan changes
Financial impact analysis
Multi-party collaboration
Sense
In-transit inventory and dynamic ETAs
Exceptions and delays – date, quantity
On-hand inventory at suppliers, customers, 3PLs
Order acceptance status ? firm or able to change
Realized lead times and variability across network
Supplier and warehouse OTIF shipping performance
Carrier on-time arrival performance
Realized logistics unit cost per lane/mode
Evaluate
Plan and forecast resources
Measure and monitor business processes
Spot and analyze trends and anomalies
Predict potential threats and opportunities
Decide
Assess and manage risk
Compare what-if scenarios
Collaborate in decision making
Align strategic and operational decisions
Act
Increase/decrease/re-prioritize/cancel supplier purchase orders
Send shipment expedite, re-route, transload instructions to LSPs
Hold inventory at supplier or origin warehouse ? postpone
Re-allocate on-hand / in-transit inventory to demand
Adjust inventory targets
Copyright © 2014 Accenture All Rights Reserved.
Integrated Process Design Workflow
Process Design

