- Главная
- Разное
- Дизайн
- Бизнес и предпринимательство
- Аналитика
- Образование
- Развлечения
- Красота и здоровье
- Финансы
- Государство
- Путешествия
- Спорт
- Недвижимость
- Армия
- Графика
- Культурология
- Еда и кулинария
- Лингвистика
- Английский язык
- Астрономия
- Алгебра
- Биология
- География
- Детские презентации
- Информатика
- История
- Литература
- Маркетинг
- Математика
- Медицина
- Менеджмент
- Музыка
- МХК
- Немецкий язык
- ОБЖ
- Обществознание
- Окружающий мир
- Педагогика
- Русский язык
- Технология
- Физика
- Философия
- Химия
- Шаблоны, картинки для презентаций
- Экология
- Экономика
- Юриспруденция
Lean LaunchPad Workshop:Defining an Analytics Strategy презентация
Содержание
- 1. Lean LaunchPad Workshop:Defining an Analytics Strategy
- 2. Why Are Analytics Important? Failure to define
- 3. Why You Need an Analytics Strategy Learn
- 4. History of Analytics 1990s – Web counters
- 5. Keys to a Great Analytics Strategy Tightly
- 6. The Modern Data-Driven Lean Startup Goal is
- 7. Most Important Reports Segmentation
- 8. Segmentation / Cohorting What segments are getting what value out of your product?
- 9. Value Proposition / Customer Segment Who is
- 10. Segmentation Example Look at aggregated events and
- 11. Retention Who gets the most value out of your solution?
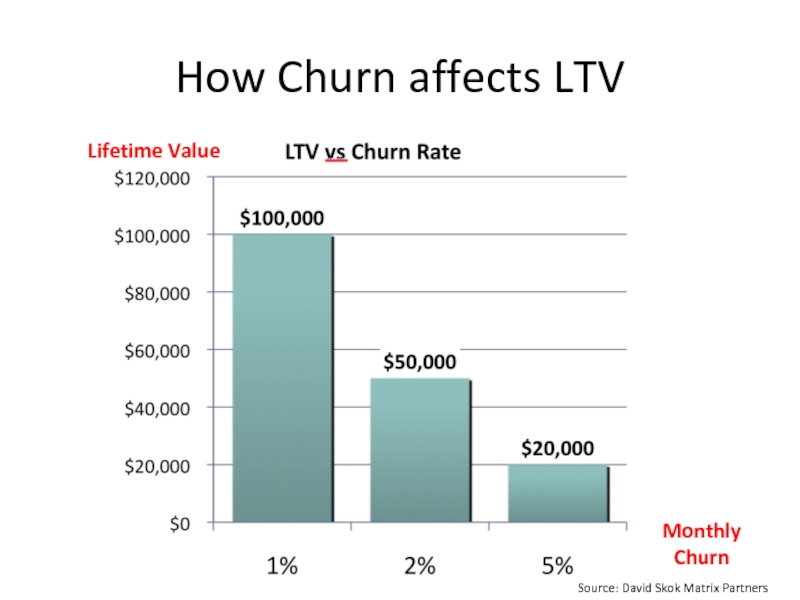
- 12. How Churn affects LTV Lifetime Value Monthly Churn Source: David Skok Matrix Partners
- 13. Thinking Through Retention Get –> Keep –>
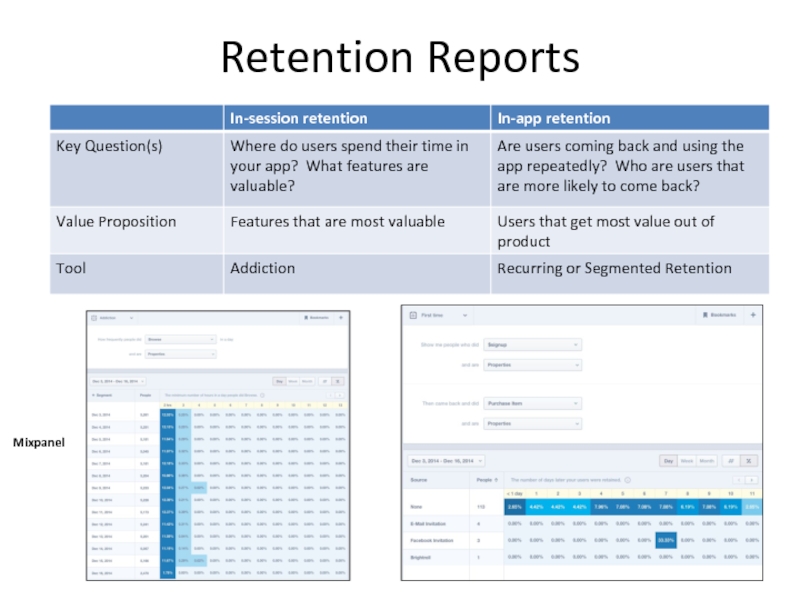
- 14. Retention Reports Mixpanel
- 15. BIG IDEA: LTV drives CAC which drives
- 16. Funnels How are users interacting with your solution?
- 17. Sales Funnels Where are we losing customers?
- 18. Funnel Reports Localytics
- 19. Funnel Reports KISSMetrics
- 20. Tying funnels to revenues Revenue = installs
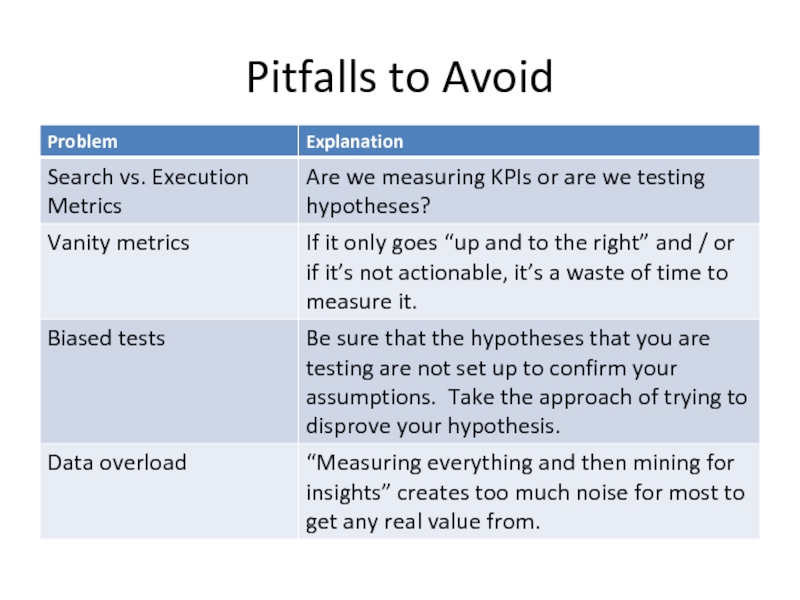
- 21. Pitfalls to Avoid
- 22. Summary You need to be thinking about
- 23. Case Studies
- 24. Airbnb Challenge: Initially wanted to optimize booking
- 25. Khan Academy Challenge: increase engagement and the
- 26. Jawbone Challenge: Assess the viability of Jawbone
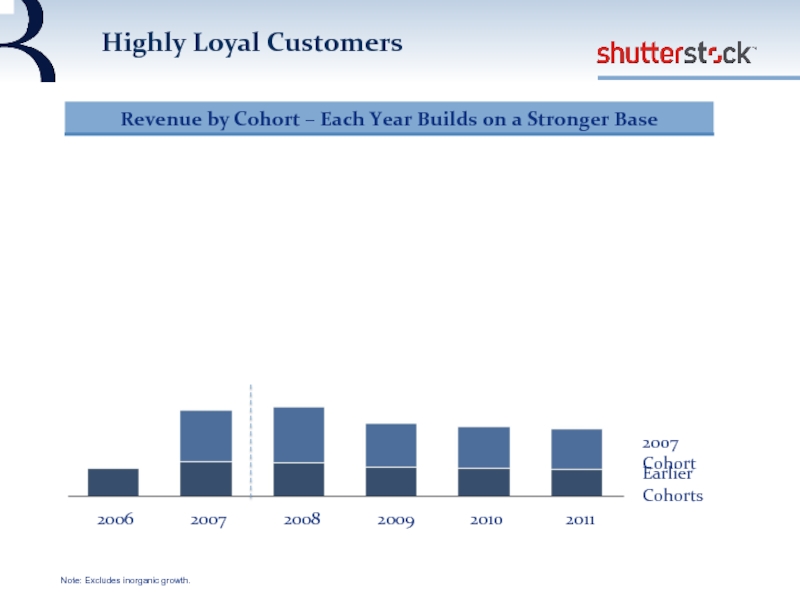
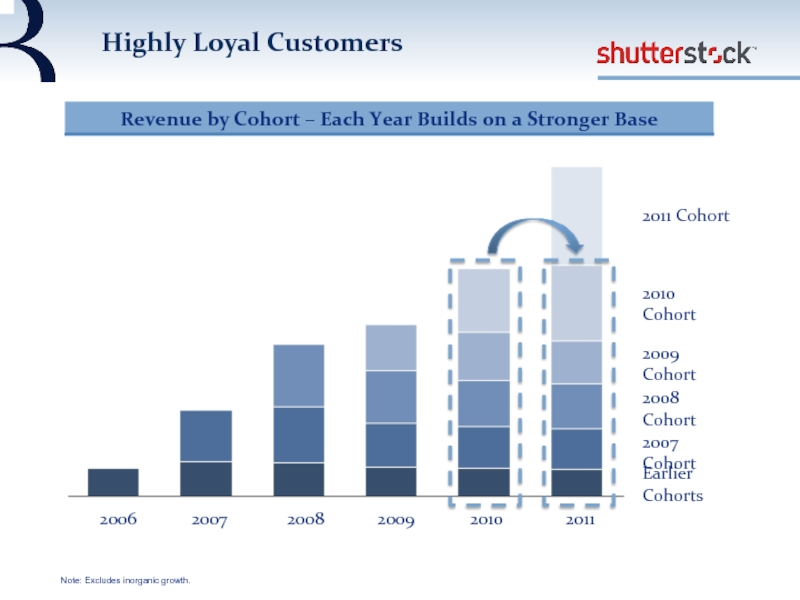
- 27. Cohort analysis Renewal and upsell rates Return on marketing investment
- 28. Note: Excludes inorganic growth. 2011 2010 2009 2008 2007 2006 Highly Loyal Customers
- 29. 2006 2008 Cohort 2009 Cohort 2010 Cohort
Слайд 1Lean LaunchPad Workshop:
Defining an Analytics Strategy
Ryan Jung
Haas MBA 2014
ryan_jung@haas.berkeley.edu
Слайд 2Why Are Analytics Important?
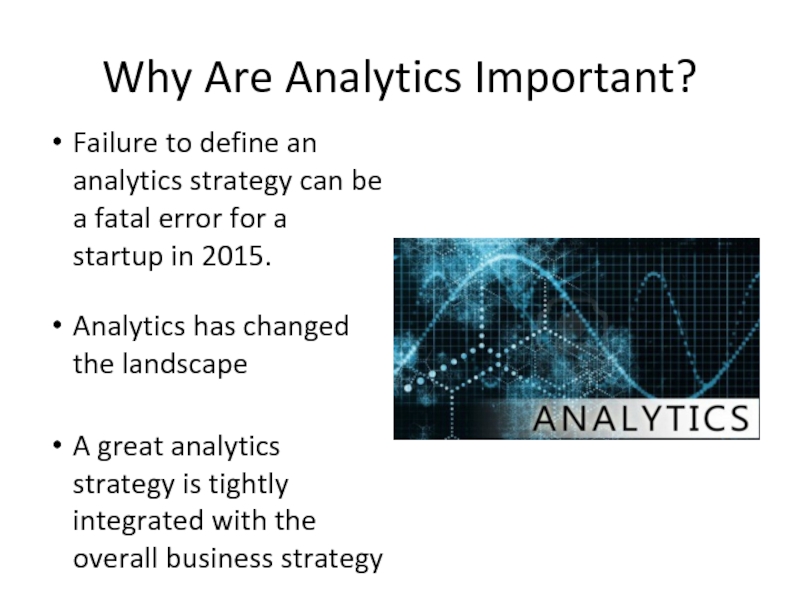
Failure to define an analytics strategy can be
Analytics has changed the landscape
A great analytics strategy is tightly integrated with the overall business strategy
Слайд 3Why You Need an Analytics Strategy
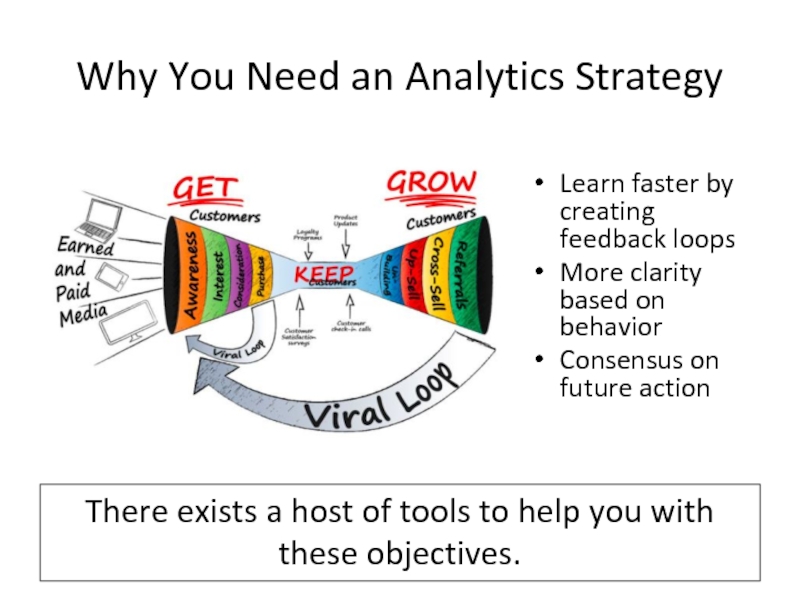
Learn faster by creating feedback loops
More
Consensus on future action
There exists a host of tools to help you with these objectives.
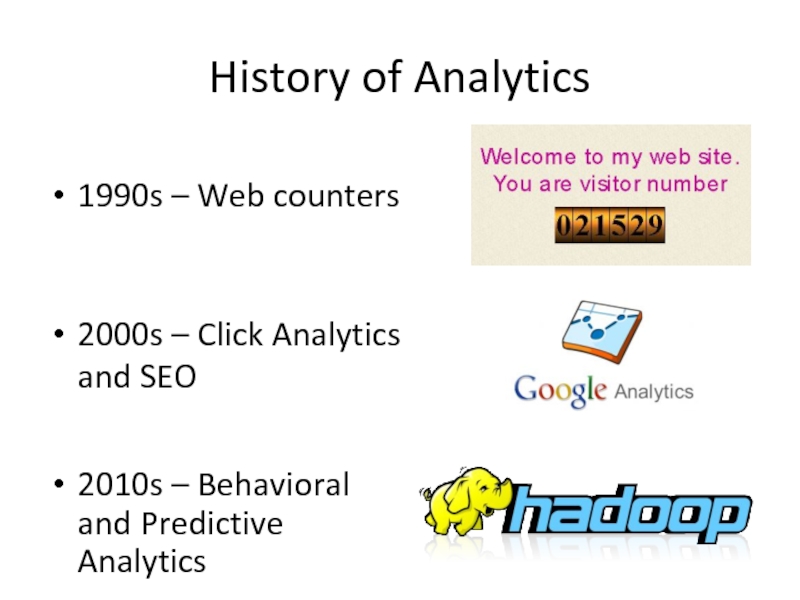
Слайд 4History of Analytics
1990s – Web counters
2000s – Click Analytics and SEO
2010s
Слайд 5Keys to a Great Analytics Strategy
Tightly integrated with overall business strategy
Iterative process
Measurable set of hypotheses, results, and revisions
Слайд 6The Modern Data-Driven Lean Startup
Goal is to optimize a set of
Слайд 7
Most Important Reports
Segmentation (Cohorting)
Retention
Funnels
Revenue Tracking
Marketing Campaign Effectiveness
Path Analysis
Notifications
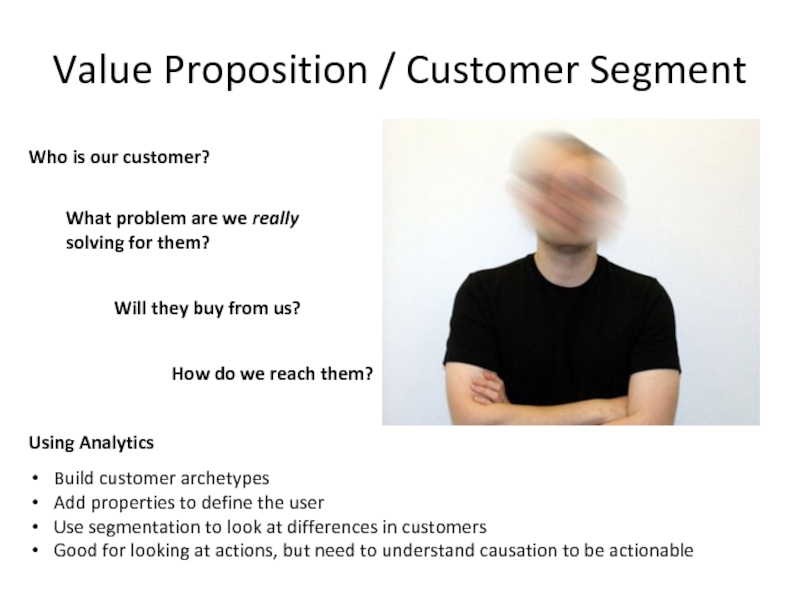
Слайд 9Value Proposition / Customer Segment
Who is our customer?
What problem are we
Will they buy from us?
How do we reach them?
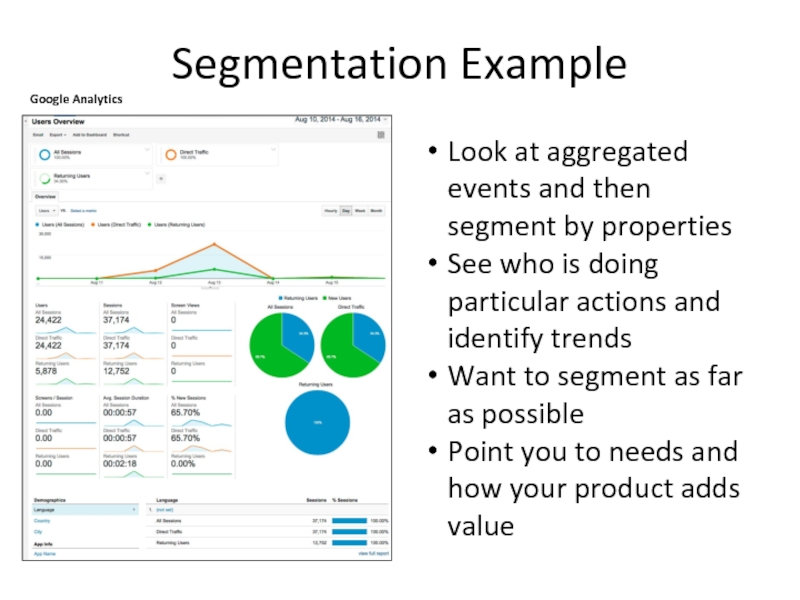
Слайд 10Segmentation Example
Look at aggregated events and then segment by properties
See who
Want to segment as far as possible
Point you to needs and how your product adds value
Google Analytics
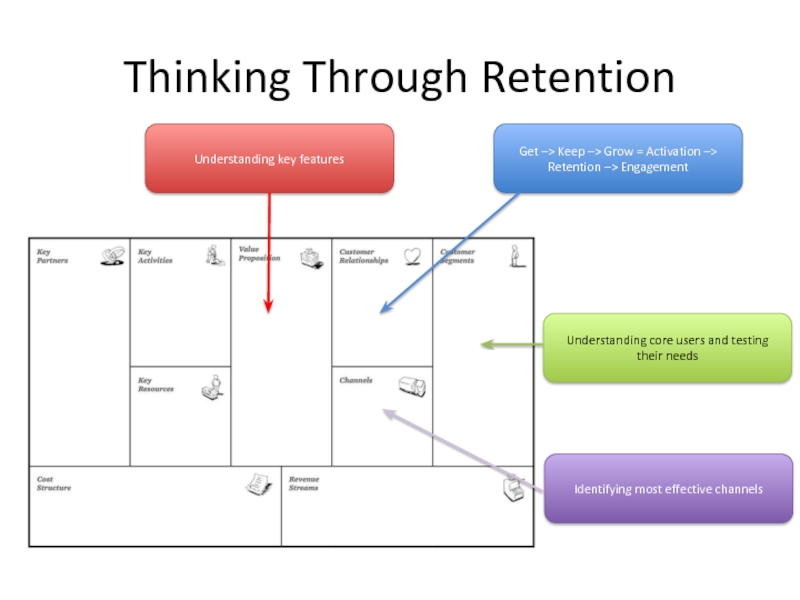
Слайд 13Thinking Through Retention
Get –> Keep –> Grow = Activation –> Retention
Understanding key features
Understanding core users and testing their needs
Identifying most effective channels
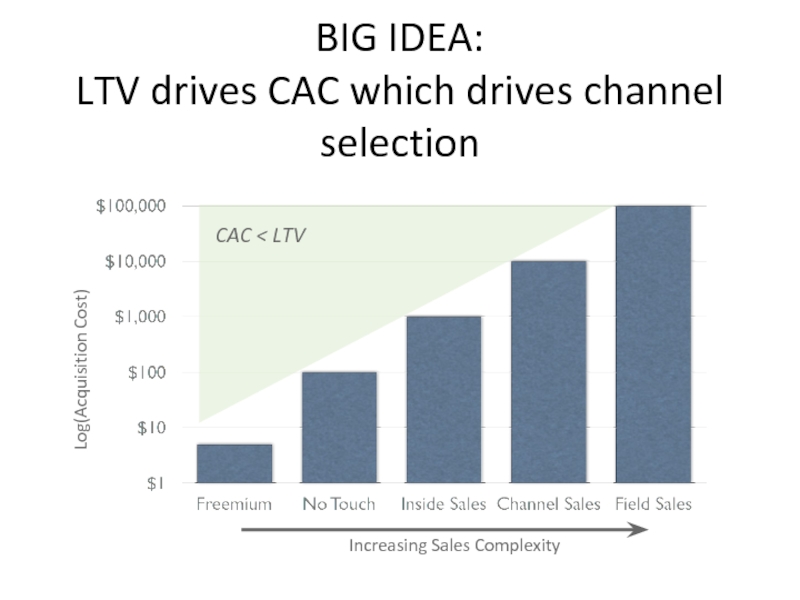
Слайд 15BIG IDEA:
LTV drives CAC which drives channel selection
Increasing Sales Complexity
Log(Acquisition Cost)
CAC
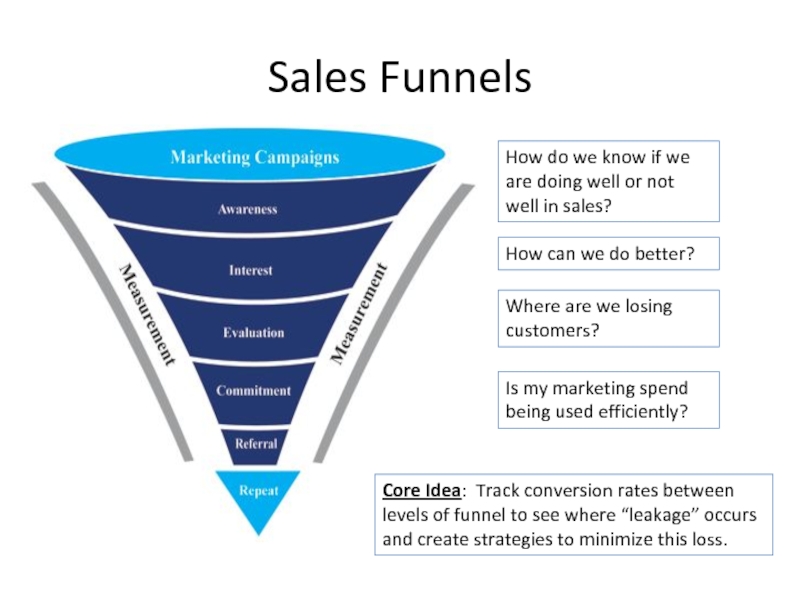
Слайд 17Sales Funnels
Where are we losing customers?
How do we know if we
How can we do better?
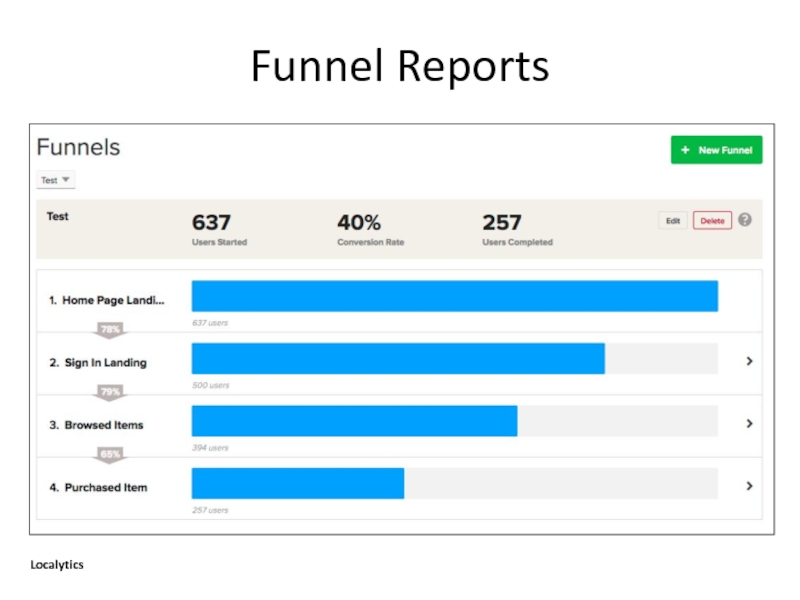
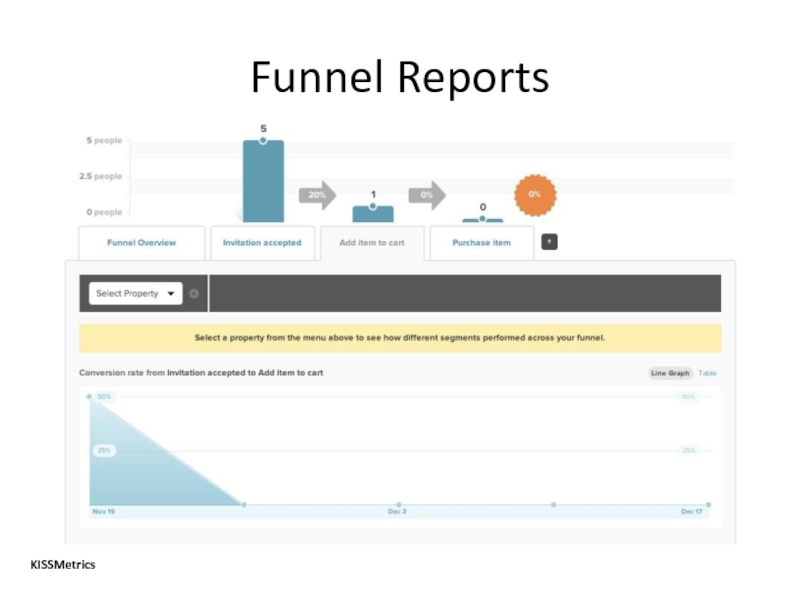
Core Idea: Track conversion rates between levels of funnel to see where “leakage” occurs and create strategies to minimize this loss.
Is my marketing spend being used efficiently?
Слайд 20Tying funnels to revenues
Revenue = installs x [signups / installs] x
The main point here is that you can break revenue into measureable components
Tie how you earn revenue to what you measure
Then understand where you are doing well and not well
Then use your analytics solution to design tests to figure out how to drive more lifetime value
Mathematically:
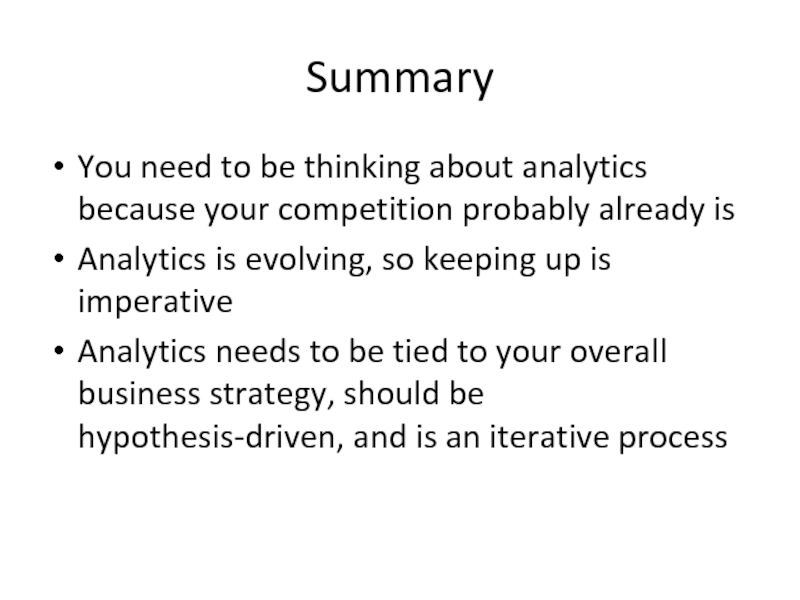
Слайд 22Summary
You need to be thinking about analytics because your competition probably
Analytics is evolving, so keeping up is imperative
Analytics needs to be tied to your overall business strategy, should be hypothesis-driven, and is an iterative process
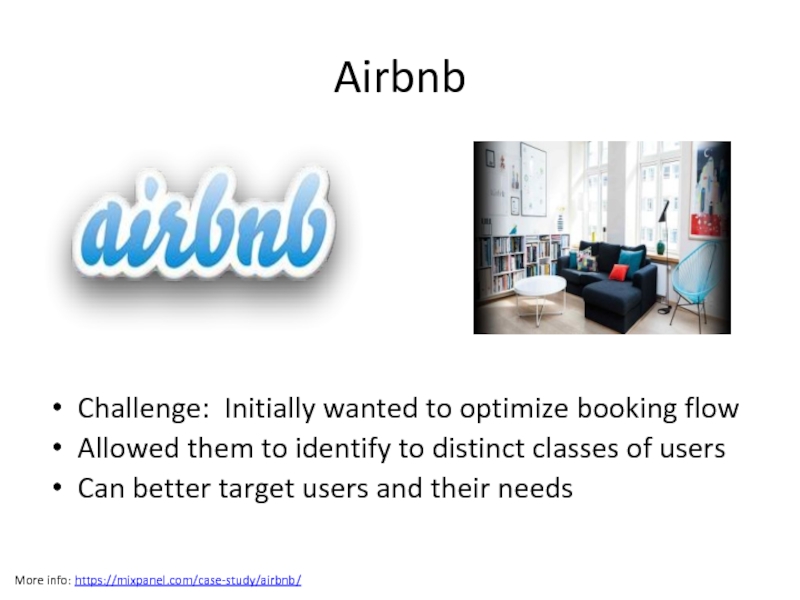
Слайд 24Airbnb
Challenge: Initially wanted to optimize booking flow
Allowed them to identify to
Can better target users and their needs
More info: https://mixpanel.com/case-study/airbnb/
Слайд 25Khan Academy
Challenge: increase engagement and the rate at which people learn
Used
Start with a definition for “user engagement”
More info: https://mixpanel.com/case-study/khanacademy/
Слайд 26Jawbone
Challenge: Assess the viability of Jawbone UP
Used Segmentation reporting to better
Helps to build customer archetypes
Faster iterations and faster time to product-market fit
More info: https://mixpanel.com/case-study/jawbone/
Слайд 292006
2008 Cohort
2009 Cohort
2010 Cohort
2011 Cohort
2011
2010
2009
2008
2007
Highly Loyal Customers
Note: Excludes inorganic growth.
2007
Earlier Cohorts



![Tying funnels to revenuesRevenue = installs x [signups / installs] x [purchases / signups ]](/img/tmb/2/164242/6b9ffcc0ab5021d403274277be10c1cb-800x.jpg)
