Cliff Crocker
Velocity Santa Clara 2015
- Главная
- Разное
- Дизайн
- Бизнес и предпринимательство
- Аналитика
- Образование
- Развлечения
- Красота и здоровье
- Финансы
- Государство
- Путешествия
- Спорт
- Недвижимость
- Армия
- Графика
- Культурология
- Еда и кулинария
- Лингвистика
- Английский язык
- Астрономия
- Алгебра
- Биология
- География
- Детские презентации
- Информатика
- История
- Литература
- Маркетинг
- Математика
- Медицина
- Менеджмент
- Музыка
- МХК
- Немецкий язык
- ОБЖ
- Обществознание
- Окружающий мир
- Педагогика
- Русский язык
- Технология
- Физика
- Философия
- Химия
- Шаблоны, картинки для презентаций
- Экология
- Экономика
- Юриспруденция
Metrics, metrics everywhere(but where the heck do you start?) презентация
Содержание
- 1. Metrics, metrics everywhere(but where the heck do you start?)
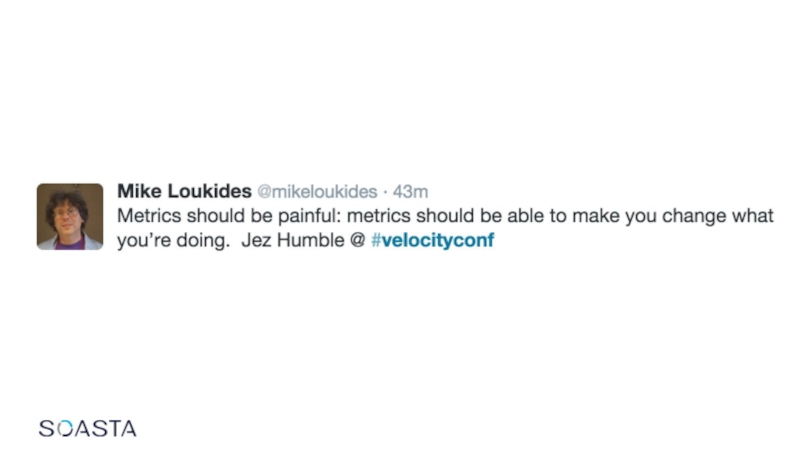
- 2. @tameverts @cliffcrocker #velocityconf
- 4. Who cares about performance today? How
- 6. The myth of a single metric
- 9. Who cares about performance?
- 10. “47% of consumers expect a web
- 12. 1s = $27M DNS 144ms Start render 1.59s Hero image render 2.01s
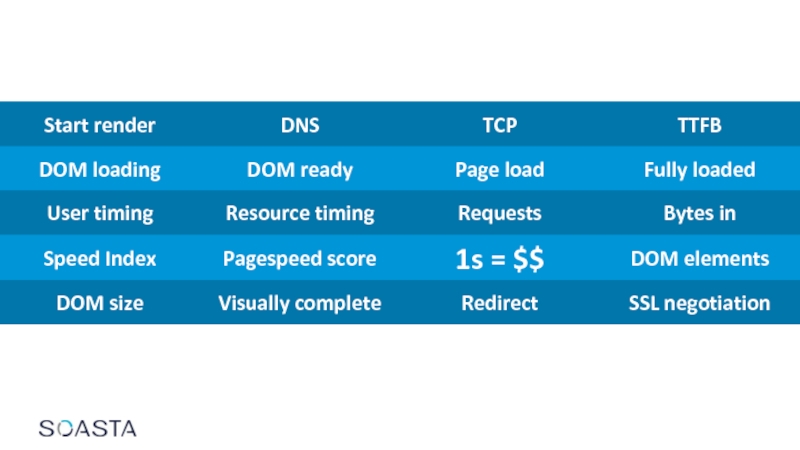
- 13. How do I measure performance?
- 17. Android device fragmentation OpenSignal, August 2014
- 18. RUM versus plus synthetic
- 19. RUM 101
- 20. Technology for collecting performance metrics directly
- 21. What makes RUM great Always
- 22. Questions your RUM data can answer
- 23. What are my users’ environments?
- 24. How do visitors move through my site?
- 25. How are my third-party scripts performing in real time?
- 26. What impact does performance have on my business?
- 27. Synthetic Monitoring 101
- 28. Uses automated agents (bots) to measure
- 29. What makes synthetic monitoring great
- 30. Questions your synthetic data can answer
- 31. How do I compare to the competition?
- 32. How does the design of my pages affect performance?
- 33. How does the newest version
- 34. How well am I sticking to my performance budget?
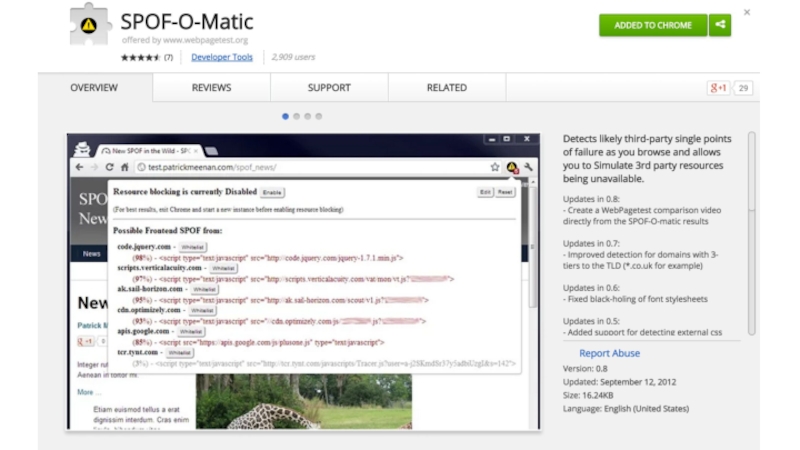
- 35. What if my third parties fail? Original: 3.5s SPOF: 22.7s
- 37. Common things we hear about RUM &
- 38. “But it loads so much faster
- 39. boomerang.js Episodes
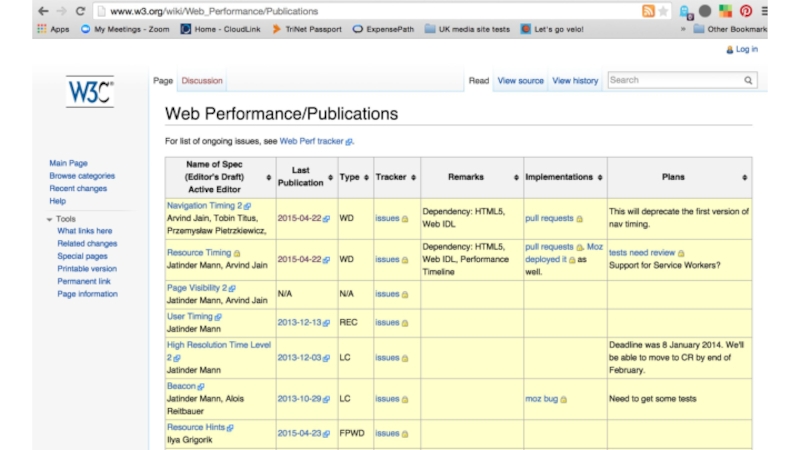
- 40. W3C Performance Working Group
- 43. How fast am I?
- 44. Navigation Timing API
- 45. Browser support for Navigation Timing !
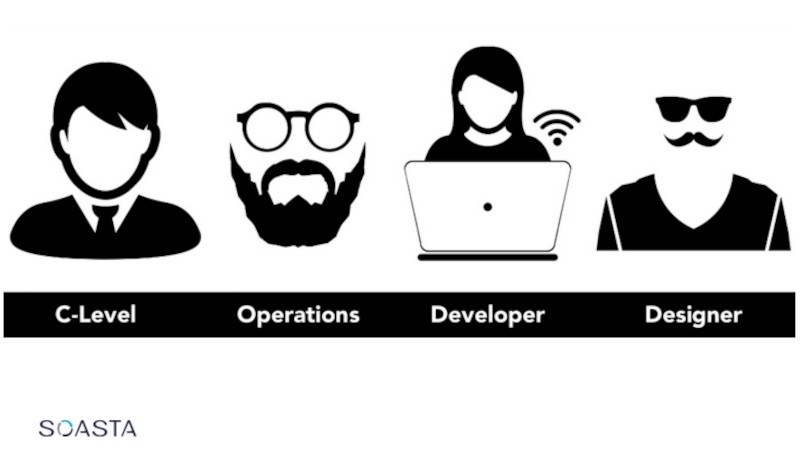
- 46. Role-specific use cases Network operations Front-end developer Marketing and site operations Designer C-level
- 47. Use case: Measure network performance
- 48. I need visibility into… issues with
- 50. Measuring DNS and TCP function
- 51. What’s with all those zeros! Connection reuse DNS caching Prefetching
- 52. Focus on higher percentiles 85th percentile Median (50th)
- 53. Use case: Measure front-end browser events
- 54. How do I… understand the impact
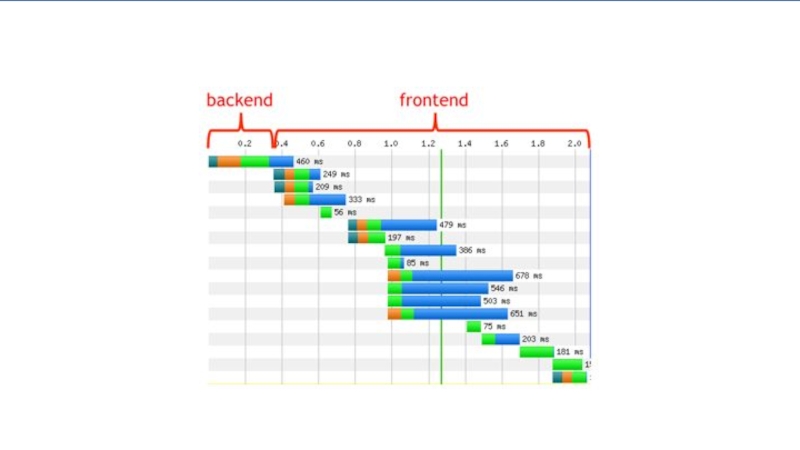
- 56. Isolate front-end vs. back-end
- 57. Isolate front-end vs. back-end function
- 59. Front-end Back-end
- 60. Investigate DOM events function getPerf()
- 61. 2618 DOM nodes 86 DOM nodes Visualizing DOM complexity
- 62. Use case: Measure object-level performance
- 63. I need to understand… how third-party
- 65. Resource Timing interface
- 66. Browser support for Resource Timing
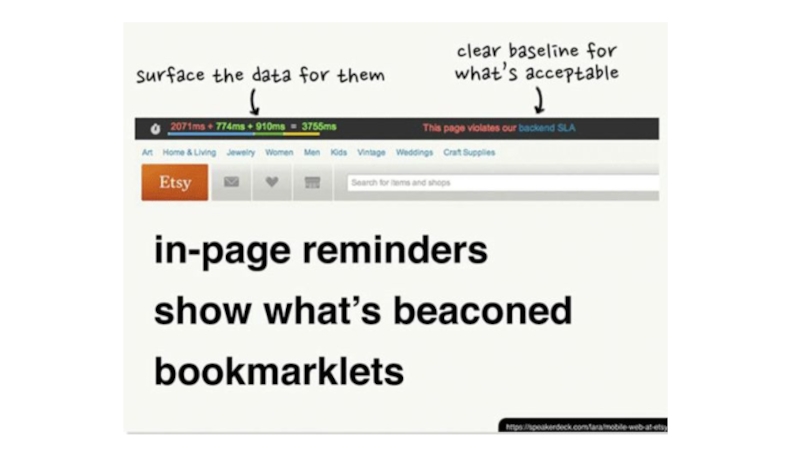
- 67. Cross-Origin Resource Sharing (CORS) Start/End
- 68. Resource Timing var rUrl =
- 69. Other uses for Resource Timing Slowest
- 70. Using Resource Groups PLT impact
- 71. Use case: Measure the user experience
- 72. I just need to understand… when
- 74. The fallacy of “First Paint” in
- 75. First Paint is not equal to
- 76. Start Render and filmstrips
- 77. User Timing Interface Allows developers to
- 78. Measure duration between two marks
- 79. How long does it take to
- 80. Record when an image loads
- 81. How do I measure performance
- 82. onload event visible resources
- 83. Measuring SPAs Accept the fact that
- 84. How fast should I be?
- 85. Use case: Measure business impact
- 86. I need to understand… how performance
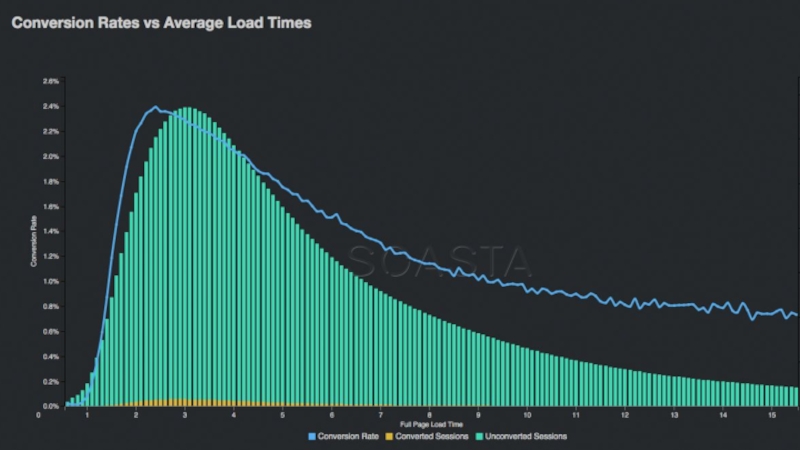
- 90. 2% increase in conversions for every 1 second of improvement
- 91. Cut load times in half Increased sales by 13%
- 93. So what? You must look at your own data.
- 96. Not all pages are created equal Top
- 97. Not all pages are created equal Bottom
- 98. Conversion Impact Score
- 99. How do I get there?
- 101. Create a performance budget See:
- 102. Set meaningful, page-specific SLAs
- 103. “Response time measured using resource timing
- 104. “Vendor will make an effort to
- 106. Chapter 8: Changing Culture at Your Organization
- 107. performancebacon.com performancebeacon.com
- 108. Thanks!
- 109. Meet us at booth #801
Tammy Everts & Cliff Crocker Velocity")


Слайд 4
Who cares about performance today?
How do I measure performance?
How fast am
I?
How fast should I be?
How do I get there?
How fast should I be?
How do I get there?


Слайд 20
Technology for collecting performance metrics directly from the end user’s browser
Involves
instrumenting your site via JavaScript
Measurements are fired across the network to a collection point through a small request object (beacon)
Measurements are fired across the network to a collection point through a small request object (beacon)

Слайд 21
What makes RUM great
Always on
Every user, every browser, everywhere
Able to capture
human behavior/events
Only getting better
Only getting better


Слайд 28
Uses automated agents (bots) to measure your website from different physical
locations
A set “path” or URL is defined
Tests are run either ad hoc or scheduled, and data is collected
A set “path” or URL is defined
Tests are run either ad hoc or scheduled, and data is collected
 to measure your website from different physical locationsA set “path” or")
Слайд 29
What makes synthetic monitoring great
Rich data collected (waterfall, video, filmstrip, HTTP
headers)
Consistent “clean room” baseline
Nothing to install
Doesn’t require users / ability to measure pre-production and competition
Consistent “clean room” baseline
Nothing to install
Doesn’t require users / ability to measure pre-production and competition
Consistent “clean room” baselineNothing")


Слайд 37Common things we hear about RUM & synthetic
Why are these numbers
so different?
I don’t trust your data. Your numbers are wrong.
How are you calculating page load time?
I can’t share two sets of numbers with the business?
I don’t trust your data. Your numbers are wrong.
How are you calculating page load time?
I can’t share two sets of numbers with the business?

Слайд 38
“But it loads so much faster for me!?!”
2015 Macbook Pro
Warm browser
cache
FIOS
FIOS
X86 – Windows 7 VM
Completely cold cache/DNS
Throttled bandwidth


Слайд 46Role-specific use cases
Network operations
Front-end developer
Marketing and site operations
Designer
C-level


Слайд 48
I need visibility into…
issues with authoritative DNS servers
impact of denial of
service attacks
on end users
efficiency of connection re-use
tier 1 connectivity issues (load balancer, web server)
efficiency of connection re-use
tier 1 connectivity issues (load balancer, web server)

Слайд 50
Measuring DNS and TCP
function getPerf() {
var timing = window.performance.timing;
return
{
dns: timing.domainLookupEnd - timing.domainLookupStart};
connect: timing.connectEnd - timing.connectStart};
}
dns: timing.domainLookupEnd - timing.domainLookupStart};
connect: timing.connectEnd - timing.connectStart};
}
 { var timing = window.performance.timing; return { dns: timing.domainLookupEnd - timing.domainLookupStart}; connect:")

")

Слайд 54
How do I…
understand the impact of back-end
versus front-end on page
speed?
investigate how DOM complexity affects performance?
measure a “fully loaded” page?
investigate how DOM complexity affects performance?
measure a “fully loaded” page?


Слайд 57
Isolate front-end vs. back-end
function getPerf() {
var timing = window.performance.timing;
return
{
ttfb: timing.responseStart - timing.connectEnd};
basePage: timing.responseEnd - timing.responseStart};
frontEnd: timing.loadEventStart - timing.responseEnd};
}
ttfb: timing.responseStart - timing.connectEnd};
basePage: timing.responseEnd - timing.responseStart};
frontEnd: timing.loadEventStart - timing.responseEnd};
}
 { var timing = window.performance.timing; return { ttfb: timing.responseStart - timing.connectEnd}; basePage:")

Слайд 60
Investigate DOM events
function getPerf() {
var timing = window.performance.timing;
return {
DLoading:
timing.domLoading – timing.navigationStart};
DInt: timing.domInteractive – timing.navigationStart};
DContLoaded: timing.domContentLoadedEventEnd – timing.navigationStart;
DContLoadTime: timing.domContentLoadedEventEnd – timing.domContentLoadedEventStart};
DComplete: timing.domComplete - timing.navigationStart};
PLoad: timing.loadEventStart - timing.navigationStart};
}
 { var timing = window.performance.timing; return { DLoading: timing.domLoading – timing.navigationStart}; DInt: timing.domInteractive")


Слайд 63
I need to understand…
how third-party content affects my performance
how long a
group of assets takes to download
how assets served by a CDN are performing
how assets served by a CDN are performing


Слайд 67
Cross-Origin Resource Sharing (CORS)
Start/End time only unless Timing-Allow-Origin
HTTP Response Header
defined
Timing-Allow-Origin = "Timing-Allow-Origin" ":" origin-list-or-null | "*"
Start/End time only unless Timing-Allow-Origin HTTP Response Header definedTiming-Allow-Origin =")
Слайд 68
Resource Timing
var rUrl = ‘http://www.akamai.com/images/img/cliff-crocker-dualtone-150x150.png’;
var me = performance.getEntriesByName(rUrl)[0];
var timings = {
loadTime: me.duration,
dns: me.domainLookupEnd - me.domainLookupStart,
tcp: me.connectEnd - me.connectStart,
waiting: me.responseStart - me.requestStart,
fetch: me.responseEnd - me.responseStart
}
dns: me.domainLookupEnd - me.domainLookupStart,
tcp: me.connectEnd - me.connectStart,
waiting: me.responseStart - me.requestStart,
fetch: me.responseEnd - me.responseStart
}
Measuring a single resource
[0];var timings = { loadTime: me.duration, dns: me.domainLookupEnd")
Слайд 69
Other uses for Resource Timing
Slowest resources
Time to first image (download)
Response time
by domain
Time a group of assets
Response time by initiator type (element type)
Cache-hit ratio for resources
Time a group of assets
Response time by initiator type (element type)
Cache-hit ratio for resources
For examples see: https://github.com/lognormal/beyond-page-metrics
Response time by domainTime a group")
Слайд 70
Using Resource Groups
PLT impact not due resource groups
PLT impact correlates
with improvement
from image domains


Слайд 72
I just need to understand…
when users perceive the page to
be
ready
how long until my page begins to render
when content above the fold is visible
how long until my page begins to render
when content above the fold is visible

Слайд 74
The fallacy of “First Paint” in the wild
Support for First Paint
is not standardized between browsers
Metric can be misleading (i.e. painting a white screen)
Metric can be misleading (i.e. painting a white screen)


Слайд 77
User Timing Interface
Allows developers to measure performance of their applications through
high-precision timestamps
Consists of “marks” and “measures”
PerformanceMark: Timestamp
PerformanceMeasure: Duration between two given marks
Consists of “marks” and “measures”
PerformanceMark: Timestamp
PerformanceMeasure: Duration between two given marks

Слайд 78
Measure duration between two marks
performance.mark(“startTask”);
//Some stuff you want to measure happens
here
performance.mark(“stopTask”);
//Measure the duration between the two marks
performance.measure(“taskDuration”,“startTask”,“stopTask”);
performance.mark(“stopTask”);
//Measure the duration between the two marks
performance.measure(“taskDuration”,“startTask”,“stopTask”);
;//Some stuff you want to measure happens hereperformance.mark(“stopTask”);//Measure the duration between")

Слайд 80
Record when an image loads
For more interesting examples, see:
Measure
hero image delay
http://www.stevesouders.com/blog/2015/05/12/hero-image-custom-metrics/
Measure aggregate times to get an “above fold time”
http://blog.patrickmeenan.com/2013/07/measuring-performance-of-user-experience.html
http://www.stevesouders.com/blog/2015/05/12/hero-image-custom-metrics/
Measure aggregate times to get an “above fold time”
http://blog.patrickmeenan.com/2013/07/measuring-performance-of-user-experience.html

Слайд 81
How do I measure performance
when the onload event no longer
matters?
Use case: Measure
performance of SPAs


Слайд 83
Measuring SPAs
Accept the fact that onload no longer matters
Tie into routing
events of SPA framework
Measure downloads during soft refreshes
(support in boomerang.js for Angular and other SPA frameworks)
See: http://www.soasta.com/blog/angularjs-real-user-monitoring-single-page-applications/
Measure downloads during soft refreshes
(support in boomerang.js for Angular and other SPA frameworks)
See: http://www.soasta.com/blog/angularjs-real-user-monitoring-single-page-applications/


Слайд 86
I need to understand…
how performance affects business KPIs
how our site compares
to our competitors


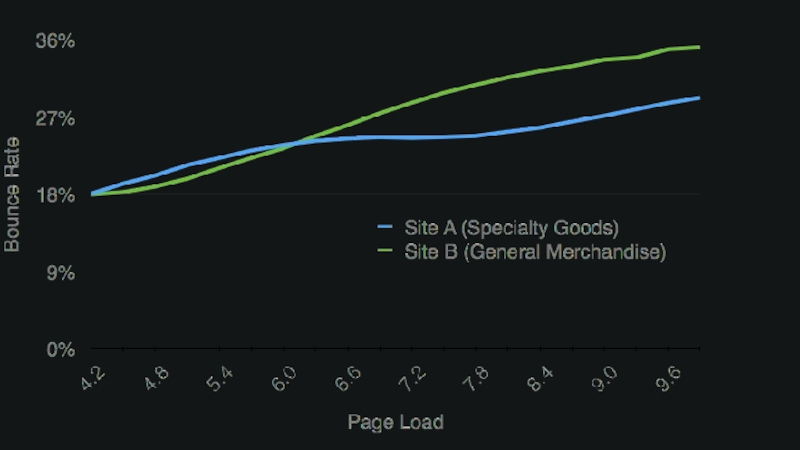
Слайд 96Not all pages are created equal
Top of funnel impact (“browse” pages)
For
a typical ecommerce site, conversion rate drops by up to 50% when “browse” pages increase from 1 to 6 seconds
For a typical ecommerce site,")
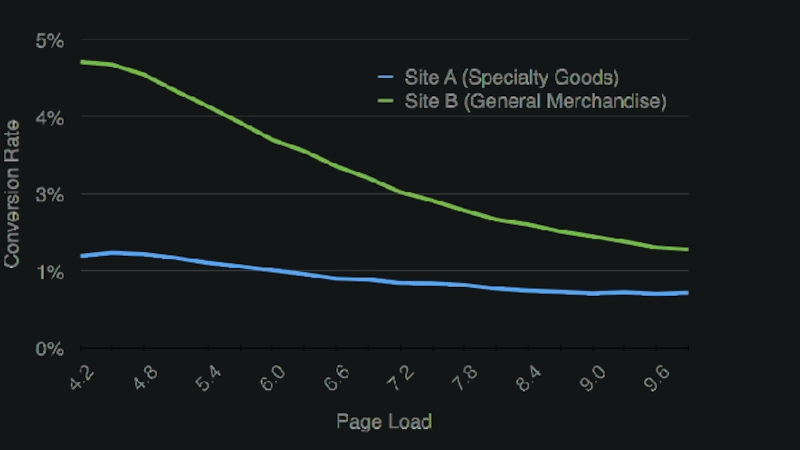
Слайд 97Not all pages are created equal
Bottom of funnel impact (“checkout” pages)
However,
there is much less impact to conversion when “checkout” pages degrade
However, there is much less")


Слайд 101
Create a performance budget
See:
Setting a Performance Budget
http://timkadlec.com/2013/01/setting-a-performance-budget/
Performance Budget Metrics
http://timkadlec.com/2014/11/performance-budget-metrics/


Слайд 103
“Response time measured using resource timing from Chrome browsers in the
United States should not exceed a median
(50th percentile) of 100ms or a 95th percentile of 500ms for
a population of more than 500 users in a 24-hour period.”

Слайд 104
“Vendor will make an effort to ensure average response times for
content is within reasonable limits.”