www.tnau.ac.in Department of Biotechnology,
Tamil Nadu Agricultural University AC&RI, Madurai
- Главная
- Разное
- Дизайн
- Бизнес и предпринимательство
- Аналитика
- Образование
- Развлечения
- Красота и здоровье
- Финансы
- Государство
- Путешествия
- Спорт
- Недвижимость
- Армия
- Графика
- Культурология
- Еда и кулинария
- Лингвистика
- Английский язык
- Астрономия
- Алгебра
- Биология
- География
- Детские презентации
- Информатика
- История
- Литература
- Маркетинг
- Математика
- Медицина
- Менеджмент
- Музыка
- МХК
- Немецкий язык
- ОБЖ
- Обществознание
- Окружающий мир
- Педагогика
- Русский язык
- Технология
- Физика
- Философия
- Химия
- Шаблоны, картинки для презентаций
- Экология
- Экономика
- Юриспруденция
Bio-Technology…… Genomics platform for agriculture презентация
Содержание
- 1. Bio-Technology…… Genomics platform for agriculture
- 2. “….. the best teaching can be done
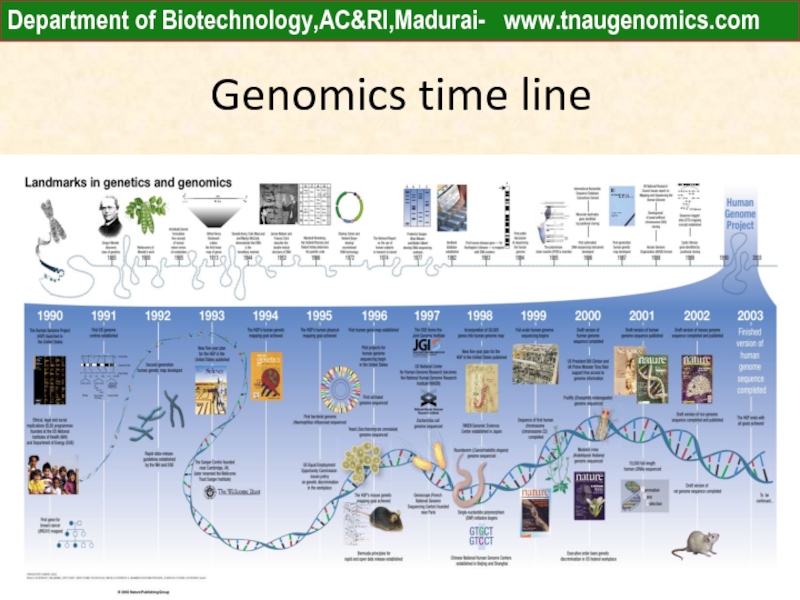
- 3. Genomics time line Department of Biotechnology,AC&RI,Madurai- www.tnaugenomics.com
- 4. Crop and plant genomes and their application.
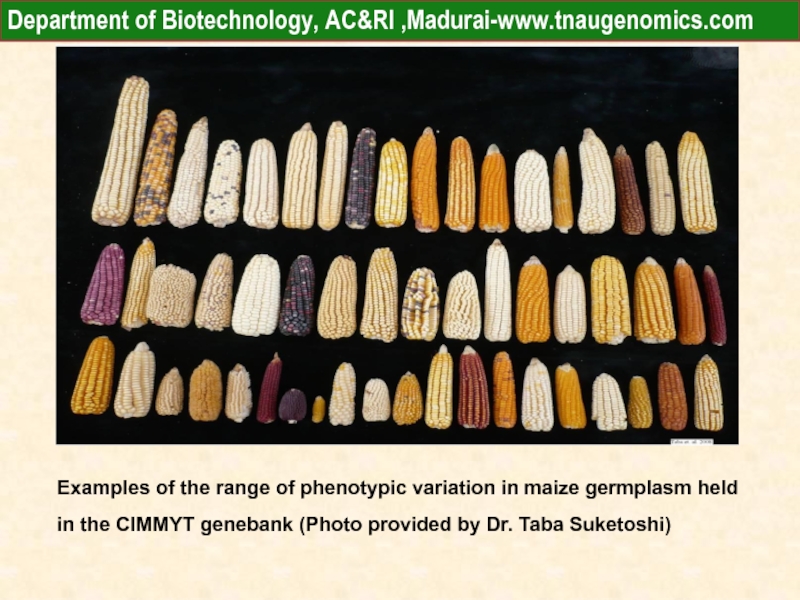
- 5. Examples of the range of phenotypic variation
- 6. Department of Biotechnology, AC&RI ,Madurai-www.tnaugenomics.com
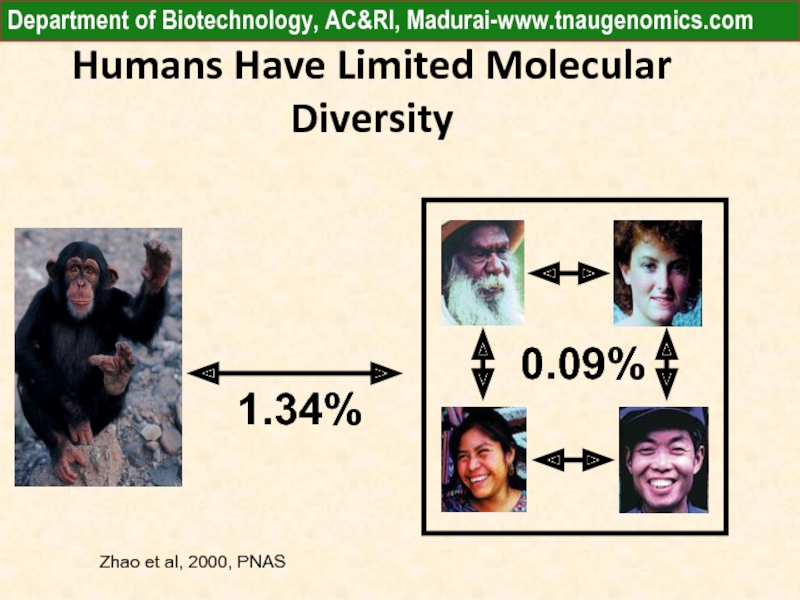
- 7. Humans Have Limited Molecular Diversity 0.09% Zhao
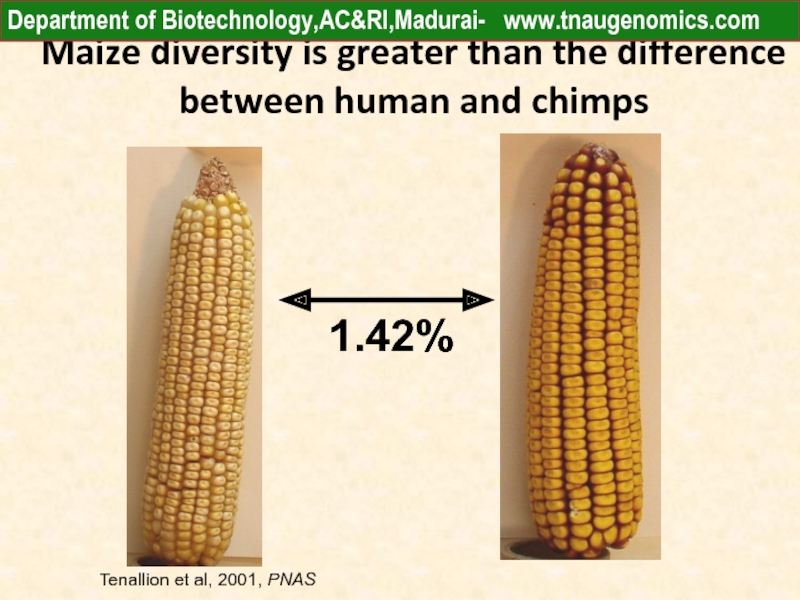
- 8. Maize diversity is greater than the difference
- 9. Arabidopsis Sequencing Facts Arabidopsis has a
- 10. The Human Genome Project The most public
- 11. Whole genome sequencing While we will not
- 12. Automated sequencing reactions - each reaction can
- 13. FISH analysis of the centromeric core
- 14. Comparing genomes: Example from the grasses This
- 15. SNP discovery- Early methods Re-sequencing of PCR
- 16. DNA sequencing output If you have DNA
- 17. What are markers? Markers, in the
- 18. Protein markers & quality of wheat Department of Biotechnology,AC&RI,Madurai- www.tnaugenomics.com
- 19. plant A plant B
- 20. Detection of PCR product
- 21. SSR Department of Biotechnology,AC&RI,Madurai- www.tnaugenomics.com
- 22. Microsatellite markers polymorphism between parental lines and
- 23. Department of Biotechnology,AC&RI,Madurai- www.tnaugenomics.com
- 24. Testing genetic purity of hybrid seeds of
- 25. Advantages of MAB: Cost Depending on the
- 26. Advantages of MAB: knowledge Using markers can
- 27. MAB: Costs Using molecular markers requires the
- 28. Crop Domestication: From plants in the
- 29. Crop Domestication Crop domestication inherently decreases
- 30. Traits selected for by humans Traits
- 31. Consequences of loss of genetic diversity:
- 32. Genetic diversity is available in genebanks
- 33. Germplasm banks Most crops have many accessions
- 34. Science 20 :November 2009: The B73 Maize Genome:
- 35. UMI 79 UMI 936(W) X
- 36. Marker assisted introgression of LycE /CrtRB1 gene
- 37. CrtRB1 gene based marker screening
- 38. Nutrigenomics Department of Biotechnology,AC&RI,Madurai- www.tnaugenomics.com
- 39. Department of Biotechnology,AC&RI,Madurai- www.tnaugenomics.com
- 40. Metabolomics Department of Biotechnology,AC&RI,Madurai- www.tnaugenomics.com
- 41. Ionomics Department of Biotechnology,AC&RI,Madurai- www.tnaugenomics.com
- 42. Thank you
Слайд 1Prof. Senthil Natesan
Department of Biotechnology, AC&RI, Madurai
Bio-Technology……
Genomics platform for
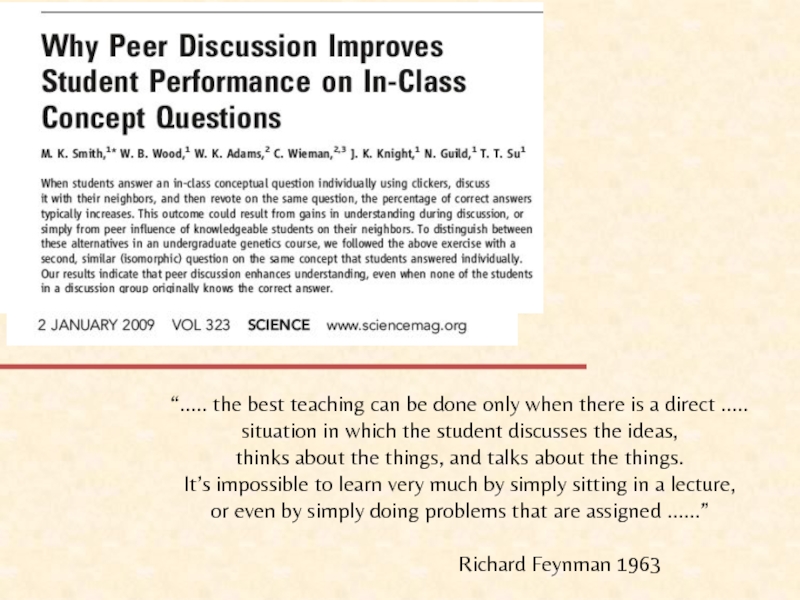
Слайд 2“….. the best teaching can be done only when there is
situation in which the student discusses the ideas,
thinks about the things, and talks about the things.
It’s impossible to learn very much by simply sitting in a lecture,
or even by simply doing problems that are assigned ……”
Richard Feynman 1963
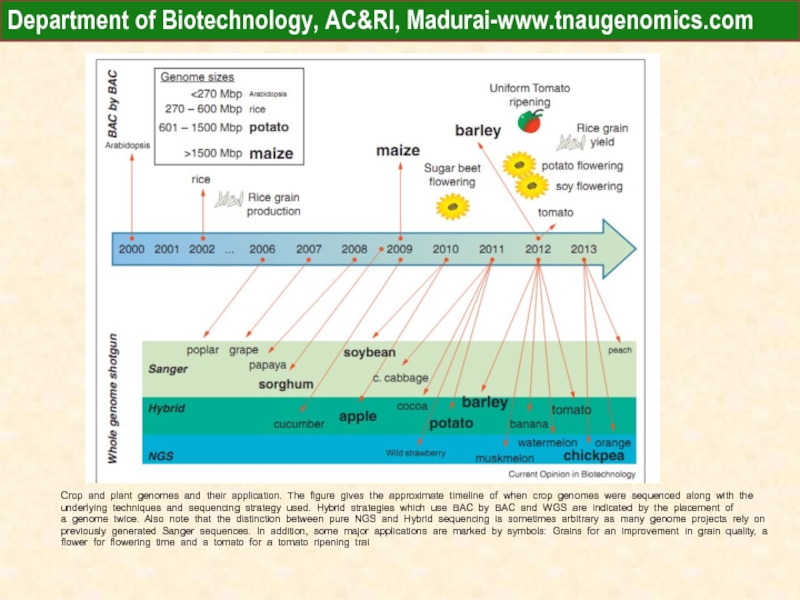
Слайд 4Crop and plant genomes and their application. The figure gives the
underlying techniques and sequencing strategy used. Hybrid strategies which use BAC by BAC and WGS are indicated by the placement of
a genome twice. Also note that the distinction between pure NGS and Hybrid sequencing is sometimes arbitrary as many genome projects rely on
previously generated Sanger sequences. In addition, some major applications are marked by symbols: Grains for an improvement in grain quality, a
flower for flowering time and a tomato for a tomato ripening trai
Department of Biotechnology, AC&RI, Madurai-www.tnaugenomics.com
Слайд 5Examples of the range of phenotypic variation in maize germplasm held
Department of Biotechnology, AC&RI ,Madurai-www.tnaugenomics.com
Слайд 7Humans Have Limited Molecular Diversity
0.09%
Zhao et al, 2000, PNAS
1.34%
Department of
Слайд 8Maize diversity is greater than the difference between human and chimps
Tenallion
Department of Biotechnology,AC&RI,Madurai- www.tnaugenomics.com
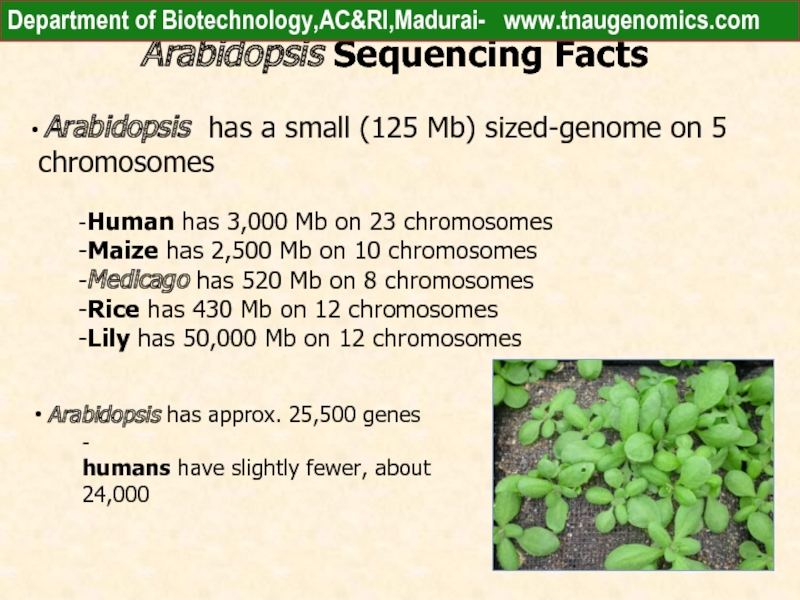
Слайд 9Arabidopsis Sequencing Facts
Arabidopsis has a small (125 Mb) sized-genome on
-Human has 3,000 Mb on 23 chromosomes
-Maize has 2,500 Mb on 10 chromosomes
-Medicago has 520 Mb on 8 chromosomes
-Rice has 430 Mb on 12 chromosomes
-Lily has 50,000 Mb on 12 chromosomes
Arabidopsis has approx. 25,500 genes
-
humans have slightly fewer, about 24,000
Department of Biotechnology,AC&RI,Madurai- www.tnaugenomics.com
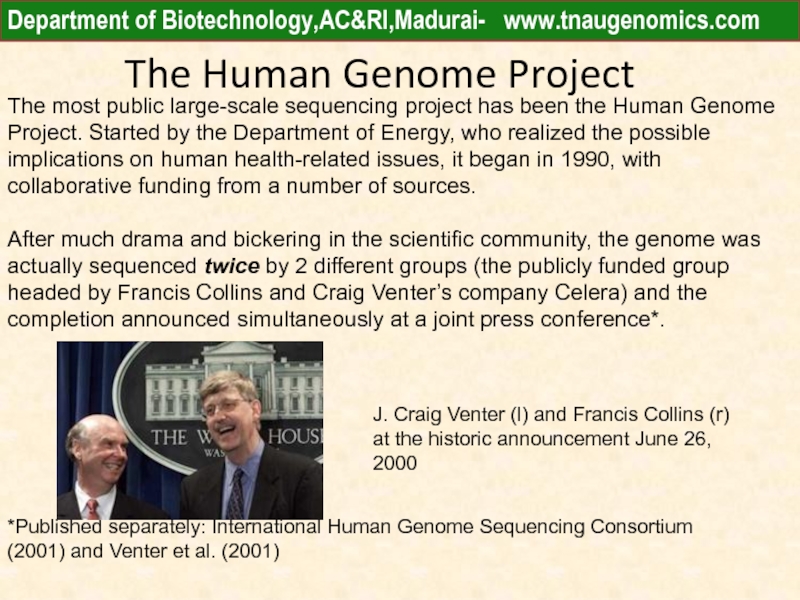
Слайд 10The Human Genome Project
The most public large-scale sequencing project has been
After much drama and bickering in the scientific community, the genome was actually sequenced twice by 2 different groups (the publicly funded group headed by Francis Collins and Craig Venter’s company Celera) and the completion announced simultaneously at a joint press conference*.
*Published separately: International Human Genome Sequencing Consortium (2001) and Venter et al. (2001)
J. Craig Venter (l) and Francis Collins (r) at the historic announcement June 26, 2000
Department of Biotechnology,AC&RI,Madurai- www.tnaugenomics.com
Слайд 11Whole genome sequencing
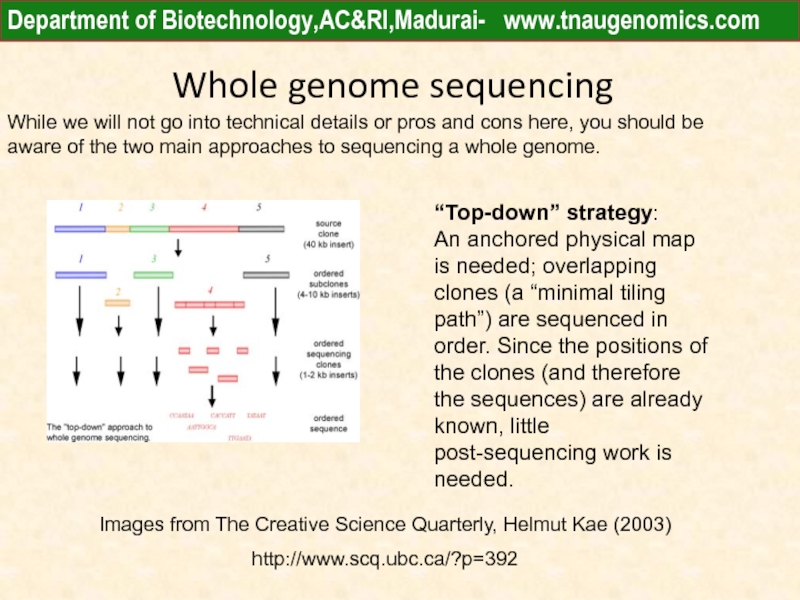
While we will not go into technical details or
“Top-down” strategy:
An anchored physical map is needed; overlapping clones (a “minimal tiling path”) are sequenced in order. Since the positions of the clones (and therefore the sequences) are already known, little post-sequencing work is needed.
Images from The Creative Science Quarterly, Helmut Kae (2003)
http://www.scq.ubc.ca/?p=392
Department of Biotechnology,AC&RI,Madurai- www.tnaugenomics.com
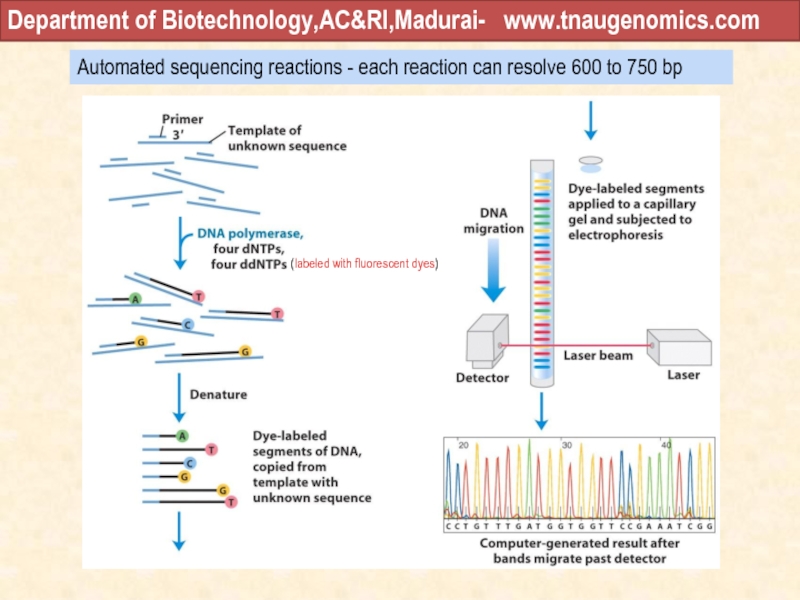
Слайд 12Automated sequencing reactions - each reaction can resolve 600 to 750
(labeled with fluorescent dyes)
Department of Biotechnology,AC&RI,Madurai- www.tnaugenomics.com
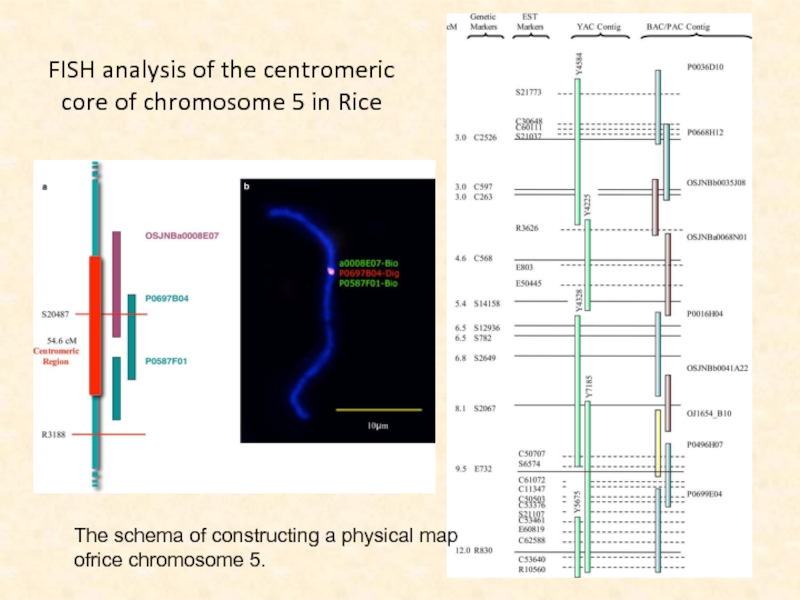
Слайд 13FISH analysis of the centromeric
core of chromosome 5 in Rice
The
Слайд 14Comparing genomes: Example from the grasses
This is now one of the
This consensus comparative map of 7 grasses shows how the genomes can be aligned in terms of “rice linkage blocks” (Gale and Devos 1998). Any radial line starting at rice, the smallest genome and innermost circle, will pass through regions of similar gene content in each of the other species.
Therefore a gene on the chromosome of one grass species can be anticipated to be present in a predicted location on a specific chromosome of a number of other grass family species. This has facilitated much sharing among researchers working on any of these species and others that may be also related (Phillips & Freeling 1998).
Department of Biotechnology,AC&RI,Madurai- www.tnaugenomics.com
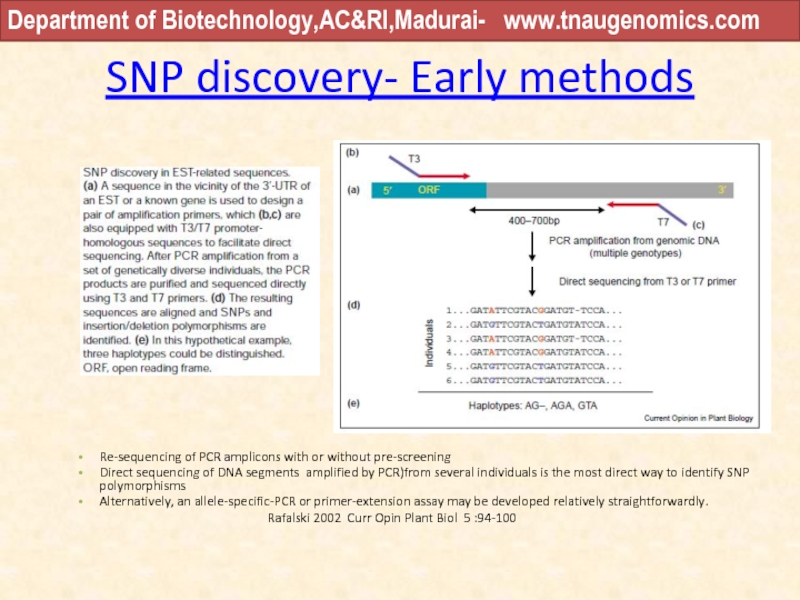
Слайд 15SNP discovery- Early methods
Re-sequencing of PCR amplicons with or without pre-screening
Direct
Alternatively, an allele-specific-PCR or primer-extension assay may be developed relatively straightforwardly.
Rafalski 2002 Curr Opin Plant Biol 5 :94-100
Department of Biotechnology,AC&RI,Madurai- www.tnaugenomics.com
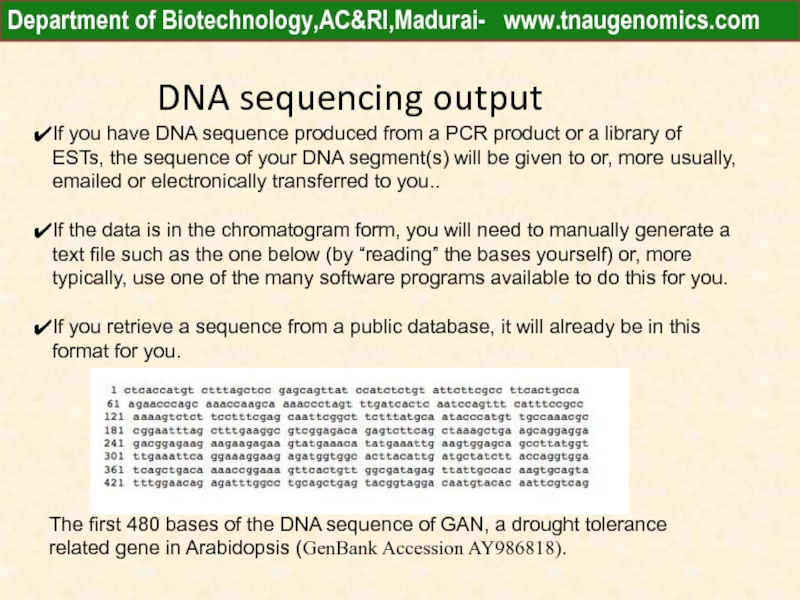
Слайд 16DNA sequencing output
If you have DNA sequence produced from a PCR
If the data is in the chromatogram form, you will need to manually generate a text file such as the one below (by “reading” the bases yourself) or, more typically, use one of the many software programs available to do this for you.
If you retrieve a sequence from a public database, it will already be in this format for you.
The first 480 bases of the DNA sequence of GAN, a drought tolerance related gene in Arabidopsis (GenBank Accession AY986818).
Department of Biotechnology,AC&RI,Madurai- www.tnaugenomics.com
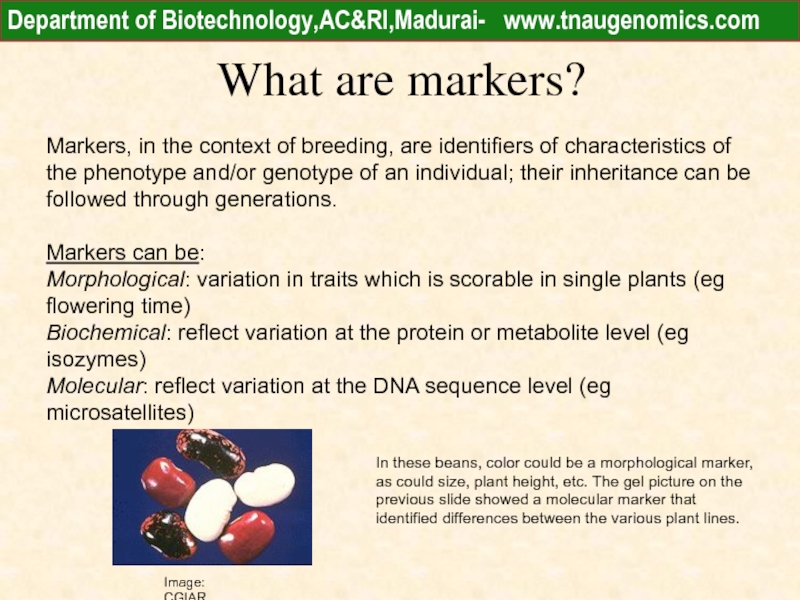
Слайд 17What are markers?
Markers, in the context of breeding, are identifiers
Markers can be:
Morphological: variation in traits which is scorable in single plants (eg flowering time)
Biochemical: reflect variation at the protein or metabolite level (eg isozymes)
Molecular: reflect variation at the DNA sequence level (eg microsatellites)
In these beans, color could be a morphological marker, as could size, plant height, etc. The gel picture on the previous slide showed a molecular marker that identified differences between the various plant lines.
Image: CGIAR
Department of Biotechnology,AC&RI,Madurai- www.tnaugenomics.com
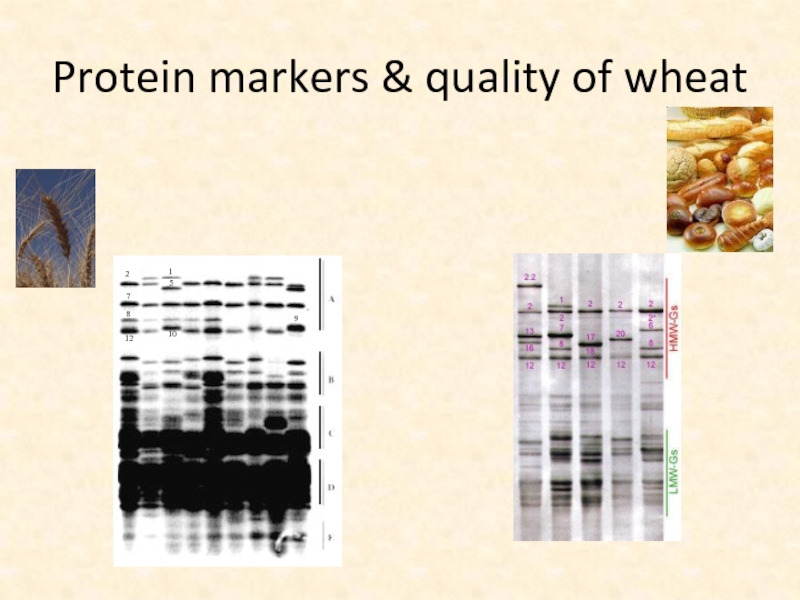
Слайд 18Protein markers & quality of wheat
Department of Biotechnology,AC&RI,Madurai- www.tnaugenomics.com
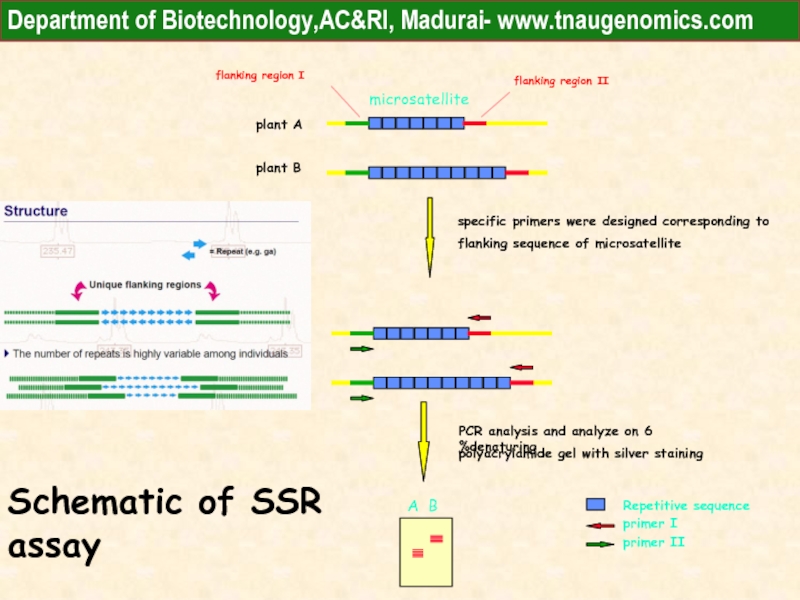
Слайд 19plant A
plant B
microsatellite
plant A
plant B
flanking region
flanking region I
specific primers were designed corresponding to
flanking sequence of microsatellite
PCR analysis and analyze on 6 %denaturing
polyacrylamide gel with silver staining
A B
Schematic of SSR assay
Department of Biotechnology,AC&RI, Madurai- www.tnaugenomics.com
Слайд 22Microsatellite markers polymorphism between parental lines and rice hybrids
Tamilkumar et al.,2009
Department
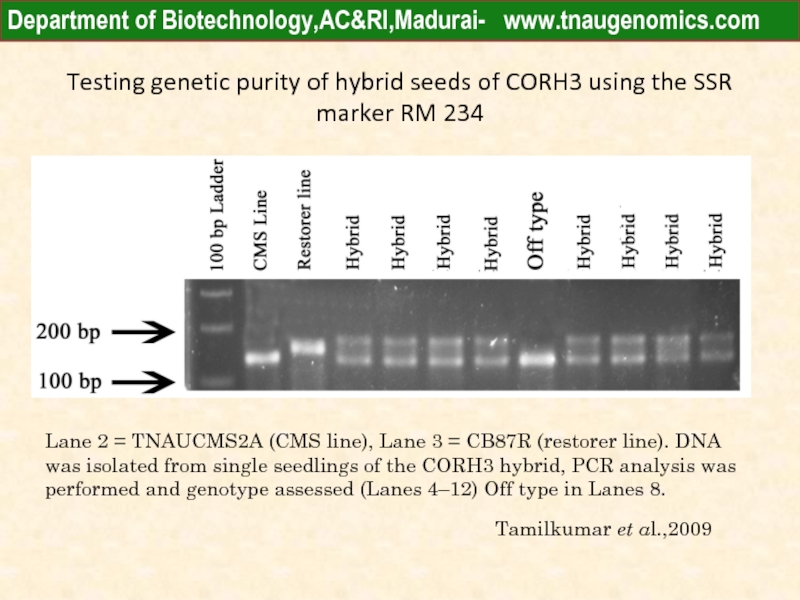
Слайд 24Testing genetic purity of hybrid seeds of CORH3 using the SSR
Lane 2 = TNAUCMS2A (CMS line), Lane 3 = CB87R (restorer line). DNA was isolated from single seedlings of the CORH3 hybrid, PCR analysis was performed and genotype assessed (Lanes 4–12) Off type in Lanes 8.
Tamilkumar et al.,2009
Department of Biotechnology,AC&RI,Madurai- www.tnaugenomics.com
Слайд 25Advantages of MAB: Cost
Depending on the trait and the cost of
Of course, some phenotyping will always be required to confirm results, but MAB can decrease the amount of phenotyping in many situations.
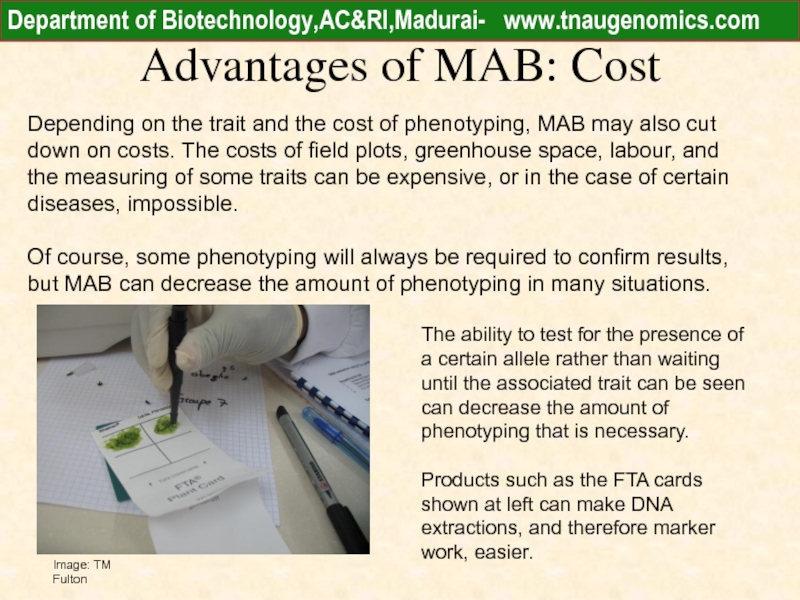
The ability to test for the presence of a certain allele rather than waiting until the associated trait can be seen can decrease the amount of phenotyping that is necessary.
Products such as the FTA cards shown at left can make DNA extractions, and therefore marker work, easier.
Image: TM Fulton
Department of Biotechnology,AC&RI,Madurai- www.tnaugenomics.com
Слайд 26Advantages of MAB: knowledge
Using markers can also give us a deeper
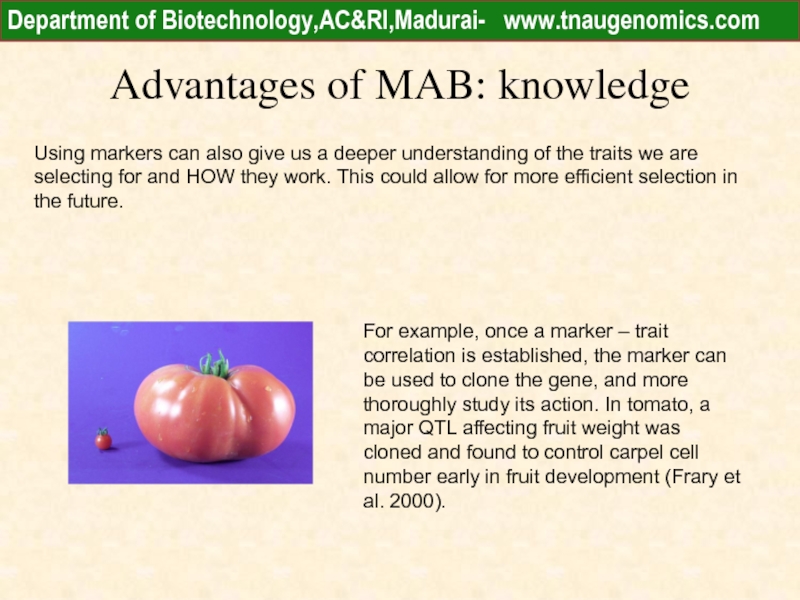
For example, once a marker – trait correlation is established, the marker can be used to clone the gene, and more thoroughly study its action. In tomato, a major QTL affecting fruit weight was cloned and found to control carpel cell number early in fruit development (Frary et al. 2000).
Department of Biotechnology,AC&RI,Madurai- www.tnaugenomics.com
Слайд 27MAB: Costs
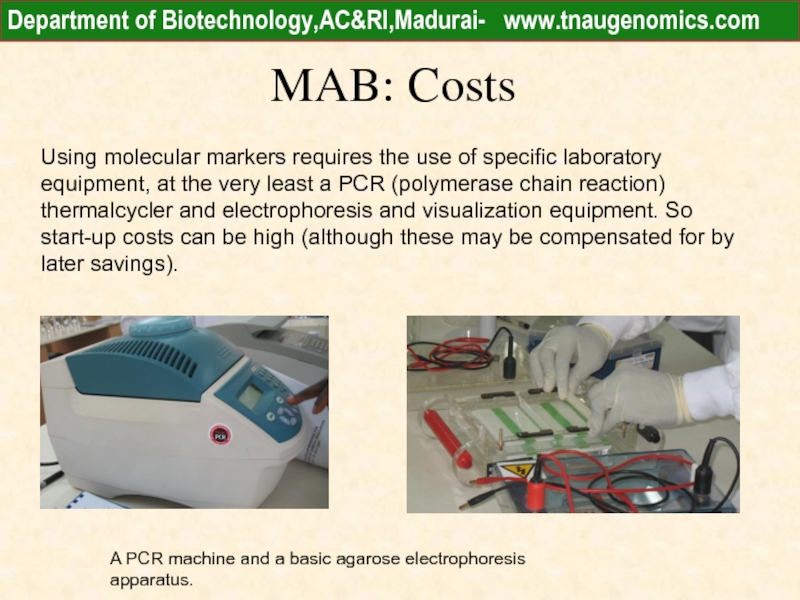
Using molecular markers requires the use of specific laboratory equipment,
A PCR machine and a basic agarose electrophoresis apparatus.
Department of Biotechnology,AC&RI,Madurai- www.tnaugenomics.com
Слайд 28
Crop Domestication:
From plants in the wild to our kitchen
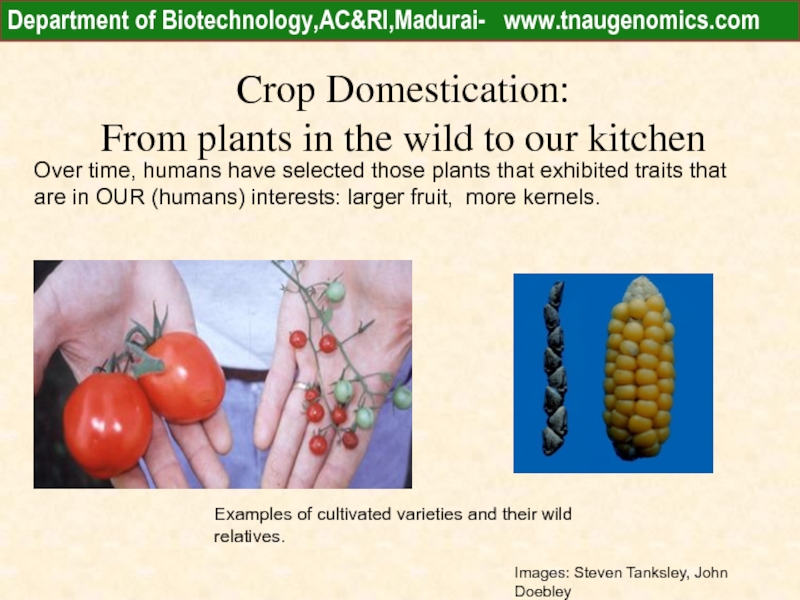
Over time, humans
Examples of cultivated varieties and their wild relatives.
Images: Steven Tanksley, John Doebley
Department of Biotechnology,AC&RI,Madurai- www.tnaugenomics.com
Слайд 29
Crop Domestication
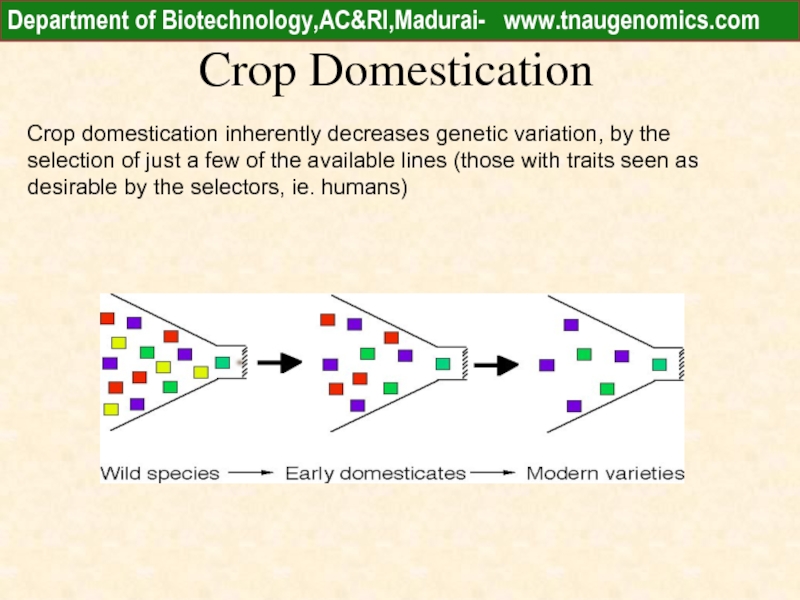
Crop domestication inherently decreases genetic variation, by the selection of
Department of Biotechnology,AC&RI,Madurai- www.tnaugenomics.com
Слайд 30
Traits selected for by humans
Traits that have been selected for by
Determinate growth habit (flowering occurs at the top of the plant, preventing further growth)
Retention of mature seed on the plant (loss of grain shattering)
Synchronous ripening, shorter maturity
Lower content of bitter tasting and harmful compounds
Reduced sprouting, higher seed dormancy
improved harvest index (the proportion of the plant which is used); larger seed or fruit size
elimination of seeds, such as in banana
Many of these trait changes reduce the ability for the plant to compete in the wild, and also decrease the genetic variability remaining in the crop.
Department of Biotechnology,AC&RI,Madurai- www.tnaugenomics.com
Слайд 31
Consequences of loss of genetic diversity:
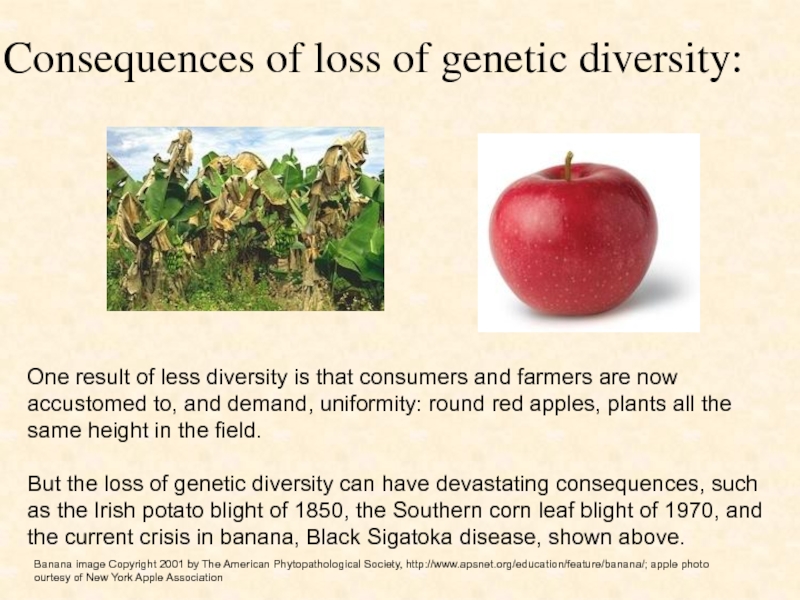
One result of less diversity is
But the loss of genetic diversity can have devastating consequences, such as the Irish potato blight of 1850, the Southern corn leaf blight of 1970, and the current crisis in banana, Black Sigatoka disease, shown above.
Banana image Copyright 2001 by The American Phytopathological Society, http://www.apsnet.org/education/feature/banana/; apple photo ourtesy of New York Apple Association
Слайд 32
Genetic diversity is available in genebanks
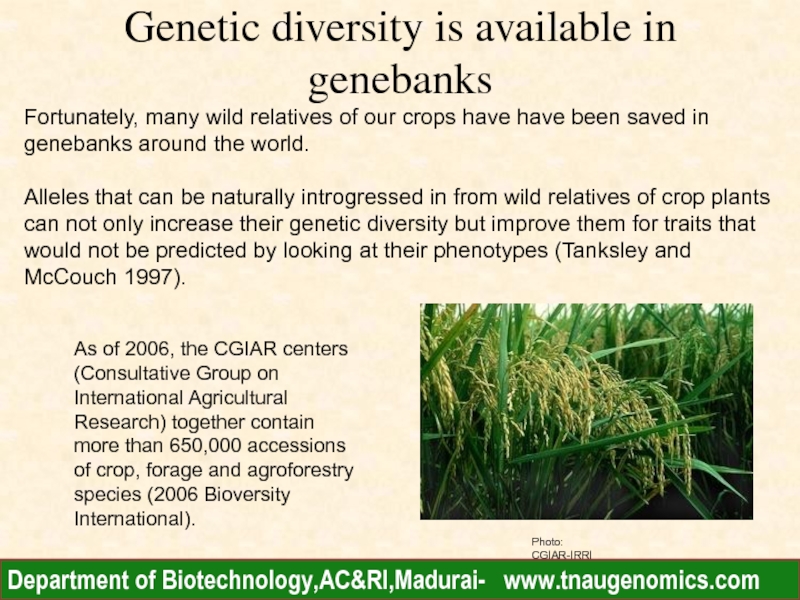
Fortunately, many wild relatives of our
Alleles that can be naturally introgressed in from wild relatives of crop plants can not only increase their genetic diversity but improve them for traits that would not be predicted by looking at their phenotypes (Tanksley and McCouch 1997).
As of 2006, the CGIAR centers (Consultative Group on International Agricultural Research) together contain more than 650,000 accessions of crop, forage and agroforestry species (2006 Bioversity International).
Photo: CGIAR-IRRI
Department of Biotechnology,AC&RI,Madurai- www.tnaugenomics.com
Слайд 33Germplasm banks
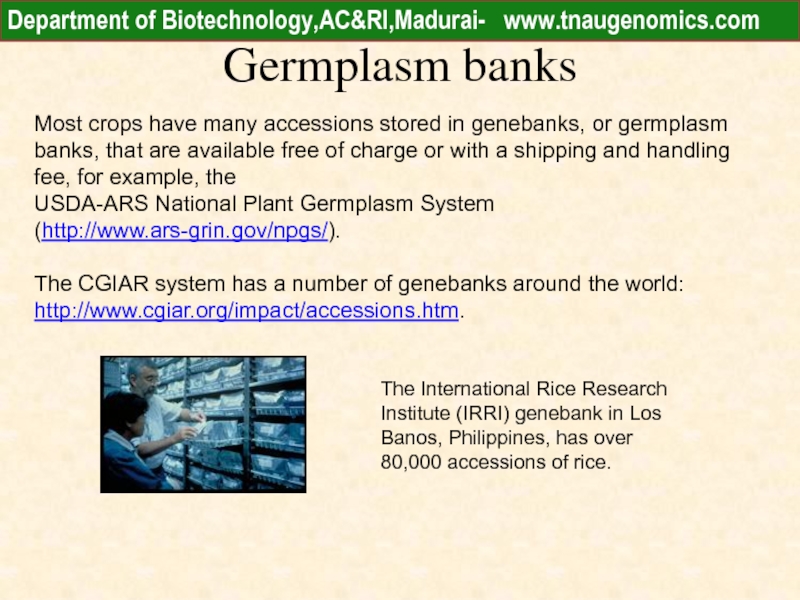
Most crops have many accessions stored in genebanks, or germplasm
USDA-ARS National Plant Germplasm System (http://www.ars-grin.gov/npgs/).
The CGIAR system has a number of genebanks around the world: http://www.cgiar.org/impact/accessions.htm.
The International Rice Research Institute (IRRI) genebank in Los Banos, Philippines, has over 80,000 accessions of rice.
Department of Biotechnology,AC&RI,Madurai- www.tnaugenomics.com
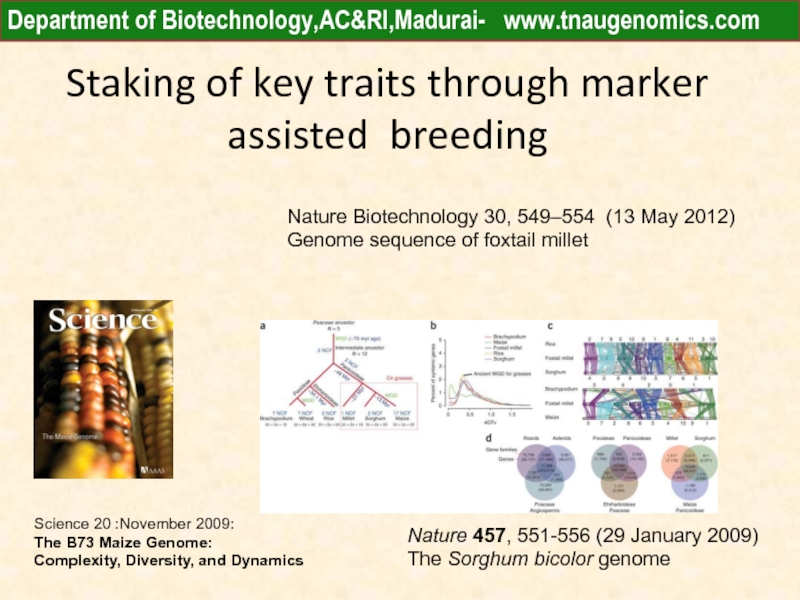
Слайд 34Science 20 :November 2009:
The B73 Maize Genome:
Complexity, Diversity, and Dynamics
Nature 457, 551-556
The Sorghum bicolor genome
Nature Biotechnology 30, 549–554 (13 May 2012)
Genome sequence of foxtail millet
Staking of key traits through marker assisted breeding
Department of Biotechnology,AC&RI,Madurai- www.tnaugenomics.com
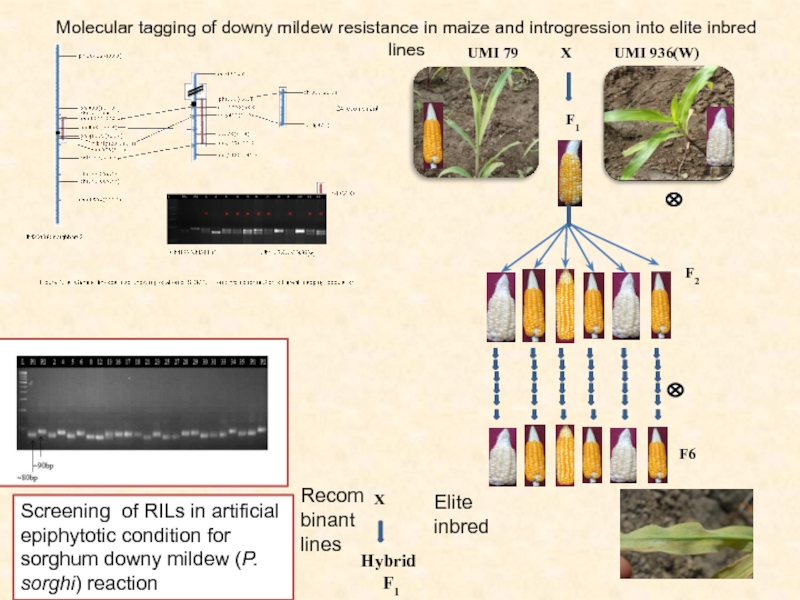
Слайд 35UMI 79
UMI 936(W)
X
F1
F2
F6
Molecular tagging of downy mildew
Screening of RILs in artificial epiphytotic condition for sorghum downy mildew (P. sorghi) reaction
Recombinant lines
X
Elite inbred
Hybrid
F1
Слайд 36Marker assisted introgression of LycE /CrtRB1 gene for enhanced Pro VitA
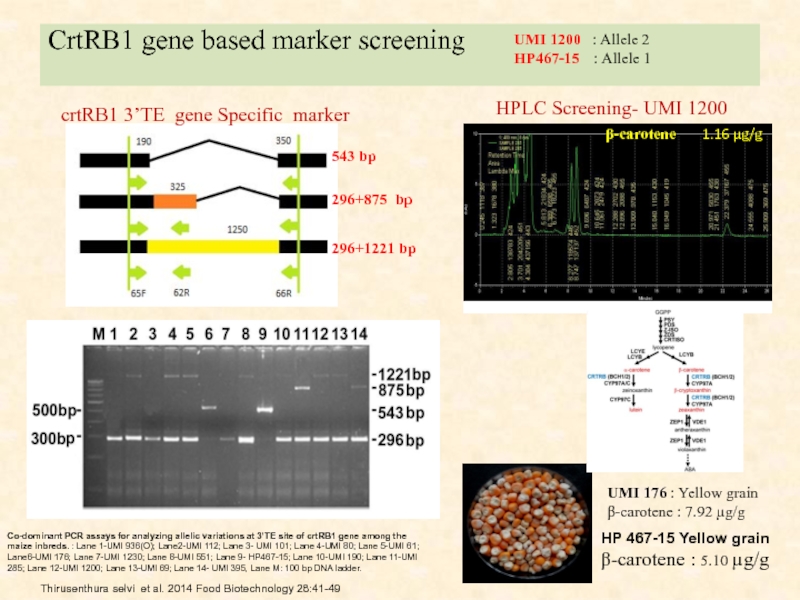
The back cross progenies of UMI 1200 ( 1.16 μg/g β-carotene and popular inbred) x HP467-15 (5.10 μg/g β-carotene and CIMMYT donor) are under evaluation.
HPLC analysis also revealed a considerable improvement in the β-carotene of selected F1 (1.50 μg/g ) and BC1F1 progenies ( 2.2 μg/g) as compared to the well-adapted low β-carotene inbred (UMI 1200).
BC2 F2 progenies
UMI 1200
HP467-15
Слайд 37CrtRB1 gene based marker screening
HPLC Screening- UMI 1200
UMI 1200
HP467-15 : Allele 1
UMI 176 : Yellow grain
β-carotene : 7.92 µg/g
crtRB1 3’TE gene Specific marker
296+875 bp
296+1221 bp
543 bp
HP 467-15 Yellow grain
β-carotene : 5.10 µg/g
Co-dominant PCR assays for analyzing allelic variations at 3’TE site of crtRB1 gene among the maize inbreds. : Lane 1-UMI 936(O); Lane2-UMI 112; Lane 3- UMI 101; Lane 4-UMI 80; Lane 5-UMI 61; Lane6-UMI 176; Lane 7-UMI 1230; Lane 8-UMI 551; Lane 9- HP467-15; Lane 10-UMI 190; Lane 11-UMI 285; Lane 12-UMI 1200; Lane 13-UMI 69; Lane 14- UMI 395, Lane M: 100 bp DNA ladder.
Thirusenthura selvi et al. 2014 Food Biotechnology 28:41-49
