quartiles of a data set.
SSBAT find the interquartile range of a data set.
SSBAT represent data using a box and whisker plot.
Standards: M11.E.2.1.2, M11.E.1.1.2
- Главная
- Разное
- Дизайн
- Бизнес и предпринимательство
- Аналитика
- Образование
- Развлечения
- Красота и здоровье
- Финансы
- Государство
- Путешествия
- Спорт
- Недвижимость
- Армия
- Графика
- Культурология
- Еда и кулинария
- Лингвистика
- Английский язык
- Астрономия
- Алгебра
- Биология
- География
- Детские презентации
- Информатика
- История
- Литература
- Маркетинг
- Математика
- Медицина
- Менеджмент
- Музыка
- МХК
- Немецкий язык
- ОБЖ
- Обществознание
- Окружающий мир
- Педагогика
- Русский язык
- Технология
- Физика
- Философия
- Химия
- Шаблоны, картинки для презентаций
- Экология
- Экономика
- Юриспруденция
Introductory statistics презентация
Содержание
- 1. Introductory statistics
- 2. Fractiles Numbers that partition or divide
- 3. Quartiles Approximately divide a data set
- 4. 2nd Quartile, Q2 The Median of
- 5. 1st Quartile, Q1 The Median of
- 6. 3rd Quartile, Q3 The Median of
- 7. 7 8 10 13
- 8. The Quartiles approximately divide the data into
- 9. Example 1: the test scores of 15
- 10. Example 2: The tuition costs (in thousands
- 11. Interquartile Range (IQR) The difference between
- 12. Find the Interquartile range from Example 1
- 13. Find the Interquartile range from Example 2
- 14. IQR – Interquartile Range (Q3 –
- 15. Take a look at Example 1 ?
- 16. http://www.mathsisfun.com/data/images/box-whisker-plot.gif Box and Whisker Plot Example:
- 17. Box and Whisker Plot A
- 18. Steps for creating a box and whisker
- 19. Examples: Create a Box and Whisker Plot
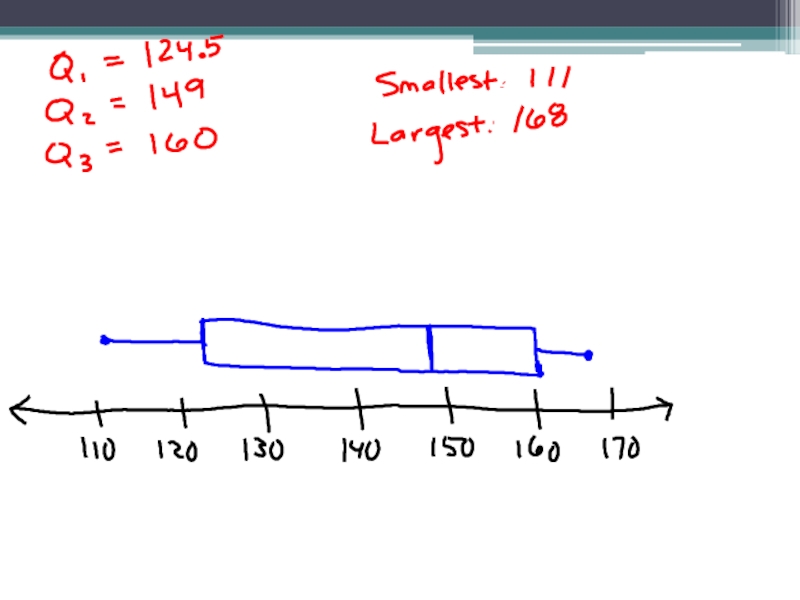
- 21. 2. 111 115 122
- 23. Distribution Shape Based on Box and Whisker
- 24. ? Complete together #11 on page 109

Слайд 2Fractiles
Numbers that partition or divide an ordered data set into equal
parts.
The median of a data set is a fractile
The median of a data set is a fractile

Слайд 3Quartiles
Approximately divide a data set into 4 equal parts
There are 3
quartiles: First, Second, Third

Слайд 42nd Quartile, Q2
The Median of the entire data set
Half the data
entries lie on or below Q2 and the other half lies on or above Q2

Слайд 51st Quartile, Q1
The Median of the Lower half of the data
set (below Q2)
It divides the lower half of the data in half
It divides the lower half of the data in half
It divides")
Слайд 63rd Quartile, Q3
The Median of the Upper half of the data
set (above Q2)
It divides the upper half of the data in half
It divides the upper half of the data in half
It divides")

Слайд 8The Quartiles approximately divide the data into 4 equal parts, therefore
25% of the data is in each part
25% of the data is below Q1
25% of the data is between Q1 and Q2
25% of the data is between Q2 and Q3
25% of the data is above Q3
25% of the data is below Q1
25% of the data is between Q1 and Q2
25% of the data is between Q2 and Q3
25% of the data is above Q3

Слайд 9Example 1: the test scores of 15 employees enrolled in a
CPR training course are listed. Find the first, second, and third quartiles of the test scores.
13 9 18 15 14 21 7 10 11 20 5 18 37 16
1st: Write the numbers in order from least to greatest
5 7 9 10 11 13 14 15 16 18 18 20 21 37
Q2 = 14.5
Q1 = 10
Q3 = 18
13 9 18 15 14 21 7 10 11 20 5 18 37 16
1st: Write the numbers in order from least to greatest
5 7 9 10 11 13 14 15 16 18 18 20 21 37
Q2 = 14.5
Q1 = 10
Q3 = 18

Слайд 10Example 2: The tuition costs (in thousands of dollars) for 11
universities are listed. Find the first, second, and third quartiles.
20, 26, 28, 19, 31, 17, 15, 21, 31, 32, 16
1st: Write the numbers in order from least to greatest
15 16 17 19 20 21 26 28 31 31 32
Q2 = 21
Q1 = 17
Q3 = 31
20, 26, 28, 19, 31, 17, 15, 21, 31, 32, 16
1st: Write the numbers in order from least to greatest
15 16 17 19 20 21 26 28 31 31 32
Q2 = 21
Q1 = 17
Q3 = 31
 for 11 universities are listed. Find")
The difference between the third and first quartiles IQR = Q3 – Q1")


Слайд 14IQR – Interquartile Range (Q3 – Q1)
Gives an idea
of how much the middle 50% of the data varies
It can also be used to identify Outliers
- Any number that is more than 1.5 times the IQR to the left of Q1 or to the right of Q3 is an outlier
It can also be used to identify Outliers
- Any number that is more than 1.5 times the IQR to the left of Q1 or to the right of Q3 is an outlier
 Gives an idea of how much the middle")
Слайд 15Take a look at Example 1 ? The IQR is
8
5 7 9 10 11 13 14 15 16 18 18 20 21 37
Q2 = 14.5 Q1 = 10 Q3 = 18
Check for Outliers: Multiply 1.5 times the IQR
(1.5)(8) = 12
Add 12 to Q3 ? 30
Any number greater than 30 in the set is an outlier ? therefore 37 is an outlier
Subtract 12 from Q1 ? -2
Any number less than -2 is an outlier ? there are none


Слайд 17Box and Whisker Plot
A graph that shows the Median (Q2), Quartile
1, Quartile 3, the lowest number in the set and the highest number in the set
About 25% of the data set is in each section
About 25% of the data set is in each section
25%
25%
25%
25%
, Quartile 1, Quartile 3, the")
Слайд 18Steps for creating a box and whisker plot
Find the Median
(Q2) of all the numbers
Find Quartile 1 and Quartile 3
Identify the smallest and largest number in the set
Make a number line that spans all of the numbers in the set
Above the number line, Create a box using Q1 and Q3 and draw a vertical line through the box at Q2
Draw whiskers on each side of box to the smallest and largest value in the set – Put a dot at both of these endpoints
 of all the")
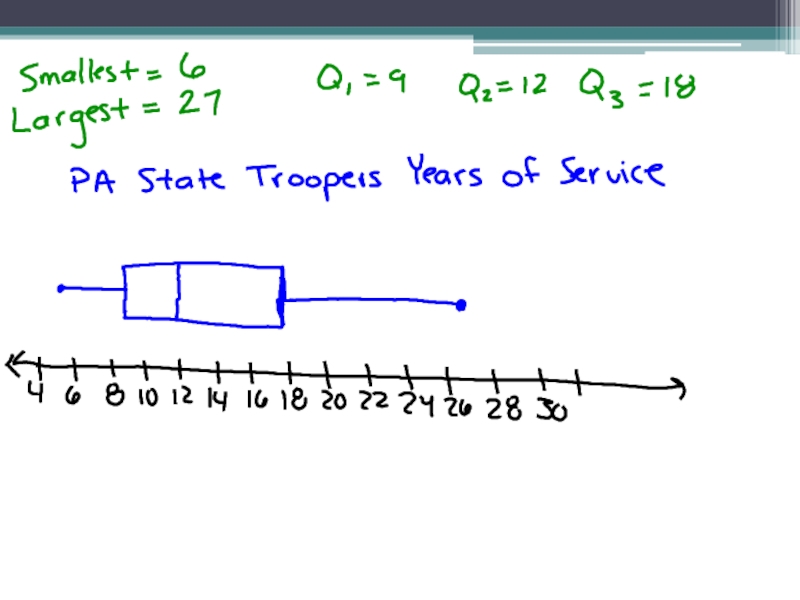
Слайд 19Examples: Create a Box and Whisker Plot for each.
1.
Years of service of a sample of PA state troopers
12 7 9 18 9 12 11 13
6 13 20 27 15 11 23
12 7 9 18 9 12 11 13
6 13 20 27 15 11 23


Слайд 23Distribution Shape Based on Box and Whisker Plot
If the median is
near the center of the box and each whisker is approximately the same length, the distribution is roughly Symmetric.
If median is to the left of center of the box or right whisker is substantially longer than the left, the distribution is Skewed Right.
If median is to the right of center of the box or the left whisker is substantially longer than the right, the distribution is Skewed Left.
If median is to the left of center of the box or right whisker is substantially longer than the left, the distribution is Skewed Right.
If median is to the right of center of the box or the left whisker is substantially longer than the right, the distribution is Skewed Left.