Empirical rule - Probabilities. Week 5 (1) презентация

Interpretation of summary statistics A random sample of people attended a recent soccer match. The summary statistics (Excel output) about their ages is here below:

Слайд 1BBA182 Applied Statistics Week 5 (1) Empirical rule - Probabilities
DR SUSANNE HANSEN

SARAL
EMAIL: SUSANNE.SARAL@OKAN.EDU.TR
HTTPS://PIAZZA.COM/CLASS/IXRJ5MMOX1U2T8?CID=4#
WWW.KHANACADEMY.ORG

DR SUSANNE HANSEN SARAL


Слайд 2 Interpretation of summary statistics A random sample

of people attended a recent soccer match. The summary statistics (Excel output) about their ages is here below:

What is the sample size?
What is the mean age?
What is the median?
What shape does the distribution of ages
have? (symmetric or non-symmetric)
What is the measure/s for spread in the data?
Is this a large spread?
What is the Coefficient of variation for
this data?


Слайд 3 Deviations from the normal distribution - Kurtosis
A distribution with positive kurtosis

is pointy and a distribution with a negative kurtosis is flatter than a normal distribution

DR SUSANNE HANSEN SARAL, SUSANNE.SARAL@GMAIL.COM


Слайд 4 Positively and negatively skewed


Positive

skewed is when the distribution is skewed to the right

Negative skewed is when the distribution is skewed to the left

Слайд 5 Symmetric distribution - Empirical rule

Knowing

the mean and the standard deviation of a data set we can extract a lot of information about the location of our data.

The information depends on the shape of the histogram (symmetric, skewed, etc.).

If the histogram is symmetric or bell-shaped, we can use the Empirical rule.


DR SUSANNE HANSEN SARAL, SUSANNE.SARAL@OKAN.EDU.TR


Слайд 6 Probability as Area Under

the Curve

DR SUSANNE HANSEN SARAL

Ch. 5-


f(X)


X

μ

0.5

0.5

The total area under the curve is 1.0, and the curve is symmetric, so half (50%) of the data in the data set is above the mean, half (50%) is below


Слайд 7If the data distribution is symmetric/normal, then the interval:
contains about 68%

of the values in the population or the sample

DR SUSANNE HANSEN SARAL, SUSANNE.SARAL@OKAN.EDU.TR

The Empirical Rule


68%


Слайд 8
contains about 95% of the values in the population

or the sample

contains almost all (about 99.7%) of the values in the population
or the sample

DR SUSANNE HANSEN SARAL, SUSANNE.SARAL@OKAN.EDU.TR


The Empirical Rule


99.7%

95%

(continued)


Слайд 9 Empirical rule: Application

A company produces batteries with a mean lifetime

of 1’200 hours and a standard deviation of 50 hours.

Find the interval for (what values fall into the following interval?):


DR SUSANNE HANSEN SARAL, SUSANNE.SARAL@OKAN.EDU.TR


Слайд 10 Empirical rule: Application
 
DR SUSANNE HANSEN SARAL, SUSANNE.SARAL@OKAN.EDU.TR


Слайд 11 Interpretation of the Empirical rule: Lightbulb lifetime example

If the shape of

the distribution is normal, then we can conclude :
That approximately 68% of the batteries will last between 1’150 and 1’250 hours

That approximately 95% of the batteries will last between 1’100 and 1’300 hours and

That 99.7% (almost all batteries) will last between 1’050 and 1’350 hours.
It would be very unusual for a battery to loose it’s energy in ex. 600 hours or 1’600 hours. Such values are possible, but not very likely. Their lifetimes would be considered to be outliers

DR SUSANNE HANSEN SARAL, SUSANNE.SARAL@OKAN.EDU.TR


Слайд 12 Empirical rule exercise


Слайд 13

Class quizz


Empirical rule:
(1) Which shape must the distribution have to be able to apply the Empirical rule?

(2) Which two parameters give information about the shape of a distribution?

(3) What percent approximately of the values in a normal distribution are within one standard deviation above and below the mean ?


Слайд 14 Introduction to Probabilities

DR SUSANNE HANSEN SARAL


Слайд 15 Probability theory

“Life would be simpler if

we knew for certain what was going to happen in the future”

B. Render, R. Stair, Jr. M. Hanna & T. Hale, Quantitative Analysis for Management, 2015

However, risk and uncertainty is a part of our lives

Слайд 16 Definition of probability


Probability is

a numerical measure about the likelihood that an event will occur.

2/28/2017


Слайд 17 Probability

and time


Time

Certainty Uncertainty

Certainty runs over a short period of time and gradually decreases as the time horizon becomes more distant and uncertain.


Слайд 18 Probability and its measures: 2 basic rules
Rule 1:
Probability is measured

over a range from 1 to 0 ( 0 – 100%)

Probability – the chance that an uncertain event will occur (tossing a coin)

0 ≤ P(A) ≤ 1 For any event A

Certain

uncertainty

.5

1

0


Dr Susanne Hansen Saral


RISK


Слайд 19 Probability and its measures

2 basic rules


Certain

uncertainty

.5

1

0


Dr Susanne Hansen Saral


Слайд 20 Probability rule 1 and 2

applied - example

Rule 1:
Probability is measured over a range
from 1 to 0 ( 0 – 100%)


Слайд 21 Probability and definitions


Random

experiment

Sample space

Sample point

Event


2/28/2017


Слайд 22 Random experiment

In statistics a random experiment is a process

that generates two or more possible, well defined outcomes. However, we do not know which of the outcomes will occur next.

Examples: Experimental outcomes:
Tossing a coin Head, tail
Throwing a die 1, 2, 3, 4, 5, 6
The outcome of a football match win – lose - equalize – game cancelled

2/28/2017


Слайд 23 All possible experimental outcomes

constitute the sample space


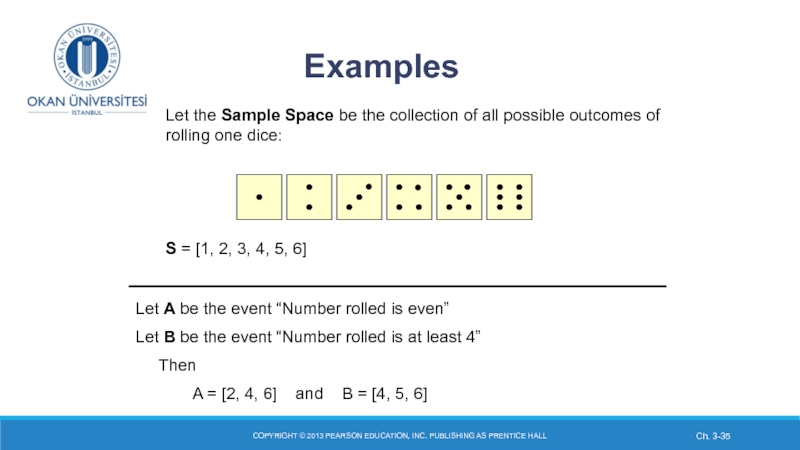
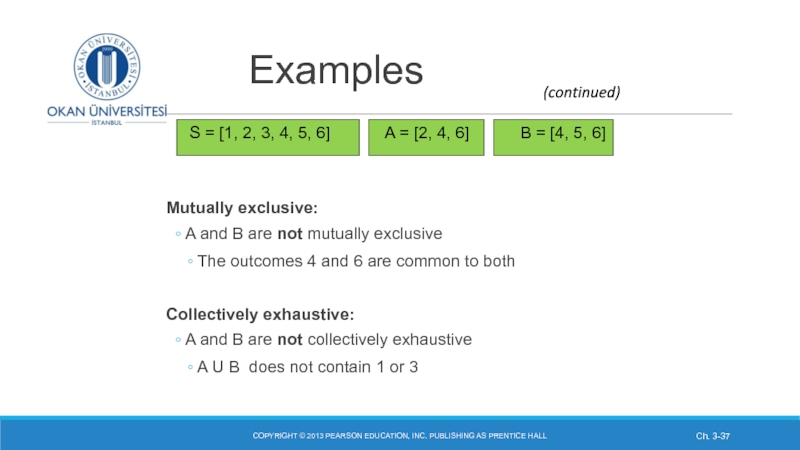
A sample space (S) of an experiment is a list of all possible outcomes.

The outcomes must be collectively exhaustive and mutually exclusive.


2/28/2017


Слайд 24 Sample space, S - Examples
Random experiment: Flip a coin
Possible

outcomes: Head or tail
The sample space: S= {head, tail}

There are no other possible outcomes, therefore they are collectively exhaustive.
When head occurs, tail cannot occur – meaning the outcomes are mutually exclusive.

The sample points in this example are head and tail.

DR SUSANNE HANSEN SARAL


Слайд 25 Sample space, S - Examples

Outcomes of a statistics course:
The

sample space: S = {AA, BA, BB, CB, CC, DC, DD, FD, FF, VF)}.
There are no other possible outcomes, therefore they are collectively exhaustive.

When one of the outcomes occur, no other outcome can occur, therefore they are mutually exclusive.

The sample points are the individual outcomes of the sample space, S = {AA, BA, BB, CB, CC, DC, DD, FD, FF, VF}.

DR SUSANNE HANSEN SARAL


Слайд 26 Sample space -

example

The sample space, S = { Google, direct, Yahoo, MSN and all other}


Mutually exclusive: When a person visits Google it can not visit Yahoo at the same time
Collectively exhaustive: There are no other possible search engines
Sample points: Google, Direct, Yahoo, MSN, all others


Слайд 27 Event


An individual outcome of a sample space is called

a simple event.

An event is a collection or set of one or more simple events in a sample space.


2/28/2017


Слайд 28 Event: – subset of outcomes of a sample space, S

Random

experiment: Throw a dice (Turkish: zar).
Possible outcomes, sample space, S is: {1, 2, 3, 4, 5, 6}

We can define the event “toss only even numbers”. Let A be the event «toss only
even numbers»:

We use the letter A to denote the event: A: {2, 4, 6}

If the experimental outcome are 2, 4, or 6, we would say that the
event A has occurred.

2/28/2017


Слайд 29 Event :

Subset of outcomes of a sample space, S


Random experiment: Grade marks on an exam
Possible outcomes (Sample space): Numbers between 0 and 100

We can define an event, «achieve an A», as the set of numbers that
lie between 80 and 100. Let A be the event «achieve an A»:

A = (80, 81, 82 …….98, 99,100)

If the outcome is a number between 80 and 100, we would say that the event A has occurred.

2/28/2017


Слайд 30 Events
Intersection of Events – If A and B are two

events in a sample space S, then the intersection, A ∩ B, is the set of all outcomes in S that belong to both A and B. We also call this a joint event.

They are not mutually exclusive since they have values in common

COPYRIGHT © 2013 PEARSON EDUCATION, INC. PUBLISHING AS PRENTICE HALL

Ch. 3-

(continued)


A

B

A∩B

S


Слайд 31 Union of events
Union of Events – If A and B are

two events in a sample space S, then the union, A U B, is the set of all outcomes in S that belong to at least one of the two events. Therefore the union of A U B occurs if and only if either A or B or both occur.

COPYRIGHT © 2013 PEARSON EDUCATION, INC. PUBLISHING AS PRENTICE HALL

Ch. 3-

(continued)


A

B

The entire shaded area represents
A U B

S


Слайд 32 Mutually exclusive event
A and B are Mutually Exclusive Events if

they have no basic outcomes in common
i.e., the set A ∩ B is empty, indicating that A ∩ B have no values
in common


Example: Tossing a coin: A is the event of tossing a head. B is the event of tossing a tail. They cannot occur at the same time.

COPYRIGHT © 2013 PEARSON EDUCATION, INC. PUBLISHING AS PRENTICE HALL

Ch. 3-

(continued)


A

B

S


Слайд 38 Class exercise
 
DR SUSANNE HANSEN SARAL


Слайд 39 Class exercise
 
DR SUSANNE HANSEN SARAL


Обратная связь

Если не удалось найти и скачать презентацию, Вы можете заказать его на нашем сайте. Мы постараемся найти нужный Вам материал и отправим по электронной почте. Не стесняйтесь обращаться к нам, если у вас возникли вопросы или пожелания:

Email: Нажмите что бы посмотреть 

Что такое ThePresentation.ru?

Это сайт презентаций, докладов, проектов, шаблонов в формате PowerPoint. Мы помогаем школьникам, студентам, учителям, преподавателям хранить и обмениваться учебными материалами с другими пользователями.


Для правообладателей

Яндекс.Метрика