- Главная
- Разное
- Дизайн
- Бизнес и предпринимательство
- Аналитика
- Образование
- Развлечения
- Красота и здоровье
- Финансы
- Государство
- Путешествия
- Спорт
- Недвижимость
- Армия
- Графика
- Культурология
- Еда и кулинария
- Лингвистика
- Английский язык
- Астрономия
- Алгебра
- Биология
- География
- Детские презентации
- Информатика
- История
- Литература
- Маркетинг
- Математика
- Медицина
- Менеджмент
- Музыка
- МХК
- Немецкий язык
- ОБЖ
- Обществознание
- Окружающий мир
- Педагогика
- Русский язык
- Технология
- Физика
- Философия
- Химия
- Шаблоны, картинки для презентаций
- Экология
- Экономика
- Юриспруденция
Java Troubleshooting and Diagnostic презентация
Содержание
- 1. Java Troubleshooting and Diagnostic
- 2. Dealing with Errors User input errors: In
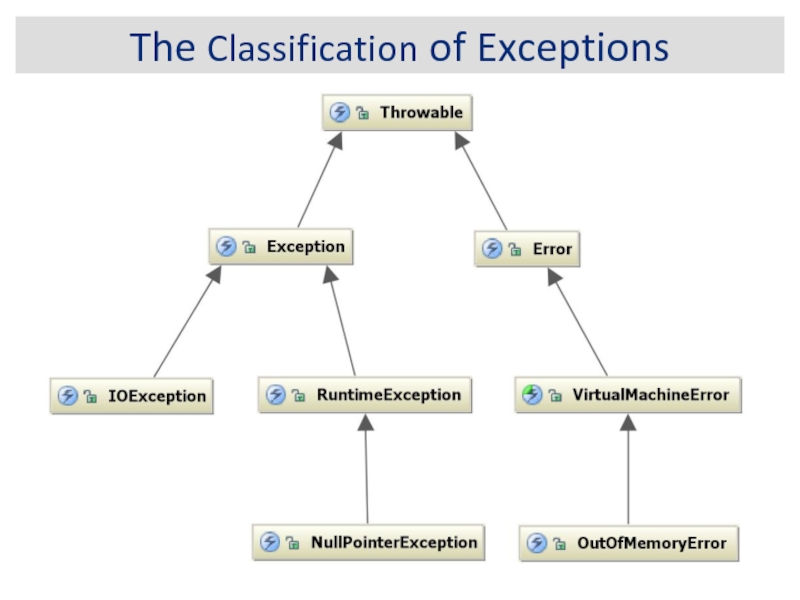
- 3. The Classification of Exceptions
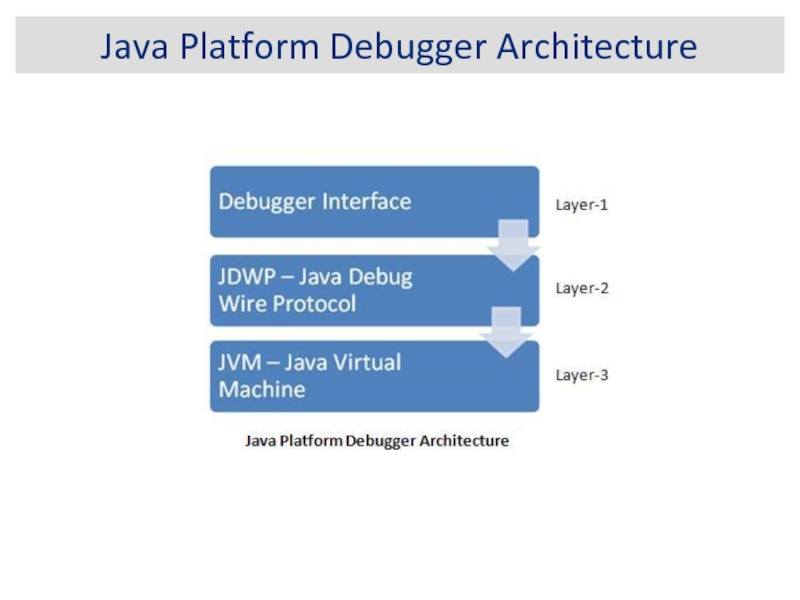
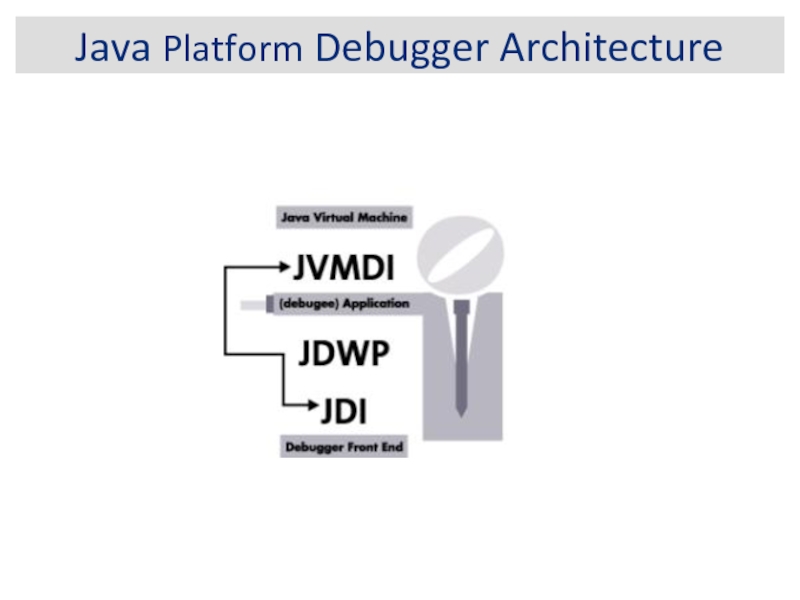
- 4. Java Platform Debugger Architecture
- 5. JVM Debug Parameters Modern JVMs -agentlib:jdwp=transport=dt_socket,server=y,suspend=n,address=5005
- 6. Java Platform Debugger Architecture
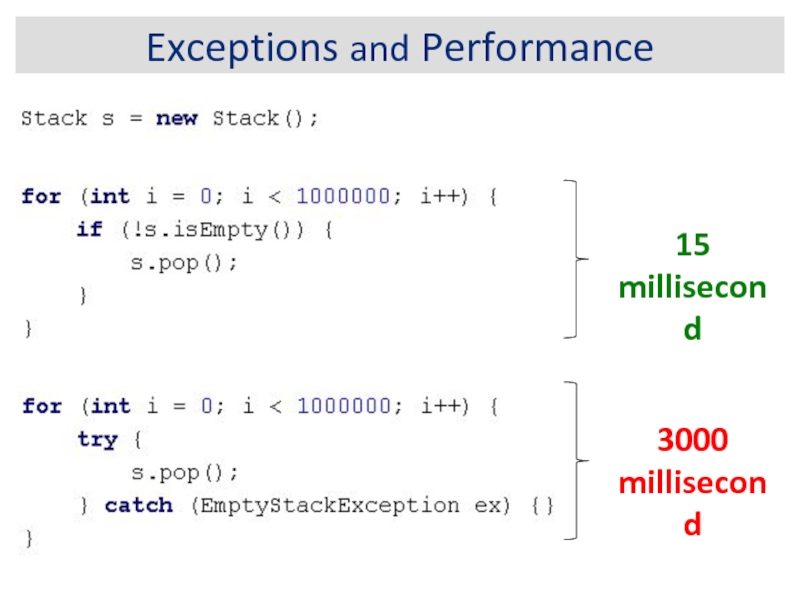
- 7. Exceptions and Performance 15 millisecond 3000 millisecond
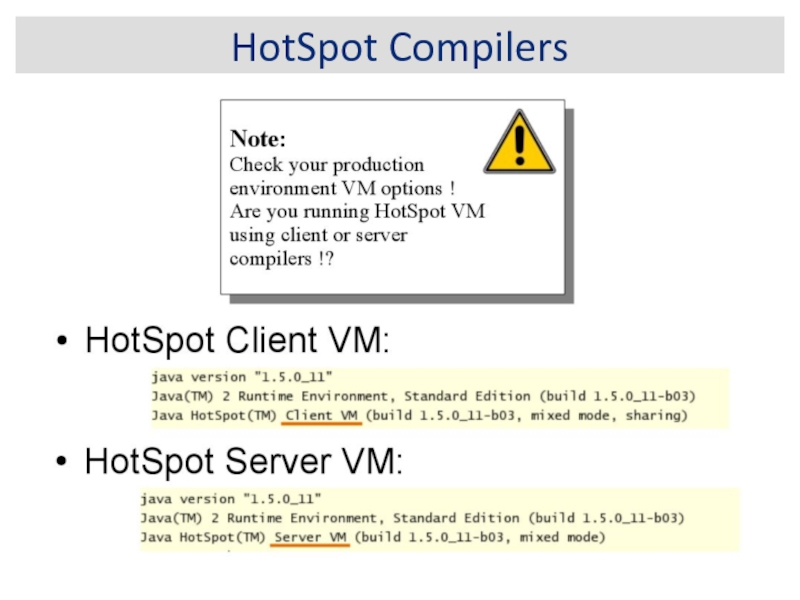
- 8. HotSpot Compilers
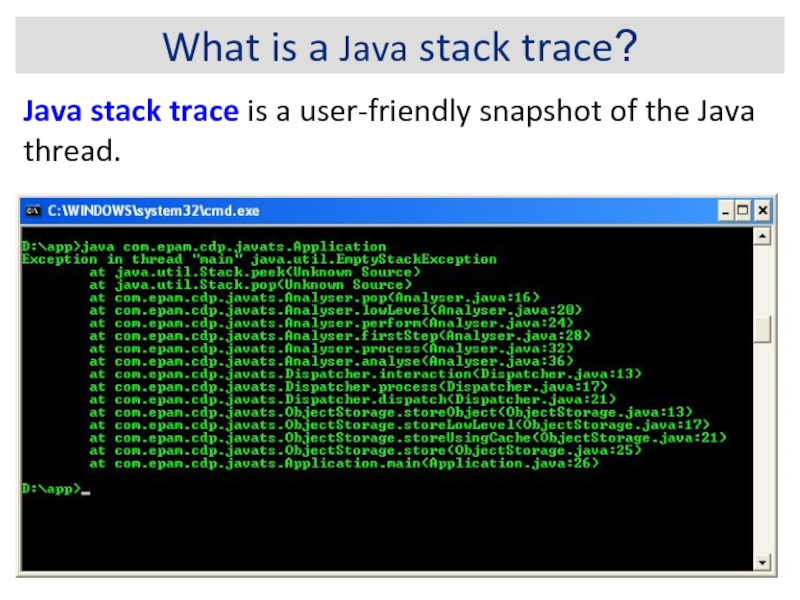
- 9. What is a Java stack trace? Java
- 10. Java Bytecode Debugging Information
- 11. Thread Count (Default Configuration)
- 12. Deadlock
- 13. Expert’s Checklist For hanging, deadlocked or frozen
- 14. Where Is My Stacktrace?
- 15. How is Java Thread Dump Generated?
- 16. Thread Dump By Sending a Signal to
- 17. Thread Dump Using JDK 5/6 tools jstack jps
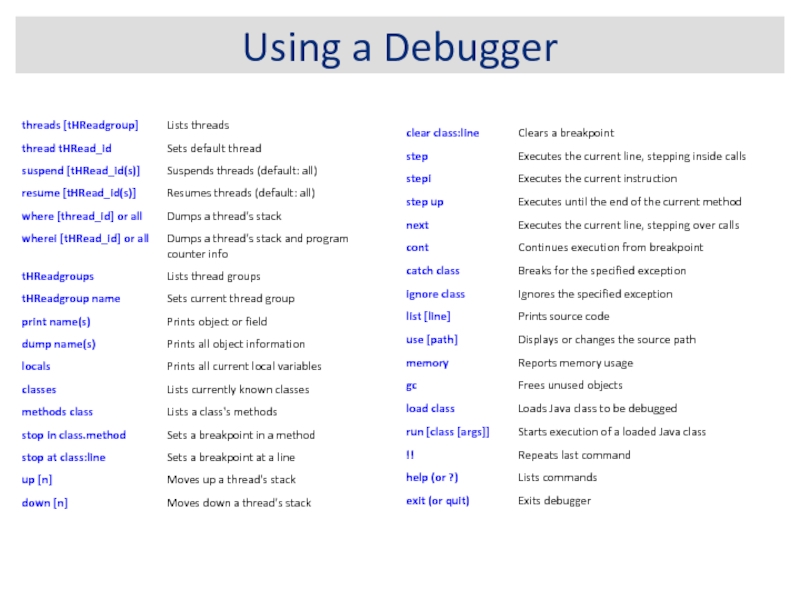
- 18. Thread Dump Using Debugging Tools suspend all
- 19. Using a Debugger
- 20. Using Java API calls Throwable.printStackTrace()
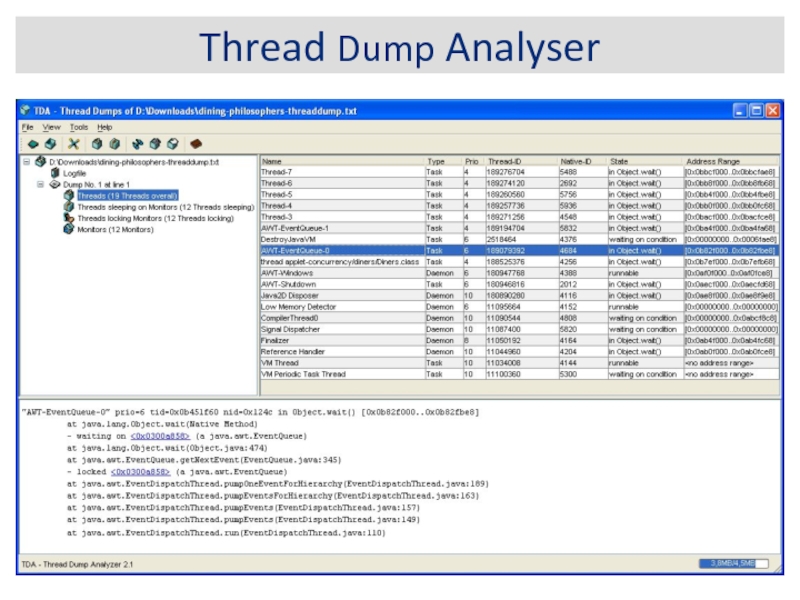
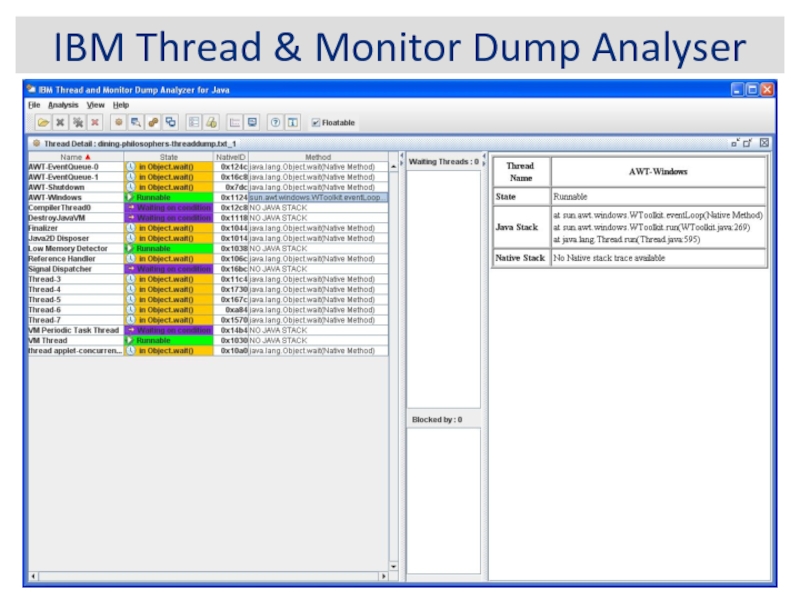
- 21. Thread Dump Analyser
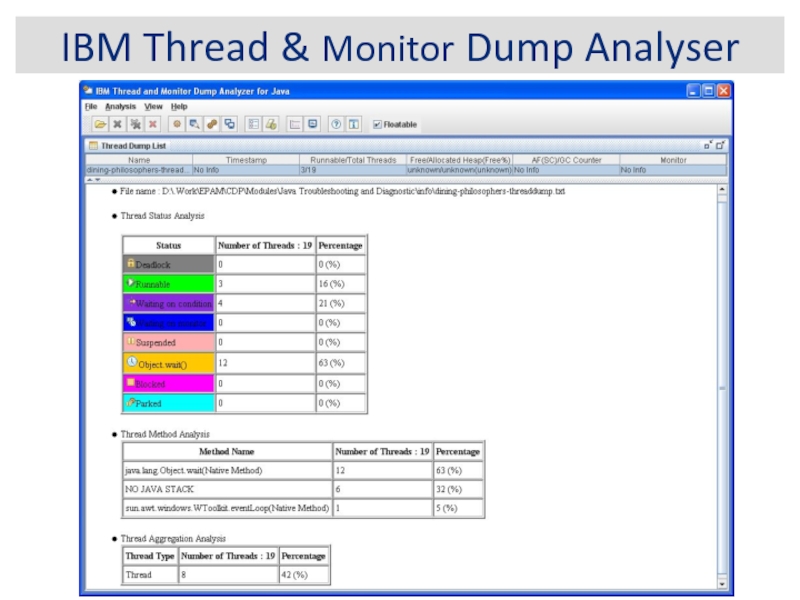
- 22. IBM Thread & Monitor Dump Analyser
- 23. IBM Thread & Monitor Dump Analyser
- 24. Determining the Thread States
- 25. Thread States
- 26. Thread States
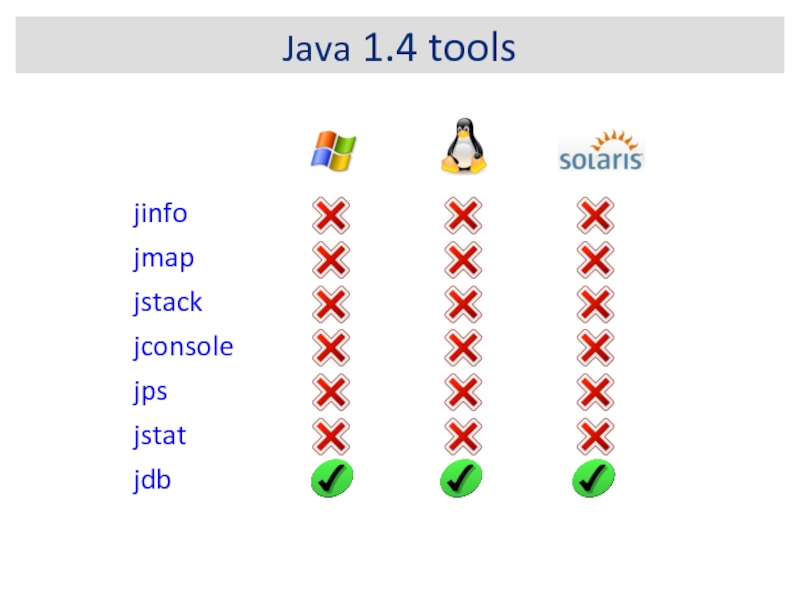
- 27. Java 1.4 tools
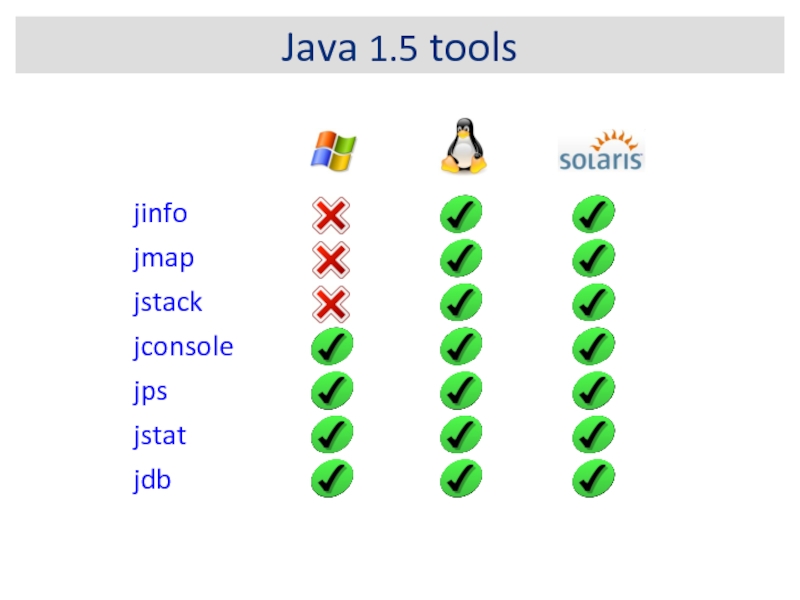
- 28. Java 1.5 tools
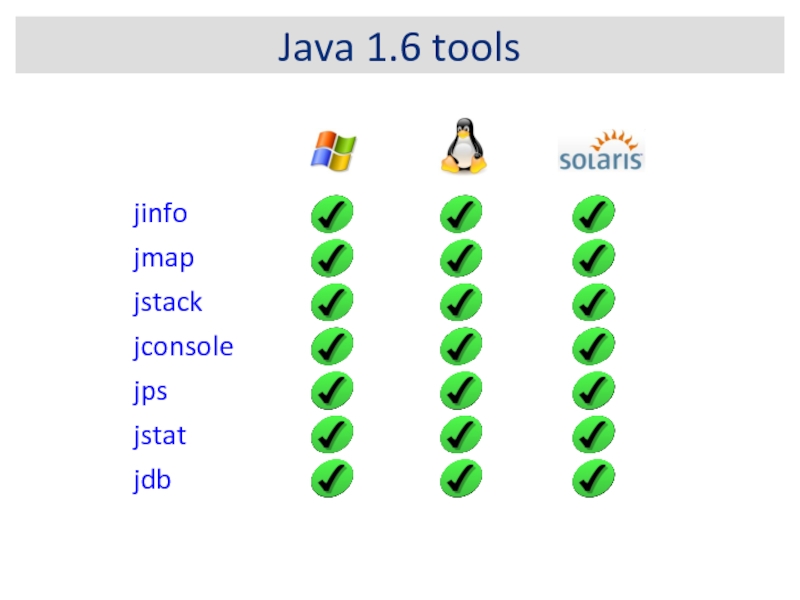
- 29. Java 1.6 tools
- 30. Debugging Performance Issues (1) Symptom: High CPU
- 31. Debugging Performance Issues (2) Symptom: Low CPU
- 32. Debugging Performance Issues (3) Symptom: Medium/Low CPU
- 33. Debugging Performance Issues (4) Symptom: Medium/Low CPU
- 34. Example 1: Deadlock org.apache.log4j.Category.callAppenders():
- 35. Example 2: Performance Issue ... at org.apache.tools.ant.DirectoryScanner.scandir(DirectoryScanner.java:1019)
- 36. JVM Memory Structure Eden Space
- 37. Allocated and Used Memory
- 38. Java Heap Memory & Tuning Options
- 39. Heap Dump Typical information which can be
- 40. Shallow vs. Retained Heap Shallow heap is
- 41. Shallow vs. Retained Heap
- 42. Shallow and retained sizes
- 43. Dominator Tree An object x dominates an
- 44. Garbage Collection Roots
- 45. Garbage Collection Roots System Class
- 46. Garbage Collection Roots Class Thread
- 47. How is Java Heap Dump Generated?
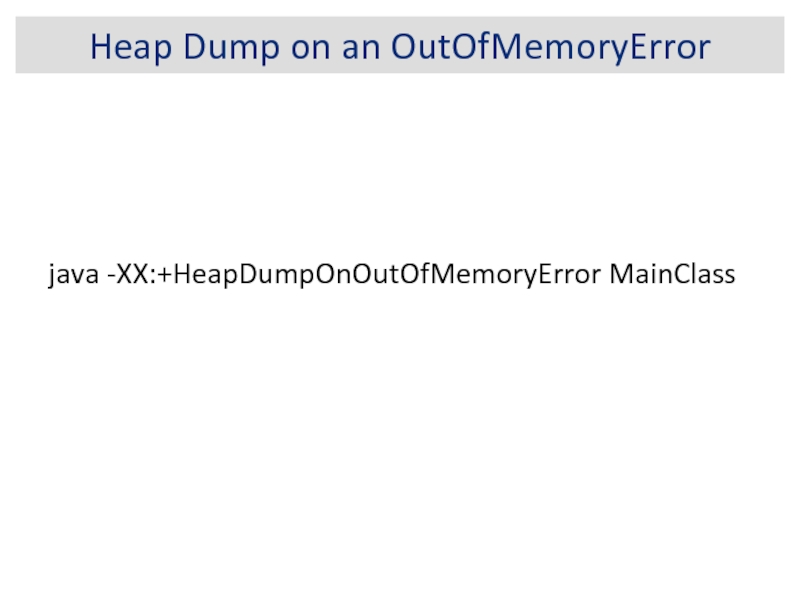
- 48. Heap Dump on an OutOfMemoryError java -XX:+HeapDumpOnOutOfMemoryError MainClass
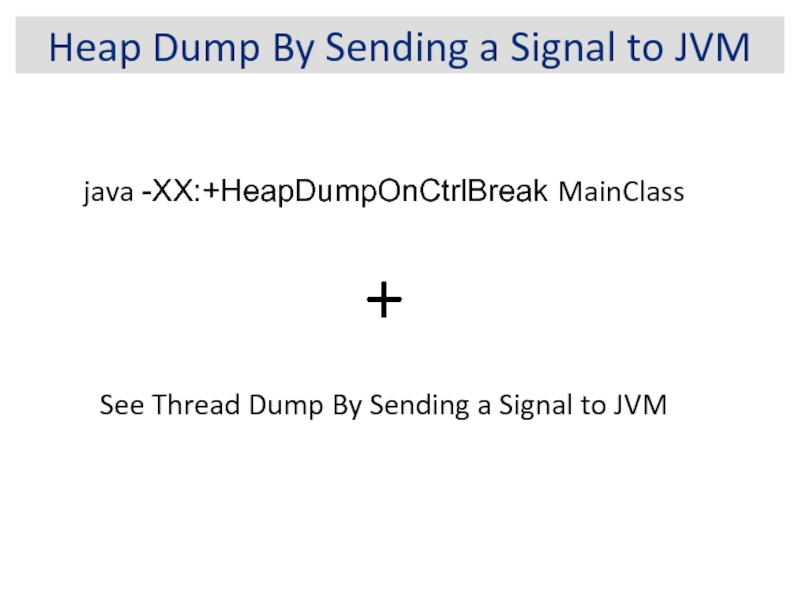
- 49. Heap Dump By Sending a Signal to
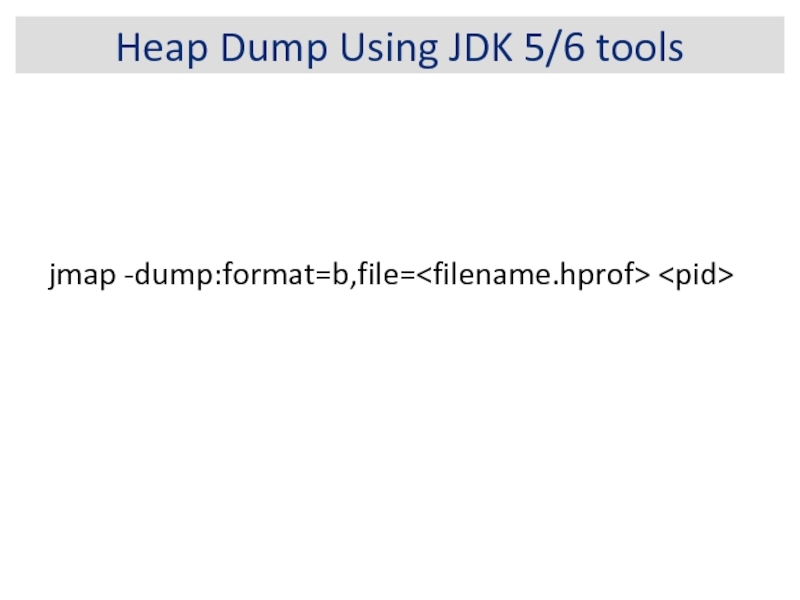
- 50. Heap Dump Using JDK 5/6 tools jmap -dump:format=b,file=
- 51. Heap Dump Using JConsole
- 52. Eclipse Memory Analyser
- 53. Example 3: Memory Leak
- 54. Heap Memory Usage
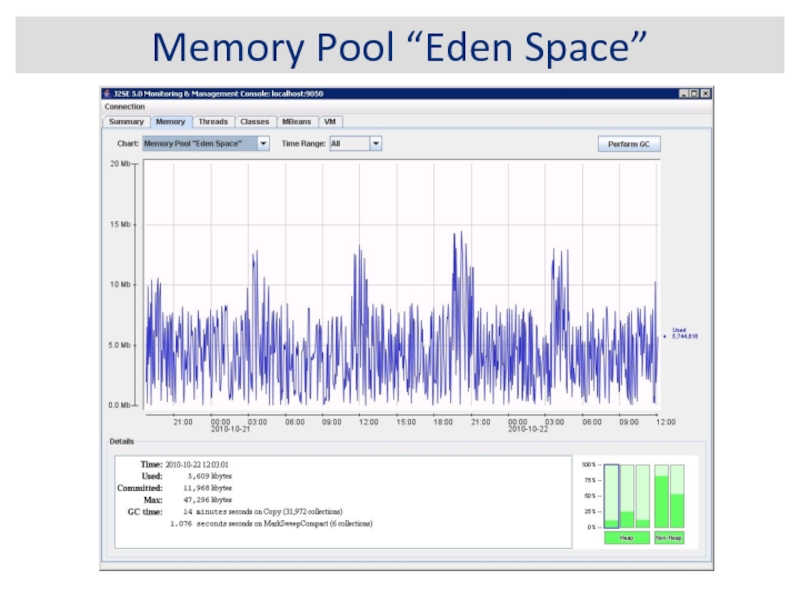
- 55. Memory Pool “Eden Space”
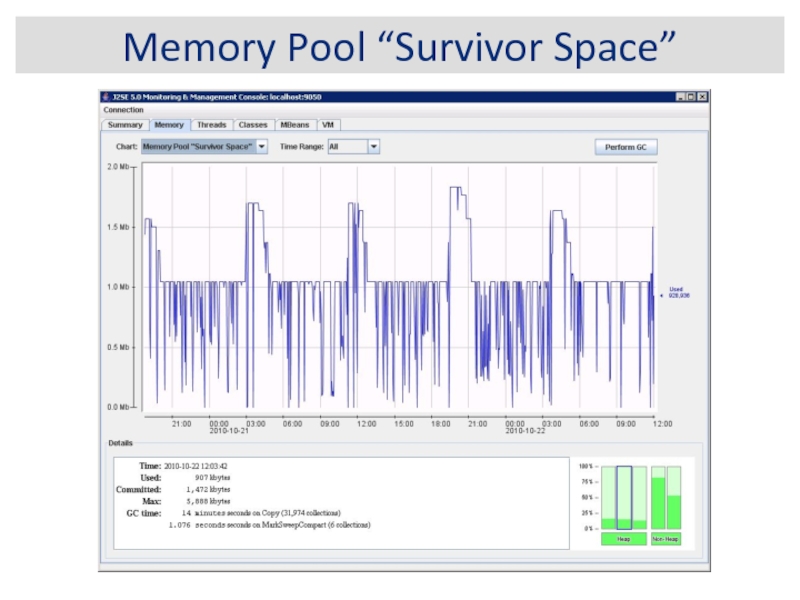
- 56. Memory Pool “Survivor Space”
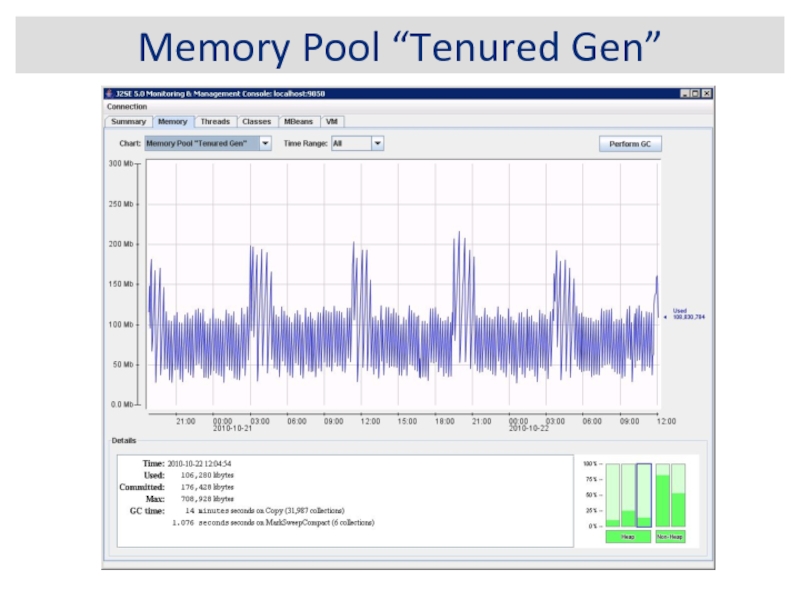
- 57. Memory Pool “Tenured Gen”
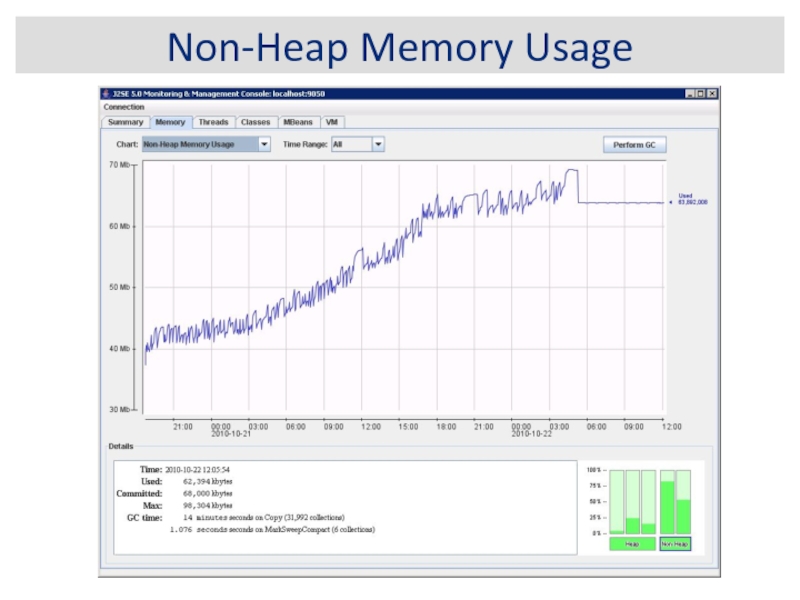
- 58. Non-Heap Memory Usage
- 59. Memory Pool “Code Cache”
- 60. Memory Pool “Perm Gen”
- 61. Max Thread Count Depends on Stack Size
- 62. Max Thread Count Depends on Heap Size
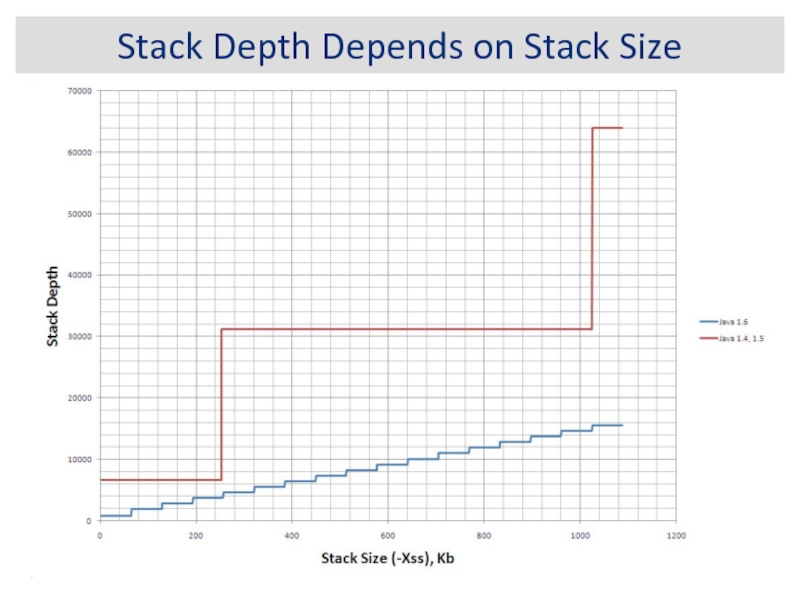
- 63. Stack Depth Depends on Stack Size
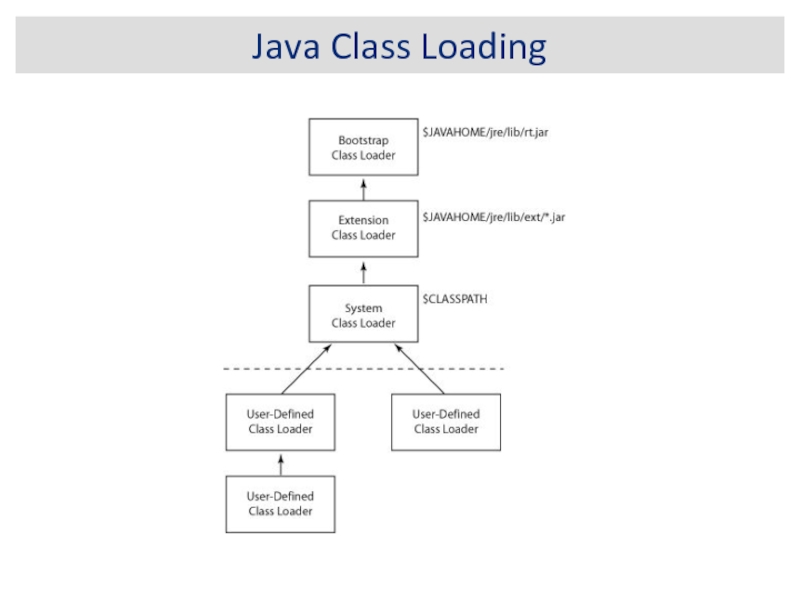
- 64. Java Class Loading
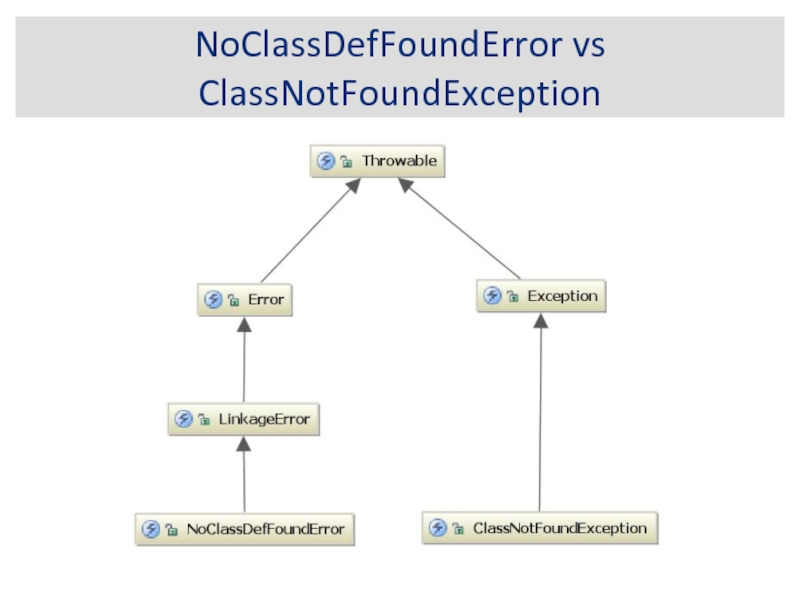
- 65. NoClassDefFoundError vs ClassNotFoundException
- 66. The End
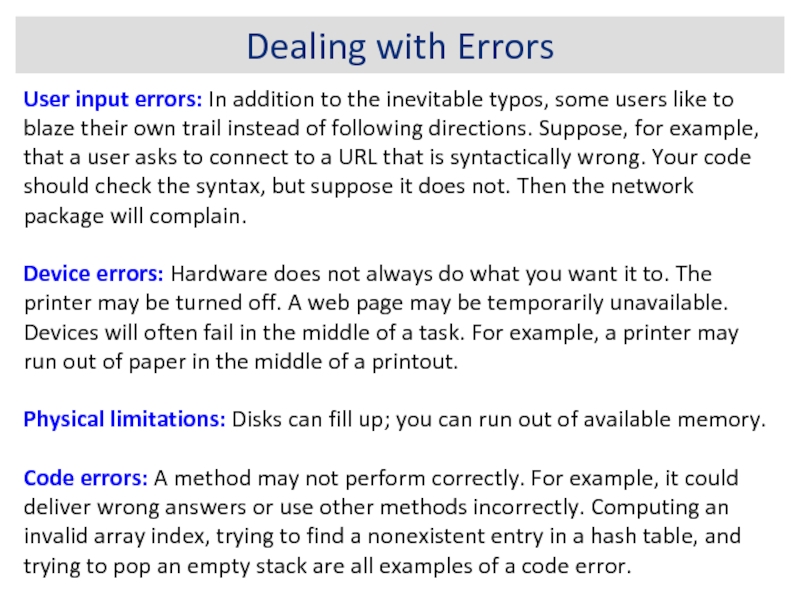
Слайд 2Dealing with Errors
User input errors: In addition to the inevitable typos,
Device errors: Hardware does not always do what you want it to. The printer may be turned off. A web page may be temporarily unavailable. Devices will often fail in the middle of a task. For example, a printer may run out of paper in the middle of a printout.
Physical limitations: Disks can fill up; you can run out of available memory.
Code errors: A method may not perform correctly. For example, it could deliver wrong answers or use other methods incorrectly. Computing an invalid array index, trying to find a nonexistent entry in a hash table, and trying to pop an empty stack are all examples of a code error.
Слайд 5JVM Debug Parameters
Modern JVMs
-agentlib:jdwp=transport=dt_socket,server=y,suspend=n,address=5005
For JDK 1.4.x
-Xdebug -Xrunjdwp:transport=dt_socket,server=y,suspend=n,address=5005
For JDK 1.3.x or
-Xnoagent -Djava.compiler=NONE -Xdebug
-Xrunjdwp:transport=dt_socket,server=y,suspend=n,address=5005
Слайд 13Expert’s Checklist
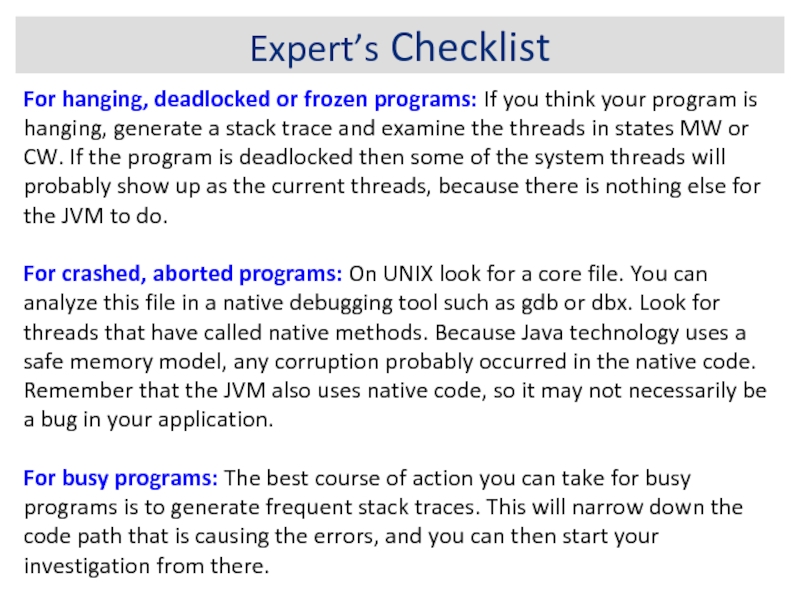
For hanging, deadlocked or frozen programs: If you think your
For crashed, aborted programs: On UNIX look for a core file. You can analyze this file in a native debugging tool such as gdb or dbx. Look for threads that have called native methods. Because Java technology uses a safe memory model, any corruption probably occurred in the native code. Remember that the JVM also uses native code, so it may not necessarily be a bug in your application.
For busy programs: The best course of action you can take for busy programs is to generate frequent stack traces. This will narrow down the code path that is causing the errors, and you can then start your investigation from there.
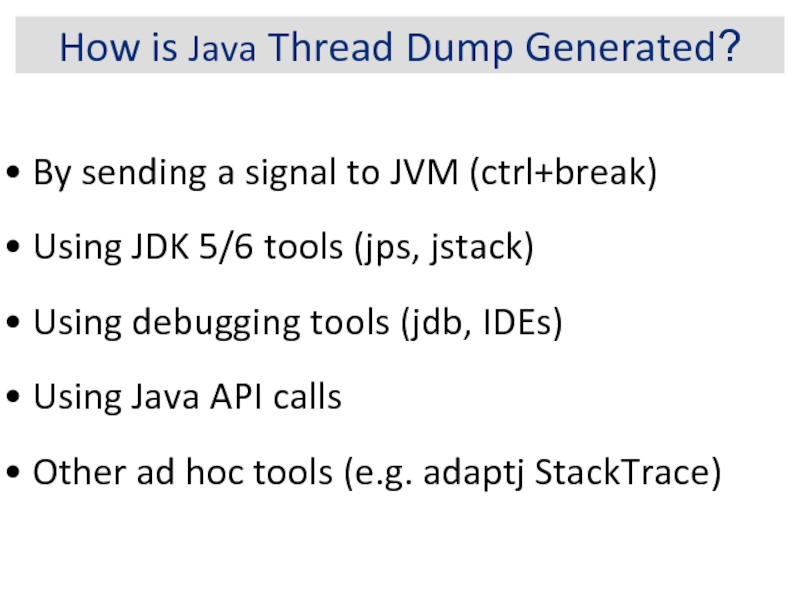
Слайд 15How is Java Thread Dump Generated?
By sending a signal to
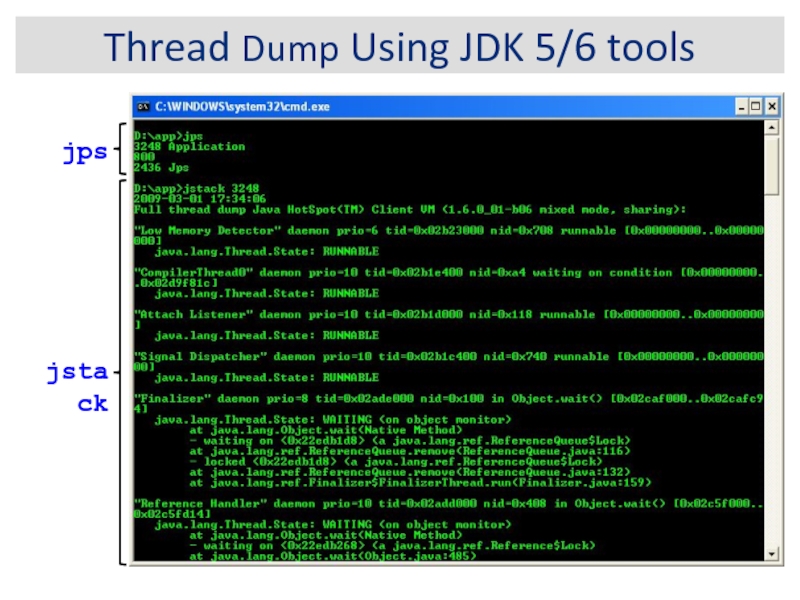
Using JDK 5/6 tools (jps, jstack)
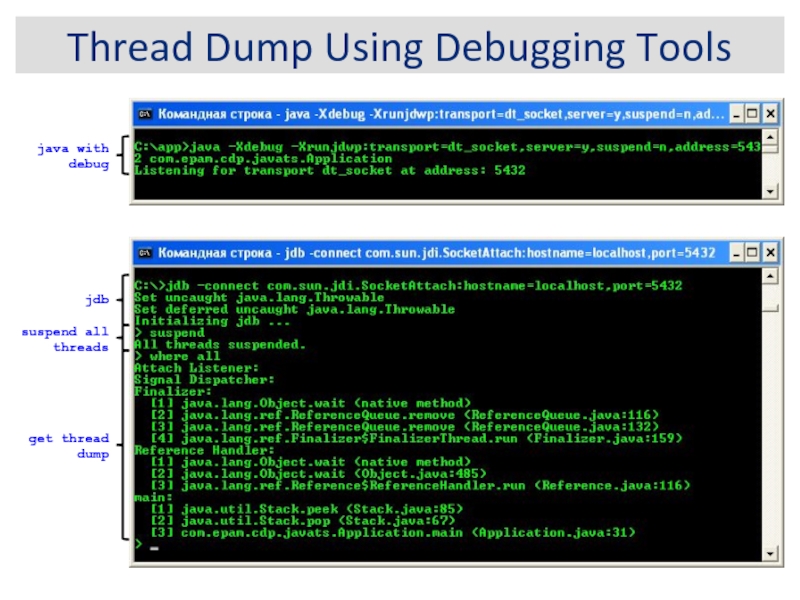
Using debugging tools (jdb, IDEs)
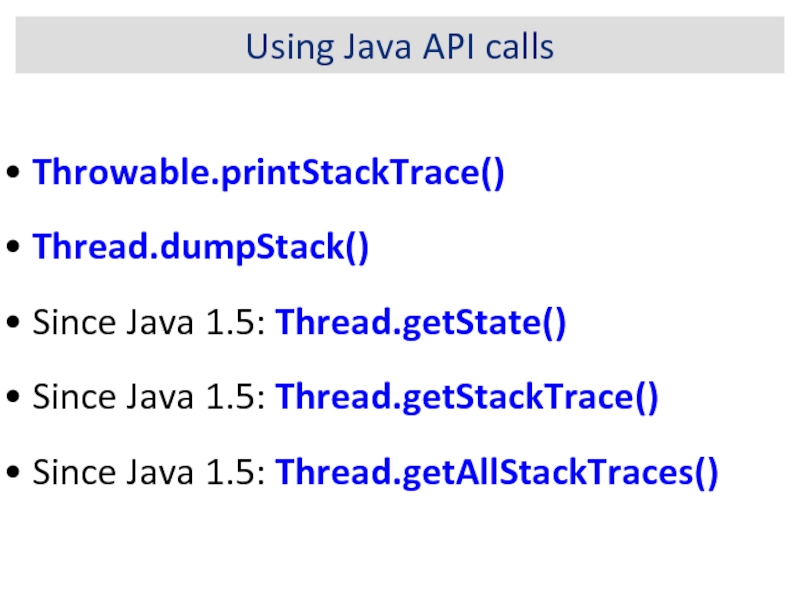
Using Java API calls
Other ad hoc tools (e.g. adaptj StackTrace)
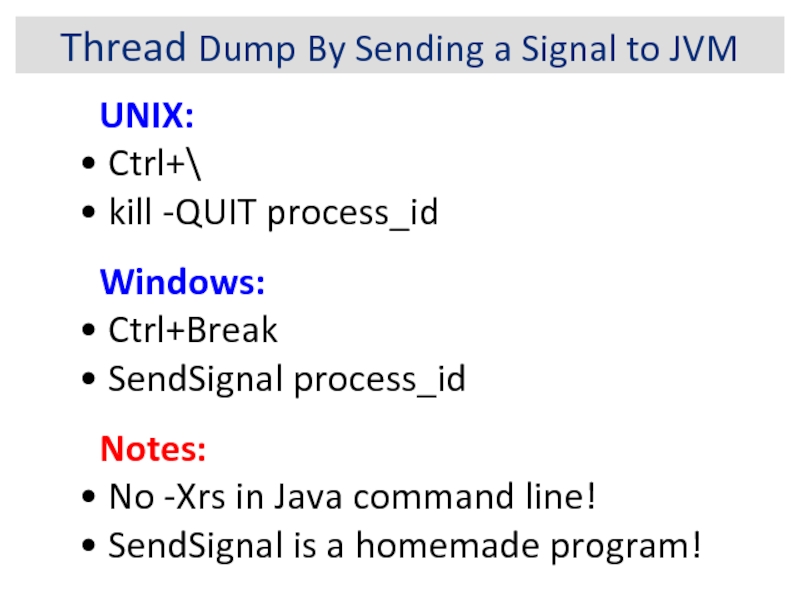
Слайд 16Thread Dump By Sending a Signal to JVM
UNIX:
Ctrl+\
Windows:
Ctrl+Break
SendSignal process_id
Notes:
No -Xrs in Java command line!
SendSignal is a homemade program!
Слайд 20Using Java API calls
Throwable.printStackTrace()
Thread.dumpStack()
Since Java 1.5: Thread.getState()
Since
Since Java 1.5: Thread.getAllStackTraces()
Слайд 30Debugging Performance Issues (1)
Symptom: High CPU consumption and poor response time
Thread
Solution: The method/class is the one which is definitely taking a lot of CPU. See if you can optimize these calls. Some of the REALLY easy kills we have had in this category is using a Collection.remove(Object) where the backend collection is a List. Change the backed collection to be a HashSet. A word of caution though: There have been times when the runnable threads are innocent and the GC is the one consuming the CPU.
Слайд 31Debugging Performance Issues (2)
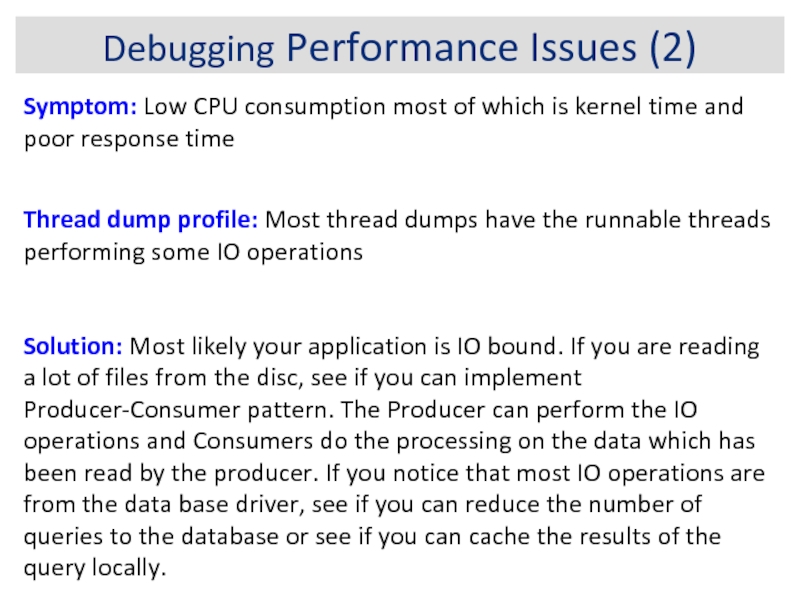
Symptom: Low CPU consumption most of which is
Thread dump profile: Most thread dumps have the runnable threads performing some IO operations
Solution: Most likely your application is IO bound. If you are reading a lot of files from the disc, see if you can implement Producer-Consumer pattern. The Producer can perform the IO operations and Consumers do the processing on the data which has been read by the producer. If you notice that most IO operations are from the data base driver, see if you can reduce the number of queries to the database or see if you can cache the results of the query locally.
Слайд 32Debugging Performance Issues (3)
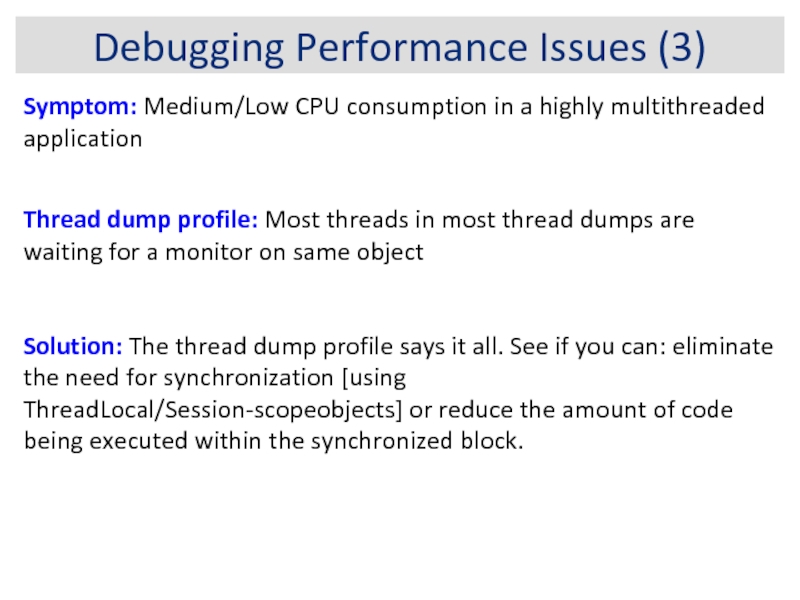
Symptom: Medium/Low CPU consumption in a highly multithreaded
Thread dump profile: Most threads in most thread dumps are waiting for a monitor on same object
Solution: The thread dump profile says it all. See if you can: eliminate the need for synchronization [using ThreadLocal/Session-scopeobjects] or reduce the amount of code being executed within the synchronized block.
Слайд 33Debugging Performance Issues (4)
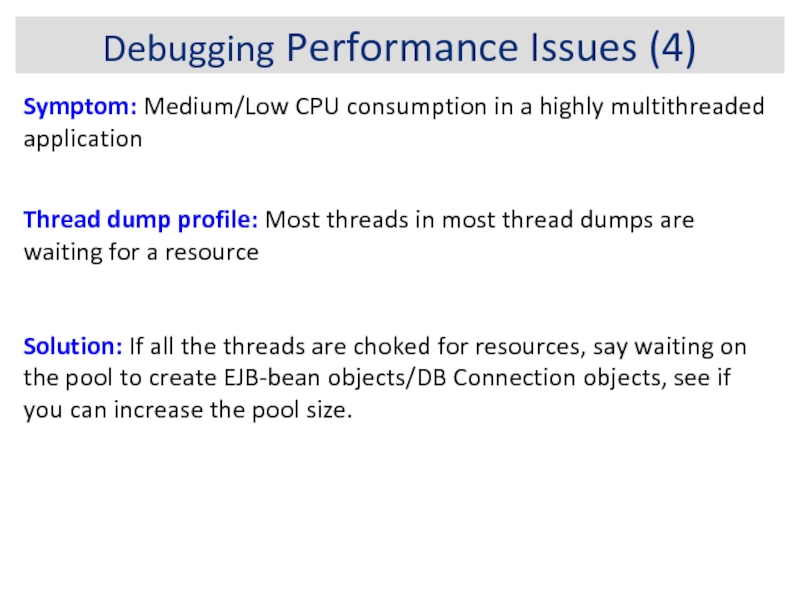
Symptom: Medium/Low CPU consumption in a highly multithreaded
Thread dump profile: Most threads in most thread dumps are waiting for a resource
Solution: If all the threads are choked for resources, say waiting on the pool to create EJB-bean objects/DB Connection objects, see if you can increase the pool size.
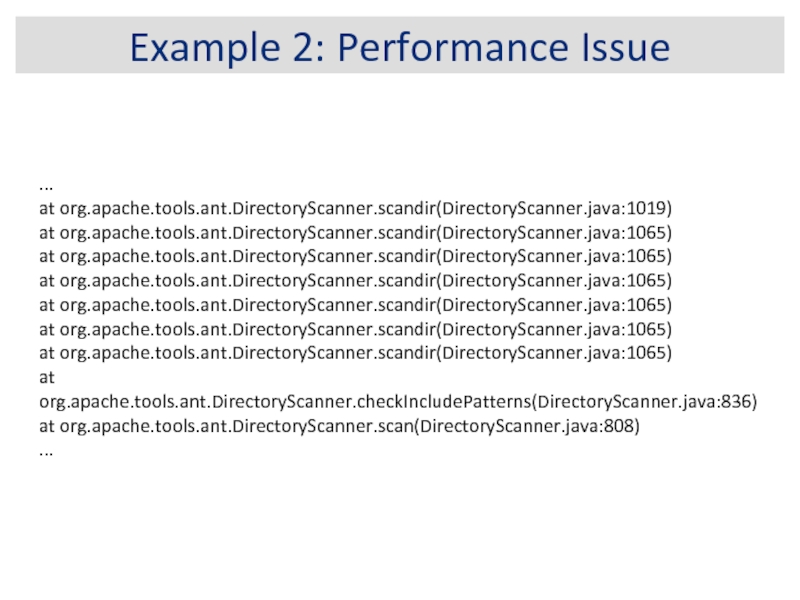
Слайд 35Example 2: Performance Issue
...
at org.apache.tools.ant.DirectoryScanner.scandir(DirectoryScanner.java:1019)
at org.apache.tools.ant.DirectoryScanner.scandir(DirectoryScanner.java:1065)
at org.apache.tools.ant.DirectoryScanner.scandir(DirectoryScanner.java:1065)
at org.apache.tools.ant.DirectoryScanner.scandir(DirectoryScanner.java:1065)
at org.apache.tools.ant.DirectoryScanner.scandir(DirectoryScanner.java:1065)
at org.apache.tools.ant.DirectoryScanner.scandir(DirectoryScanner.java:1065)
at org.apache.tools.ant.DirectoryScanner.scandir(DirectoryScanner.java:1065)
at
at org.apache.tools.ant.DirectoryScanner.scan(DirectoryScanner.java:808)
...
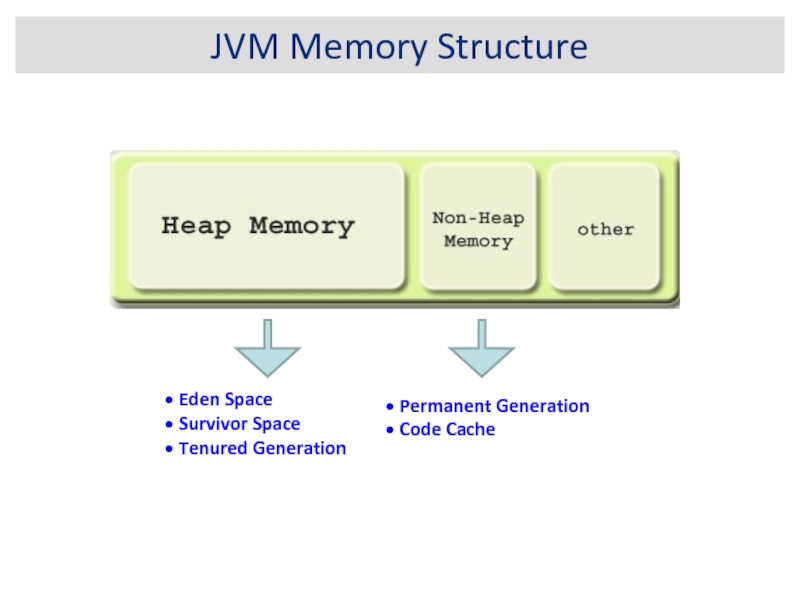
Слайд 36JVM Memory Structure
Eden Space
Survivor Space
Tenured Generation
Permanent Generation
Слайд 39Heap Dump
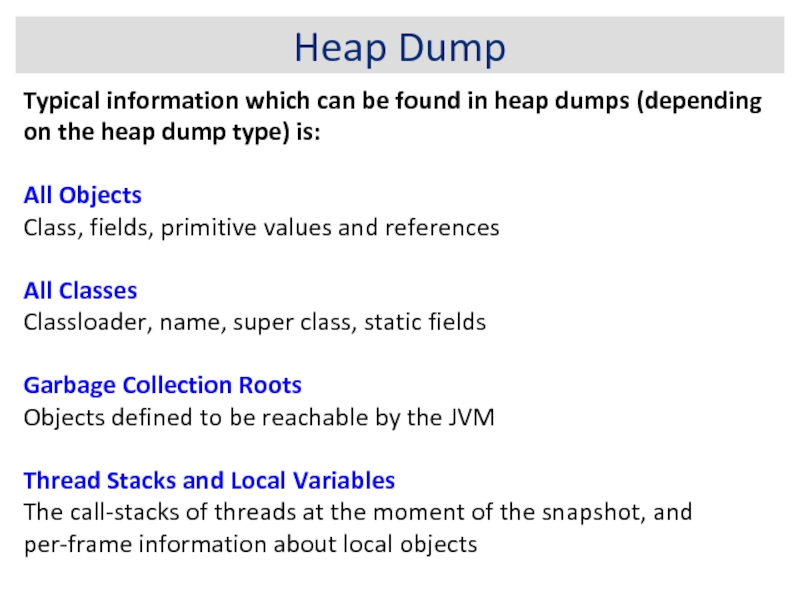
Typical information which can be found in heap dumps (depending
All Objects
Class, fields, primitive values and references
All Classes
Classloader, name, super class, static fields
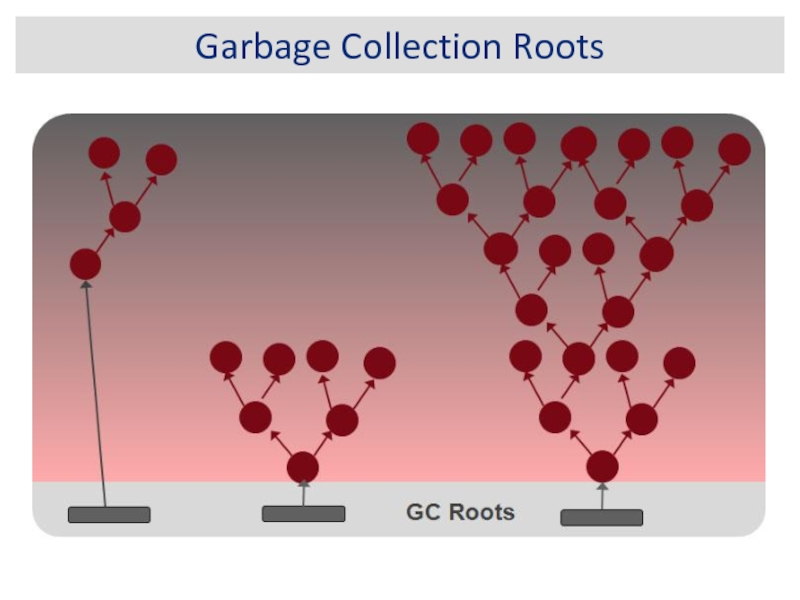
Garbage Collection Roots
Objects defined to be reachable by the JVM
Thread Stacks and Local Variables
The call-stacks of threads at the moment of the snapshot, and per-frame information about local objects
Слайд 40Shallow vs. Retained Heap
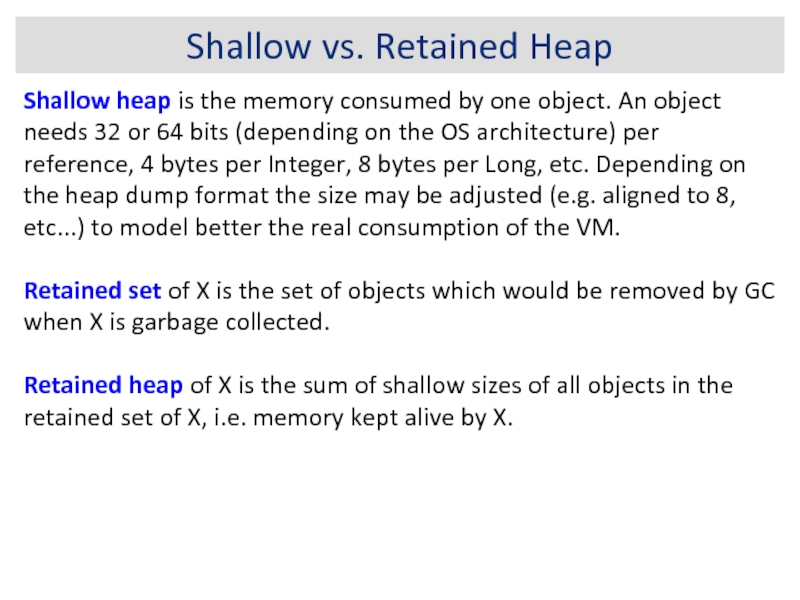
Shallow heap is the memory consumed by one
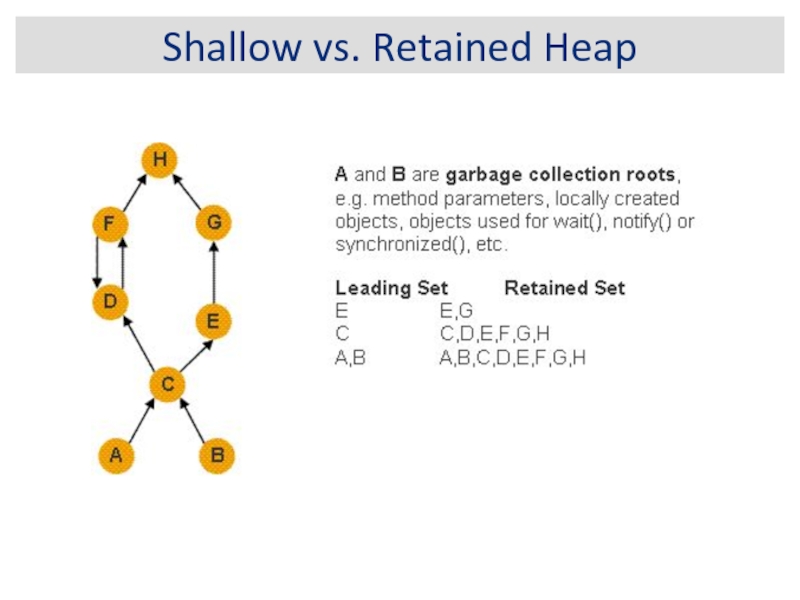
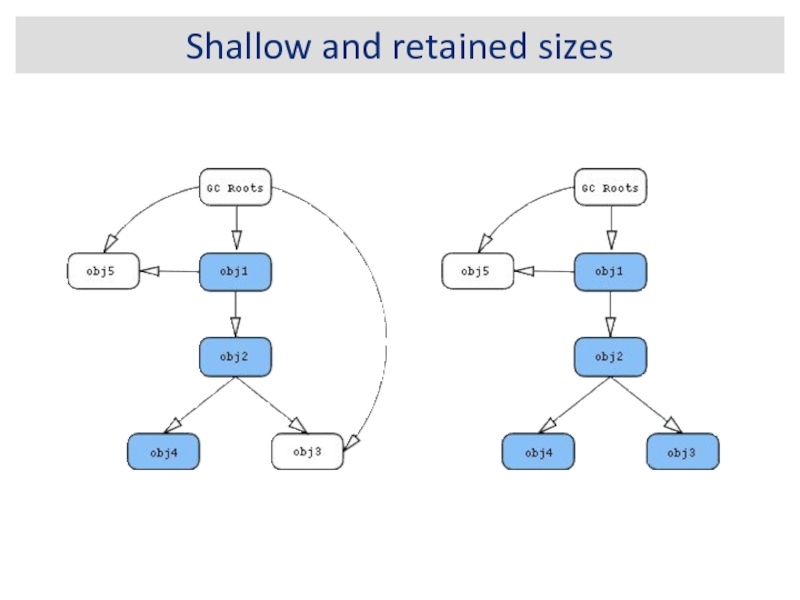
Retained set of X is the set of objects which would be removed by GC when X is garbage collected.
Retained heap of X is the sum of shallow sizes of all objects in the retained set of X, i.e. memory kept alive by X.
Слайд 43Dominator Tree
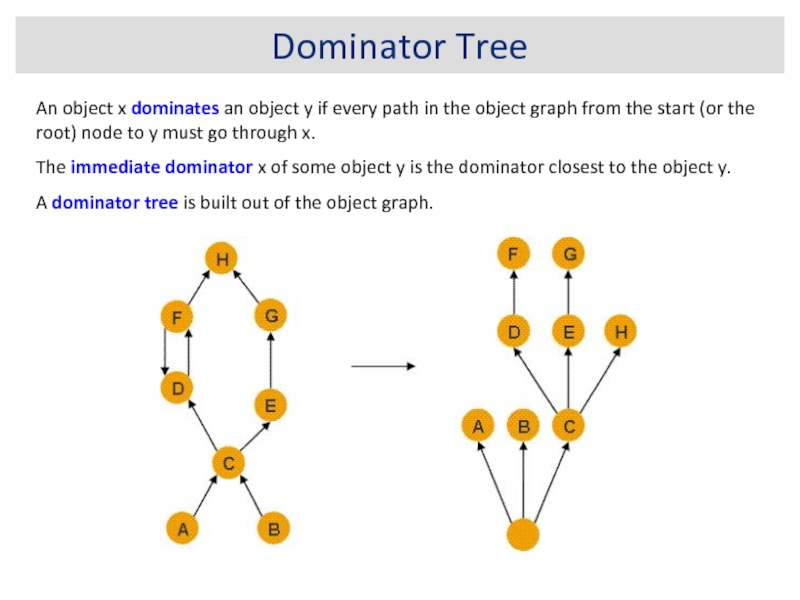
An object x dominates an object y if every path
The immediate dominator x of some object y is the dominator closest to the object y.
A dominator tree is built out of the object graph.
Слайд 45Garbage Collection Roots
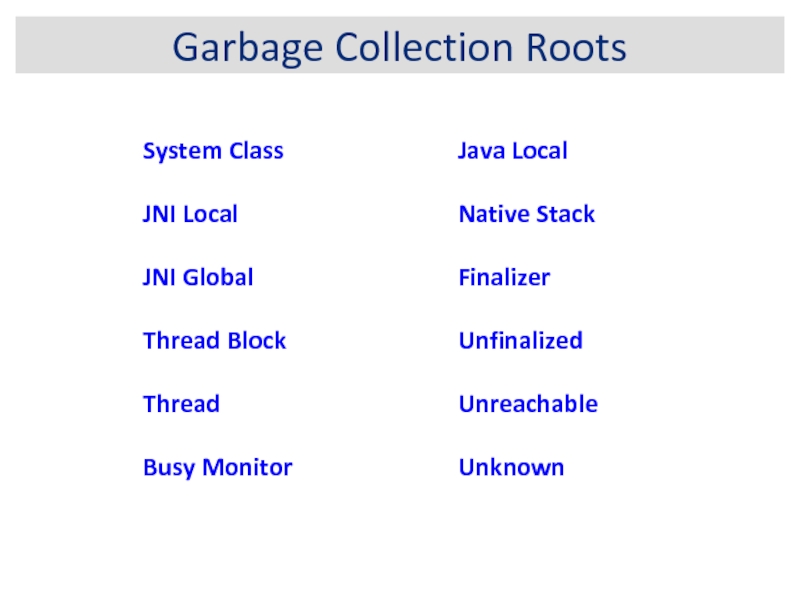
System Class
JNI Local
JNI Global
Thread Block
Thread
Busy Monitor
Java Local
Native Stack
Finalizer
Unfinalized
Unreachable
Unknown
Слайд 46Garbage Collection Roots
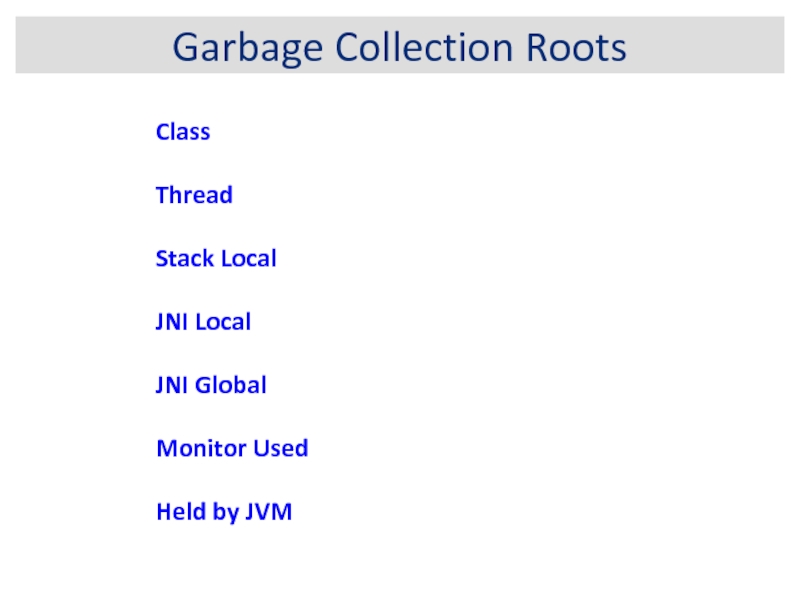
Class
Thread
Stack Local
JNI Local
JNI Global
Monitor Used
Held
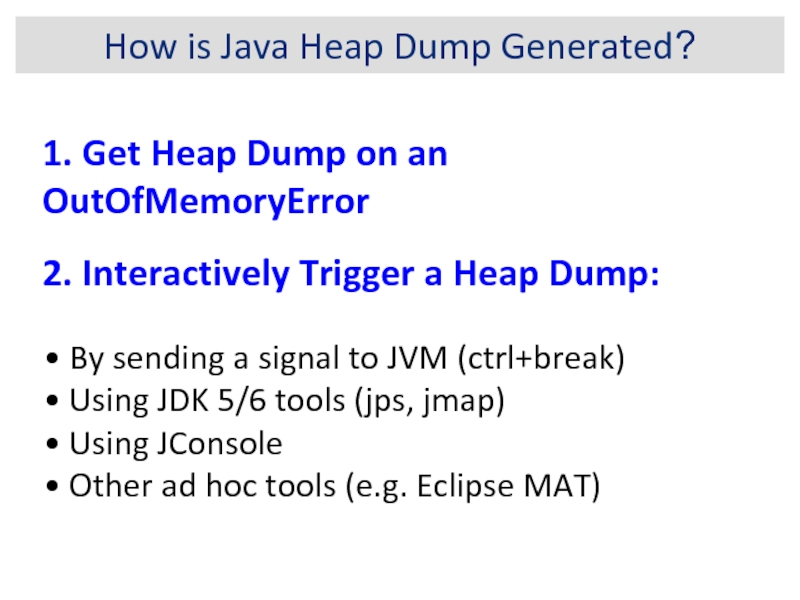
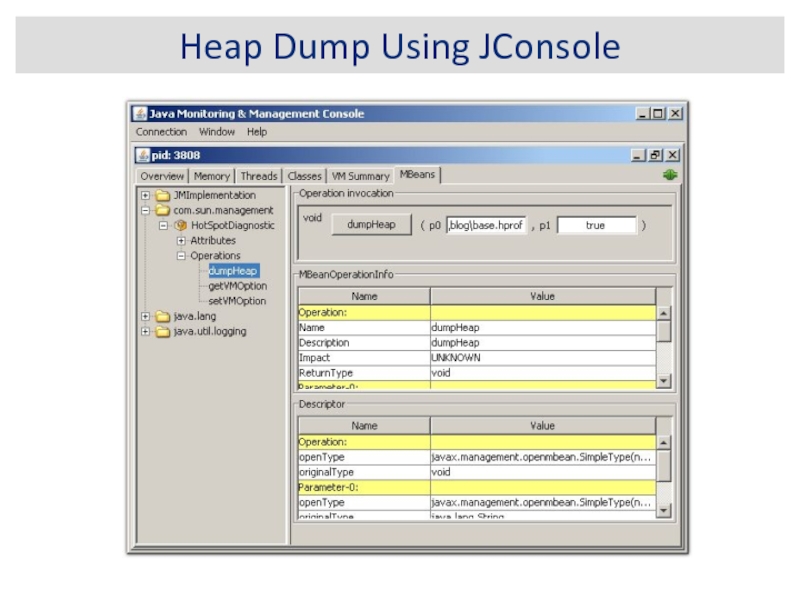
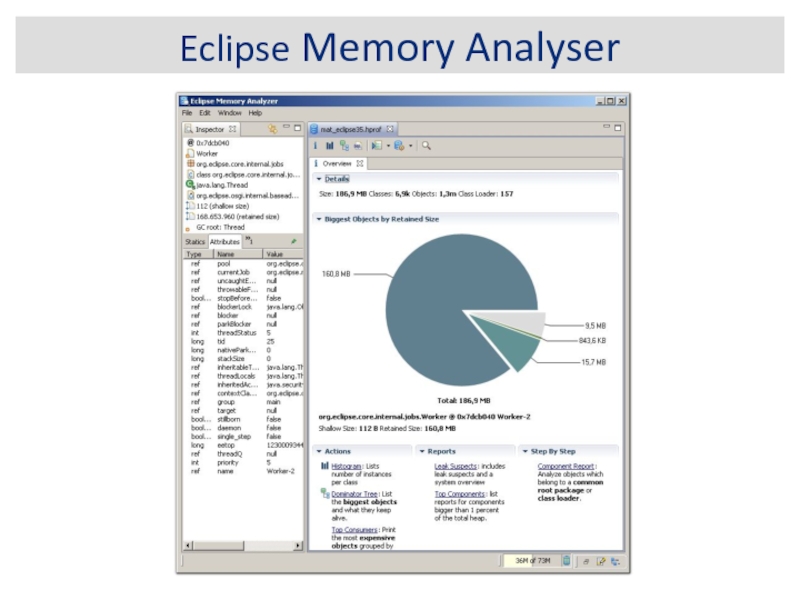
Слайд 47How is Java Heap Dump Generated?
By sending a signal to
Using JDK 5/6 tools (jps, jmap)
Using JConsole
Other ad hoc tools (e.g. Eclipse MAT)
1. Get Heap Dump on an OutOfMemoryError
2. Interactively Trigger a Heap Dump:
