- Главная
- Разное
- Дизайн
- Бизнес и предпринимательство
- Аналитика
- Образование
- Развлечения
- Красота и здоровье
- Финансы
- Государство
- Путешествия
- Спорт
- Недвижимость
- Армия
- Графика
- Культурология
- Еда и кулинария
- Лингвистика
- Английский язык
- Астрономия
- Алгебра
- Биология
- География
- Детские презентации
- Информатика
- История
- Литература
- Маркетинг
- Математика
- Медицина
- Менеджмент
- Музыка
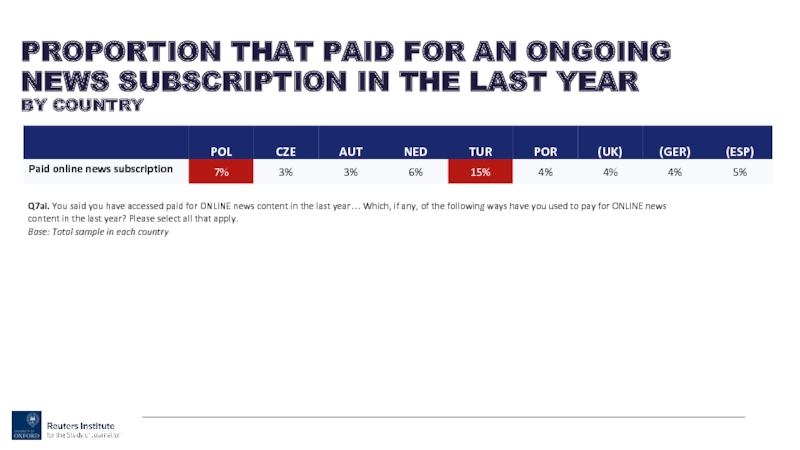
- МХК
- Немецкий язык
- ОБЖ
- Обществознание
- Окружающий мир
- Педагогика
- Русский язык
- Технология
- Физика
- Философия
- Химия
- Шаблоны, картинки для презентаций
- Экология
- Экономика
- Юриспруденция
TRACKING THE FUTURE OF NEWS презентация
Содержание
- 1. TRACKING THE FUTURE OF NEWS
- 2. INFORMATION AND TERMS OF USE This information
- 3. METHODOLOGY
- 4. Note: Turkey is representative of an urban
- 5. EXECUTIVE SUMMARY
- 6. Q8B. Which, if any, of the following
- 7. ALSO FROM 2015 COMPUTER FOR NEWS
- 8. UK8b6_5. You’ve said you use the following
- 9. ALSO FROM 2015 COMPUTER AS MAIN
- 10. Q5b. Which, if any, of the following
- 11. ALSO FROM 2015 DIGITAL-BORN HIGHEST
- 13. Q5b. Which, if any, of the following
- 14. Q5b. Which, if any, of the following
- 15. Q3. Which, if any, of the following
- 16. ALSO FROM 2015 SOCIAL MEDIA
- 17. Q12b. Which, if any, of the following
- 18. ALSO FROM 2015 FACEBOOK FOR NEWS
- 19. Q12b. Which, if any, of the following
- 20. ALSO FROM 2015 WHATSAPP FOR NEWS
- 21. Q12B. Which, if any, of the following
- 22. Q3. Which, if any, of the following
- 23. Q3. Which, if any, of the following
- 24. ALSO FROM 2015 TV HIGHEST
- 25. Q4. You say you’ve used these sources
- 26. Q4. You say you’ve used these sources
- 27. Q4. You say you’ve used these sources
- 28. Q6A. Thinking about news in general, do
- 29. ALSO FROM 2015 AGREE HIGHEST
- 30. Q7a. Have you paid for ONLINE news
- 31. ALSO FROM 2015 PAID FOR
- 32. Q7ai. You said you have accessed paid
- 33. TOP NEWS SOURCES IN EACH COUNTRY
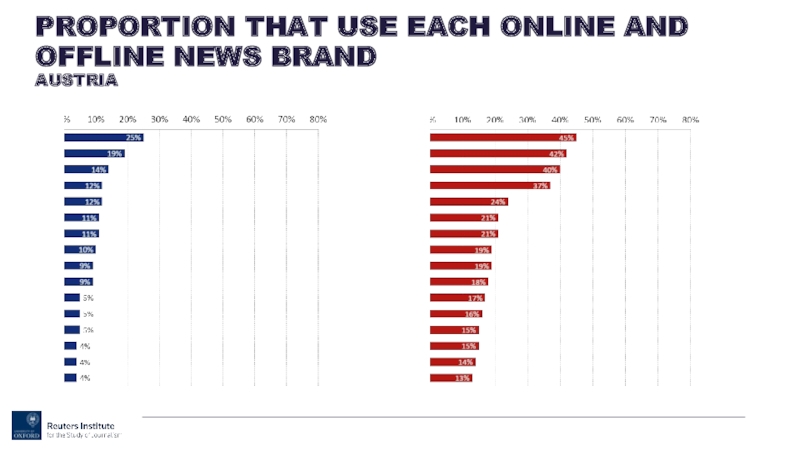
- 34. PROPORTION THAT USE EACH ONLINE AND OFFLINE NEWS BRAND AUSTRIA
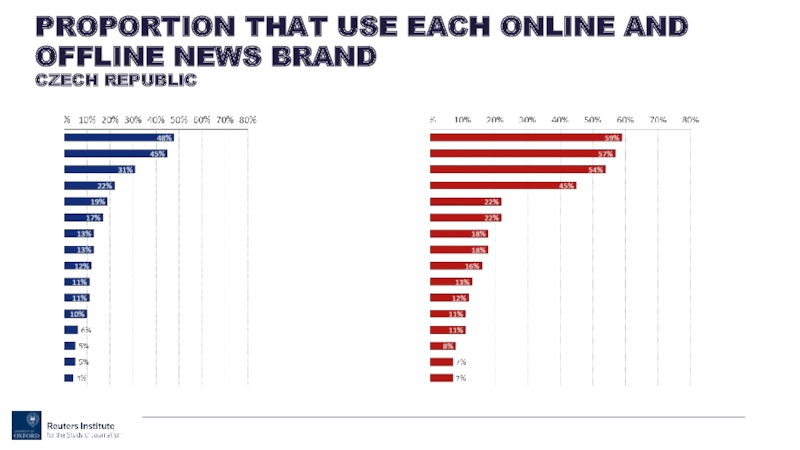
- 35. PROPORTION THAT USE EACH ONLINE AND OFFLINE NEWS BRAND CZECH REPUBLIC
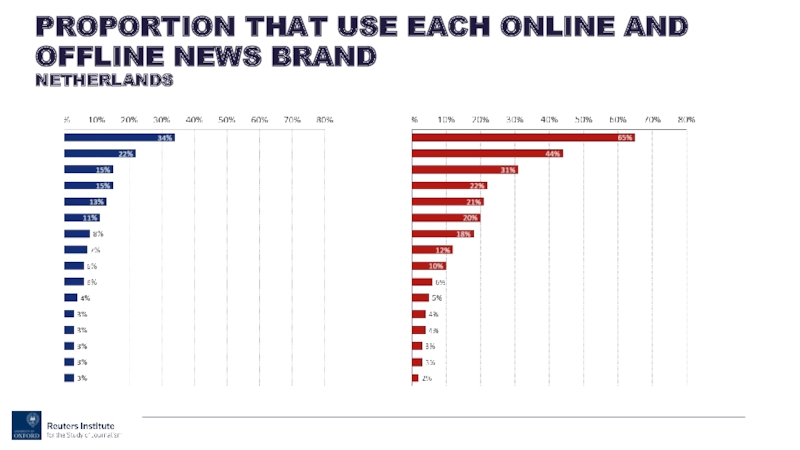
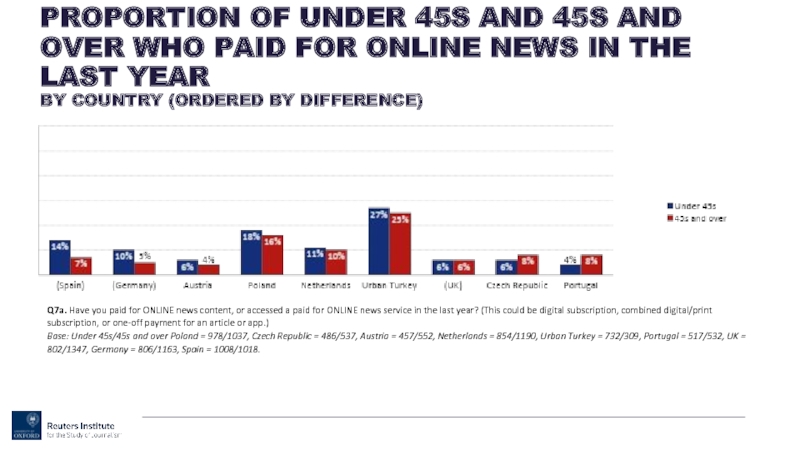
- 36. PROPORTION THAT USE EACH ONLINE AND OFFLINE NEWS BRAND NETHERLANDS
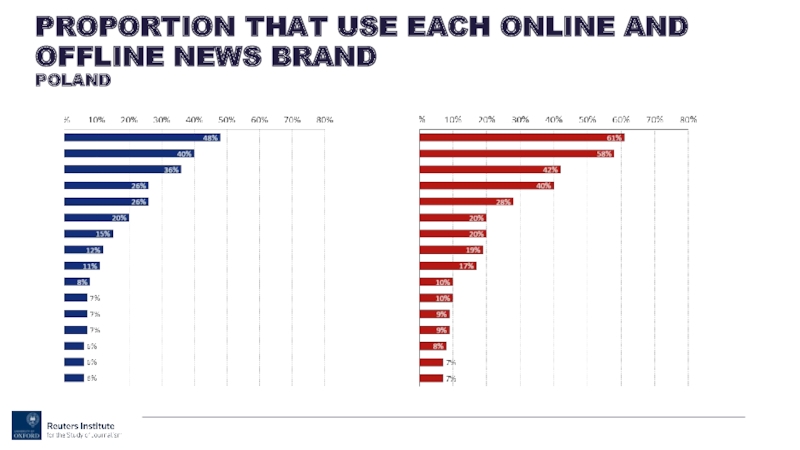
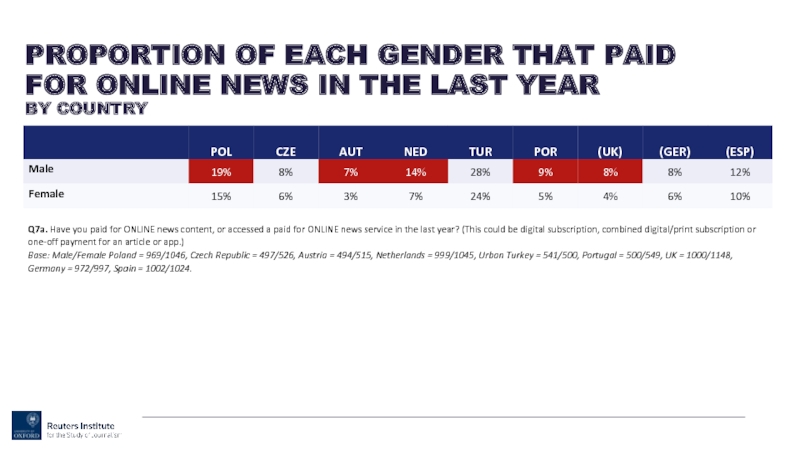
- 37. PROPORTION THAT USE EACH ONLINE AND OFFLINE NEWS BRAND POLAND
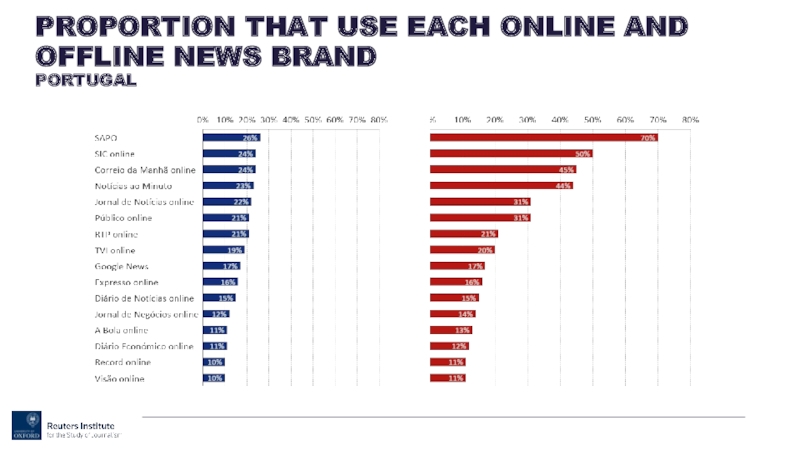
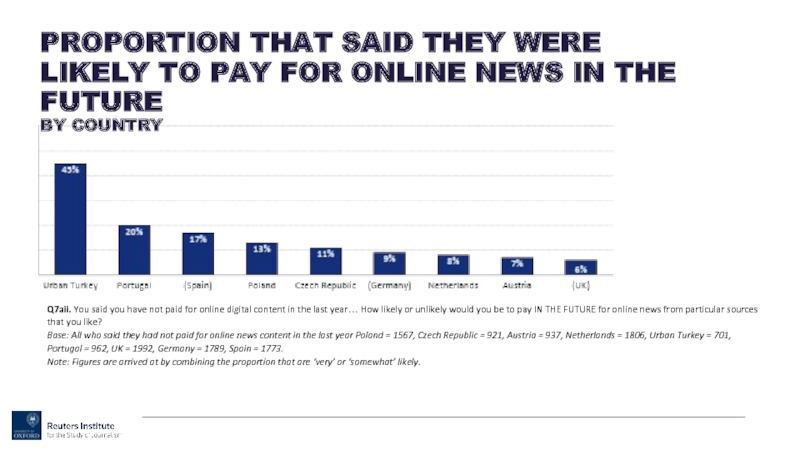
- 38. PROPORTION THAT USE EACH ONLINE AND OFFLINE NEWS BRAND PORTUGAL
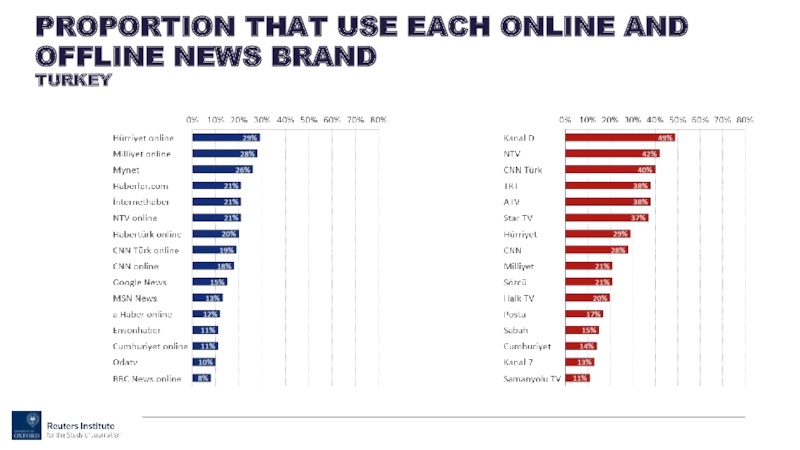
- 39. PROPORTION THAT USE EACH ONLINE AND OFFLINE NEWS BRAND TURKEY
- 40. COMPARATIVE BRAND ANALYSIS
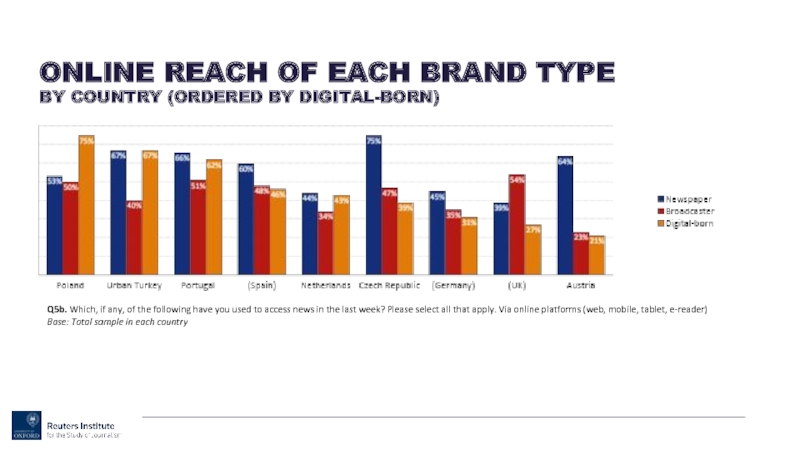
- 41. Q5b. Which, if any, of the following
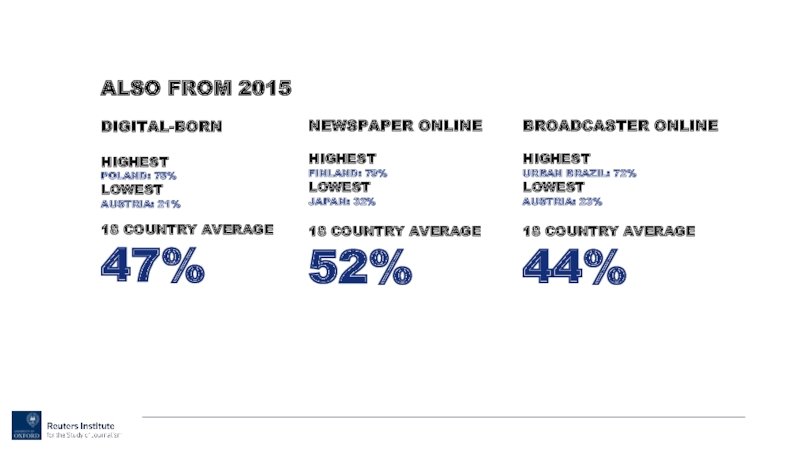
- 42. ALSO FROM 2015 DIGITAL-BORN HIGHEST
- 43. Q5a. Which, if any, of the following
- 44. Q5a. Which, if any, of the following
- 45. Q5b. Which, if any, of the following
- 46. Q5b. Which, if any, of the following
- 49. Q5b. Which, if any, of the following
- 50. Q5b. Which, if any, of the following
- 51. Q5b. Which, if any, of the following
- 52. Q5b. Which, if any, of the following
- 53. Q5b. Which, if any, of the following
- 54. Q5b. Which, if any, of the following
- 55. Q3. Which, if any, of the following
- 56. SOURCES OF NEWS
- 57. Q3. Which, if any, of the following
- 58. Q3. Which, if any, of the following
- 59. ALSO FROM 2015 TV HIGHEST
- 60. Q4. You say you’ve used these sources
- 61. Q4. You say you’ve used these sources
- 62. Q4. You say you’ve used these sources
- 63. Q3. Which, if any, of the following
- 64. Q3. Which, if any, of the following
- 65. Q3. Which, if any, of the following
- 66. FREQUENCY AND INTEREST
- 67. Q1b_rc. Typically, how often do you access
- 68. Q1c. How interested, if at all, would
- 69. TRUST
- 70. Q6a. Thinking about news in general, do
- 71. Q6A. Thinking about news in general, do
- 72. ALSO FROM 2015 AGREE HIGHEST
- 73. Q6B. Thinking specifically about news sources that
- 74. DIFFERENT TYPES OF NEWS
- 75. Q13. During an average week in which,
- 76. PAYING FOR NEWS
- 77. Q7. Have you bought (paid for) a
- 78. Q7. Have you bought (paid for) a
- 79. Q7a. Have you paid for ONLINE news
- 80. ALSO FROM 2015 PAID FOR
- 82. Q7ai. You said you have accessed paid
- 83. Q7a. Have you paid for ONLINE news
- 84. Q7a. Have you paid for ONLINE news
- 85. Q7aii. You said you have not paid
- 86. SMARTPHONES AND TABLETS
- 87. Q8B. Which, if any, of the following
- 88. ALSO FROM 2015 COMPUTER FOR NEWS
- 89. UK8b6_5. You’ve said you use the following
- 90. Q8A. Which, if any, of the following
- 91. ALSO FROM 2015 SMARTPHONE USERS WITH
- 92. Q8B. Which, if any, of the following
- 93. ALSO FROM 2015 SMART/CONNECTED TV FOR
- 94. NEW FORMATS
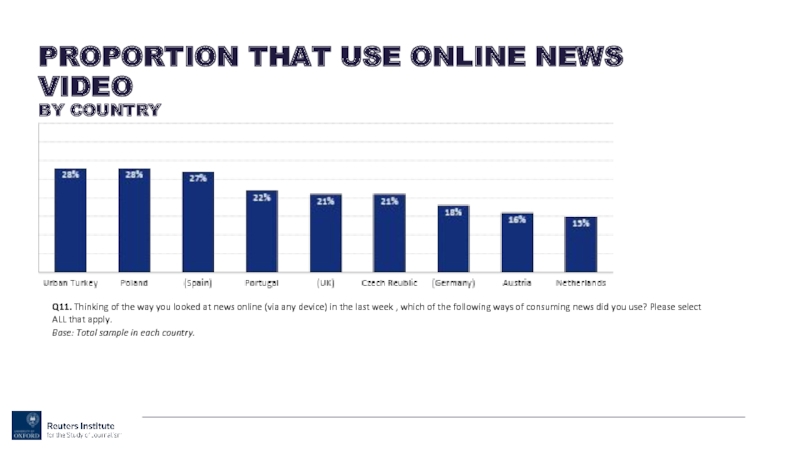
- 95. Q11. Thinking of the way you looked
- 96. Q11. Thinking of the way you looked
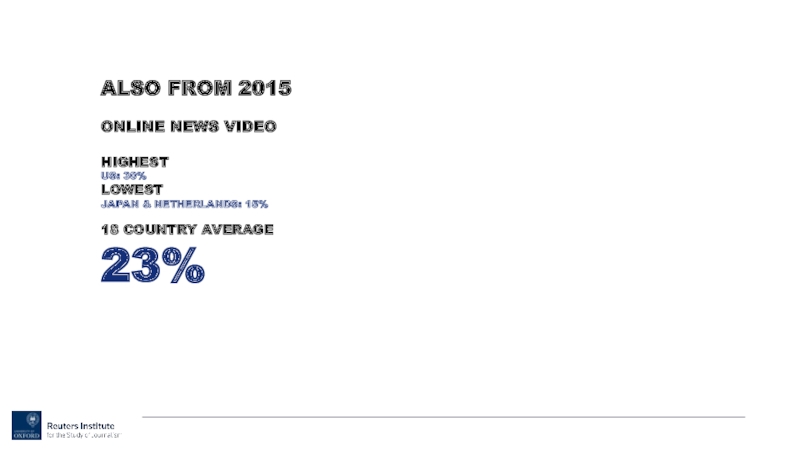
- 97. ALSO FROM 2015 ONLINE NEWS VIDEO
- 98. Q11. Thinking of the way you looked
- 99. SOCIAL MEDIA
- 100. Q3. Which, if any, of the following
- 101. ALSO FROM 2015 SOCIAL MEDIA
- 102. Q12b. Which, if any, of the following
- 103. ALSO FROM 2015 FACEBOOK FOR NEWS
- 104. Q12A. Which, if any, of the following
- 105. Q12a. Which, if any, of the following
- 106. ALSO FROM 2015 WHATSAPP FOR NEWS
- 107. Q12B. Which, if any, of the following
- 108. PATHWAYS AND DISCOVERY
- 109. Q10. Thinking about how you got news
- 110. Q10. Thinking about how you got news
- 111. Q1c. How interested, if at all, would
- 112. Q1c. How interested, if at all, would
- 113. NEWS PARTICIPATION
- 114. Q13. During an average week in which,
- 115. Q6b. Thinking specifically about news sources that
- 116. More information www.digitalnewsreport.org #risj15 RISJ Digital News Report 2015
Слайд 2INFORMATION AND TERMS OF USE
This information is based on one of
In 2015, the study explored the habits of more than 30,000 people in 18 countries. The results from 12 countries were published in June 2015. The results from a further 6 countries (Poland, Czech Republic, Austria, Netherlands, Turkey, and Portugal) are detailed here, and were published in October 2015.
To aid the interpretation, the results from the 6 countries are compared to data from 3 of the original 12 countries: United Kingdom, Germany, and Spain.
Research was conducted online in January/early February 2015. Additional analysis of key themes, country level insights from network of partners RISJ Digital News Report 2015
Licensing and terms of use You are welcome to use the data and slides in this report for any purpose (commercial or non-commercial) in return for simple attribution under a Creative Commons license: http://creativecommons.org/licenses/by/3.0/
Please attribute to the Reuters Institute Digital News Report 2015. If relevant, add a link to: digitalnewsreport.org
We welcome feedback and questions at info@digitalnewsreport.org
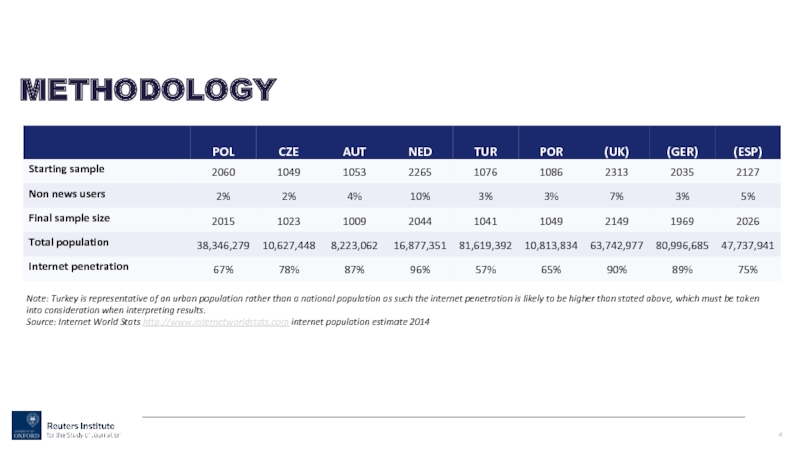
Слайд 4Note: Turkey is representative of an urban population rather than a
Source: Internet World Stats http://www.internetworldstats.com internet population estimate 2014
METHODOLOGY
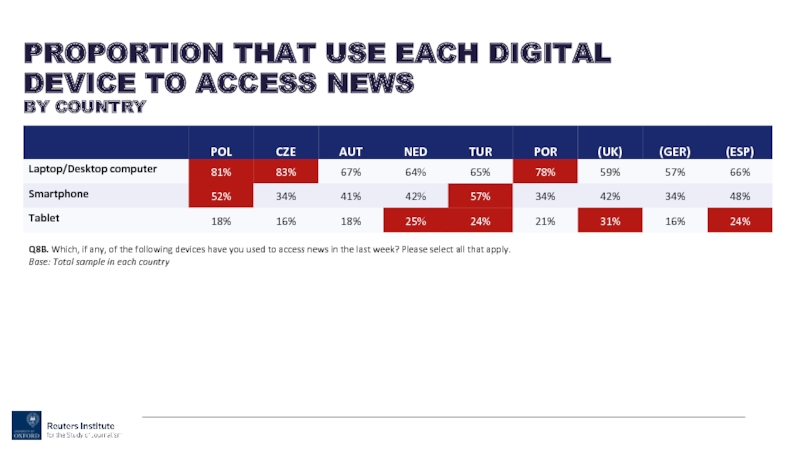
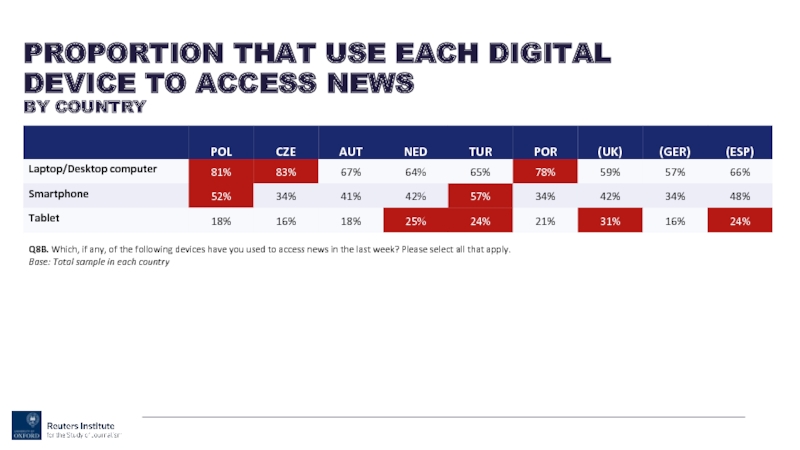
Слайд 6Q8B. Which, if any, of the following devices have you used
PROPORTION THAT USE EACH DIGITAL DEVICE TO ACCESS NEWS
BY COUNTRY
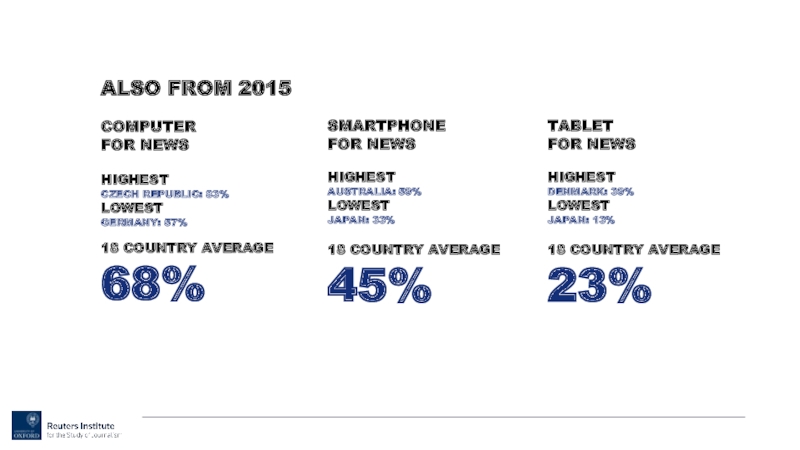
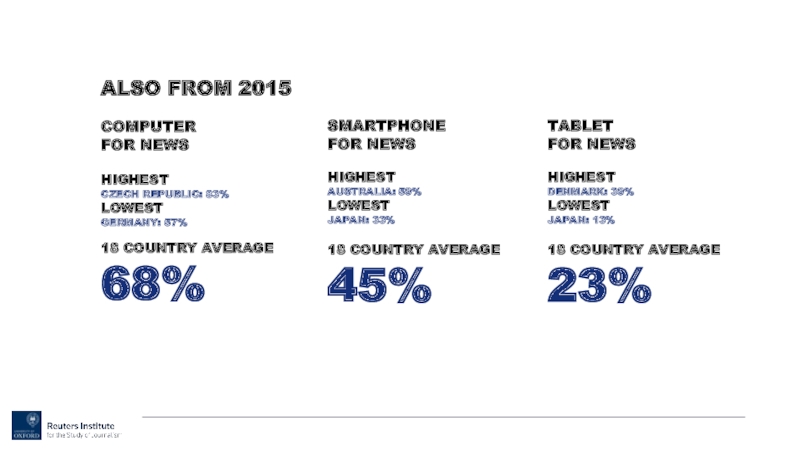
Слайд 7ALSO FROM 2015
COMPUTER
FOR NEWS
HIGHEST
CZECH REPUBLIC: 83%
LOWEST
GERMANY: 57%
18 COUNTRY AVERAGE
68%
SMARTPHONE
FOR NEWS
HIGHEST
AUSTRALIA: 59%
LOWEST
JAPAN:
18 COUNTRY AVERAGE
45%
TABLET
FOR NEWS
HIGHEST
DENMARK: 39%
LOWEST
JAPAN: 13%
18 COUNTRY AVERAGE
23%
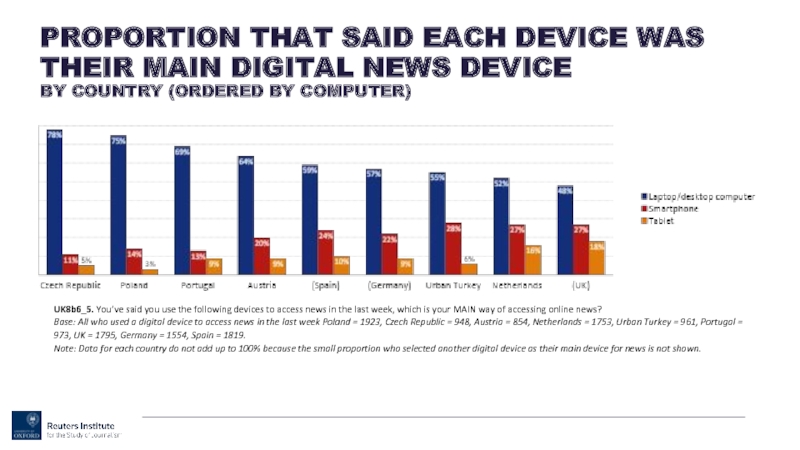
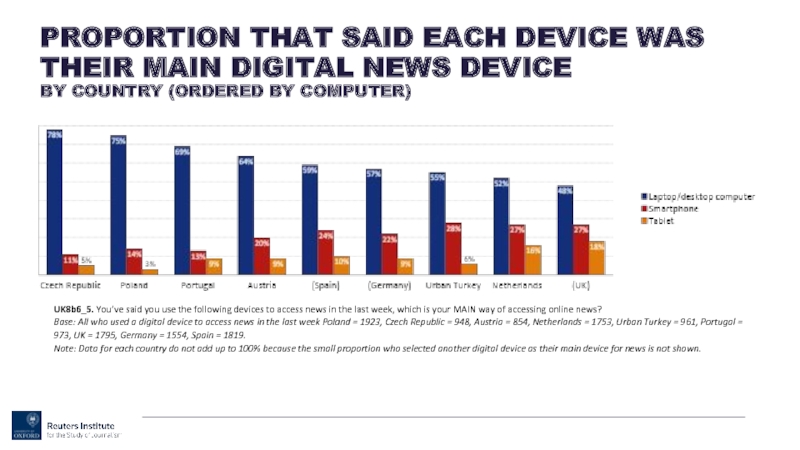
Слайд 8UK8b6_5. You’ve said you use the following devices to access news
PROPORTION THAT SAID EACH DEVICE WAS THEIR MAIN DIGITAL NEWS DEVICE
BY COUNTRY (ORDERED BY COMPUTER)
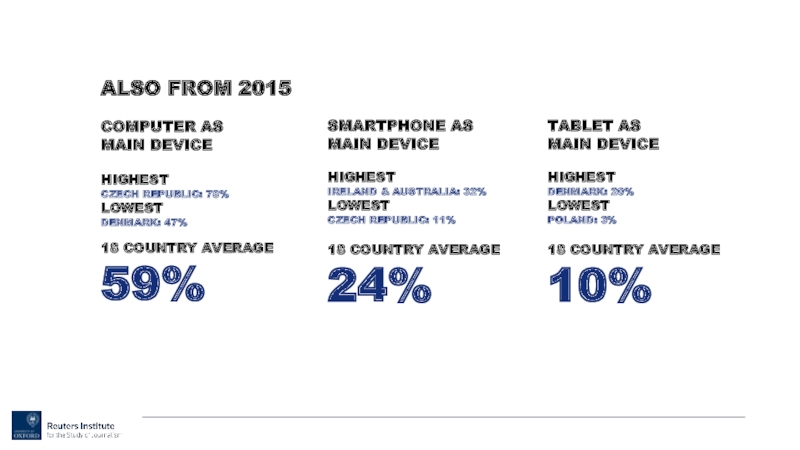
Слайд 9ALSO FROM 2015
COMPUTER AS
MAIN DEVICE
HIGHEST
CZECH REPUBLIC: 78%
LOWEST
DENMARK: 47%
18 COUNTRY AVERAGE
59%
SMARTPHONE AS
MAIN
HIGHEST IRELAND & AUSTRALIA: 32%
LOWEST
CZECH REPUBLIC: 11%
18 COUNTRY AVERAGE
24%
TABLET AS
MAIN DEVICE
HIGHEST
DENMARK: 20%
LOWEST
POLAND: 3%
18 COUNTRY AVERAGE
10%
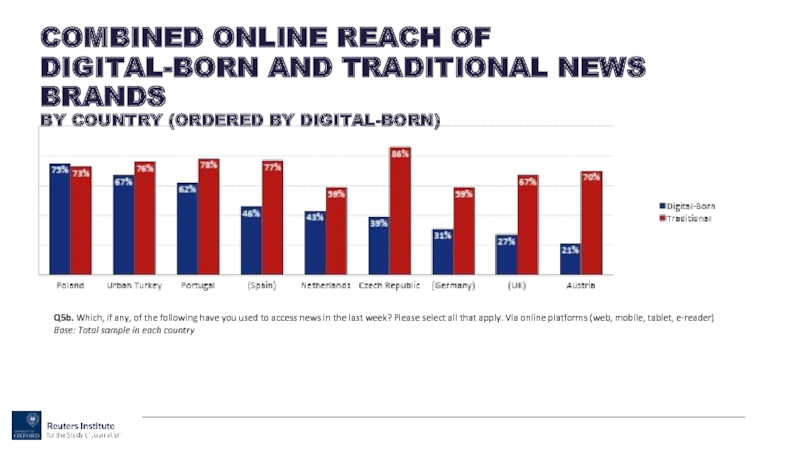
Слайд 10Q5b. Which, if any, of the following have you used to
COMBINED ONLINE REACH OF DIGITAL-BORN AND TRADITIONAL NEWS BRANDS
BY COUNTRY (ORDERED BY DIGITAL-BORN)
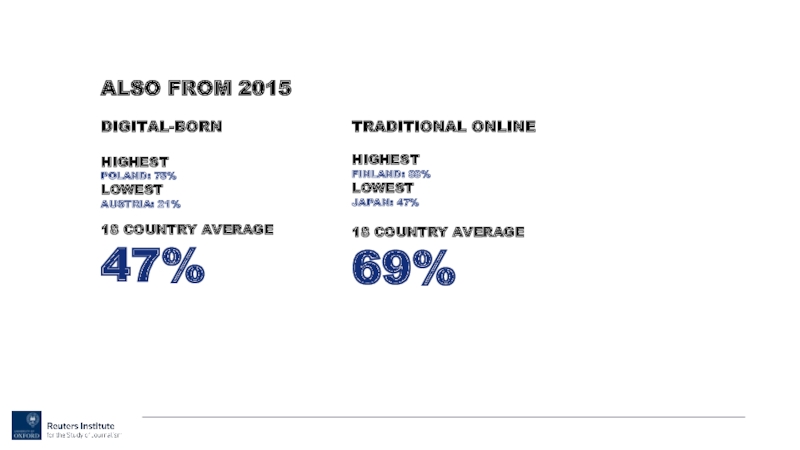
Слайд 11ALSO FROM 2015
DIGITAL-BORN
HIGHEST
POLAND: 75%
LOWEST
AUSTRIA: 21%
18 COUNTRY AVERAGE
47%
TRADITIONAL ONLINE
HIGHEST
FINLAND: 88%
LOWEST
JAPAN: 47%
18 COUNTRY
69%
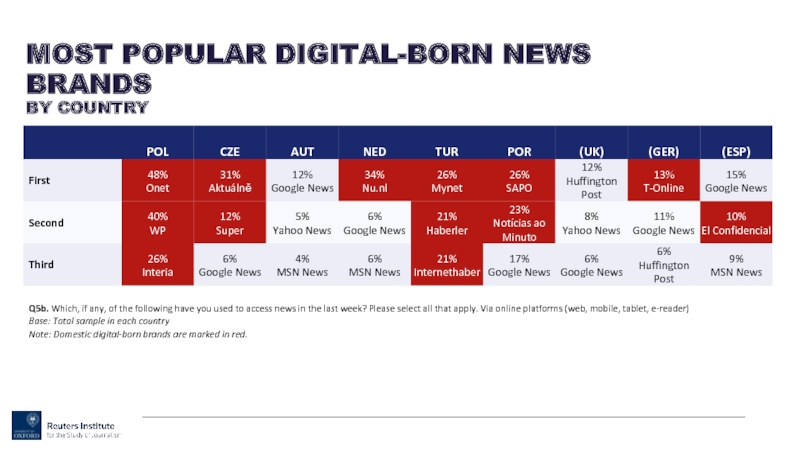
Слайд 13Q5b. Which, if any, of the following have you used to
MOST POPULAR DIGITAL-BORN NEWS BRANDS
BY COUNTRY
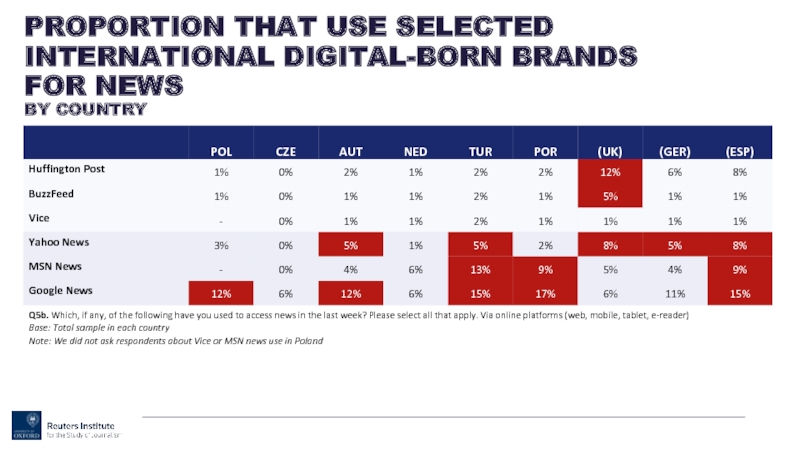
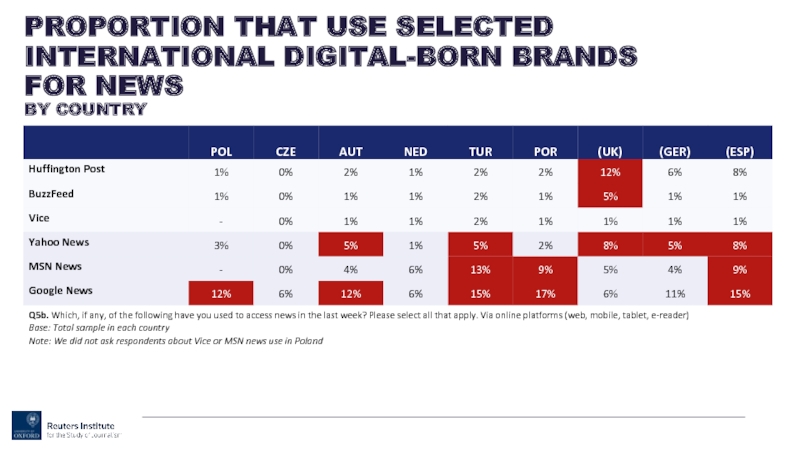
Слайд 14Q5b. Which, if any, of the following have you used to
PROPORTION THAT USE SELECTED INTERNATIONAL DIGITAL-BORN BRANDS FOR NEWS
BY COUNTRY
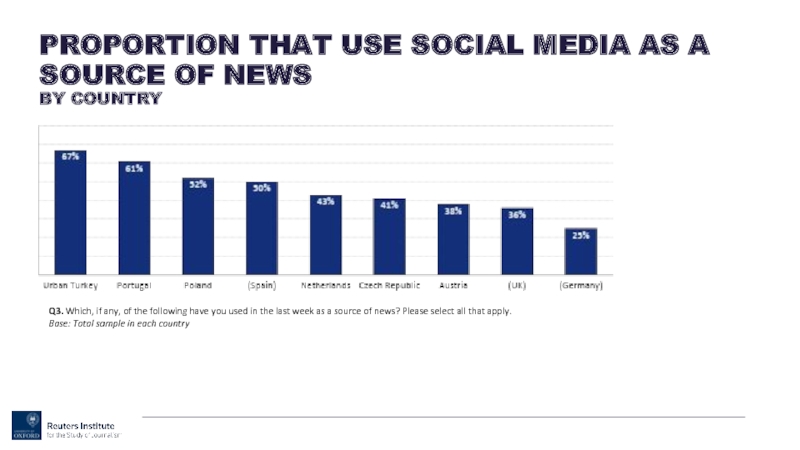
Слайд 15Q3. Which, if any, of the following have you used in
PROPORTION THAT USE SOCIAL MEDIA AS A SOURCE OF NEWS
BY COUNTRY
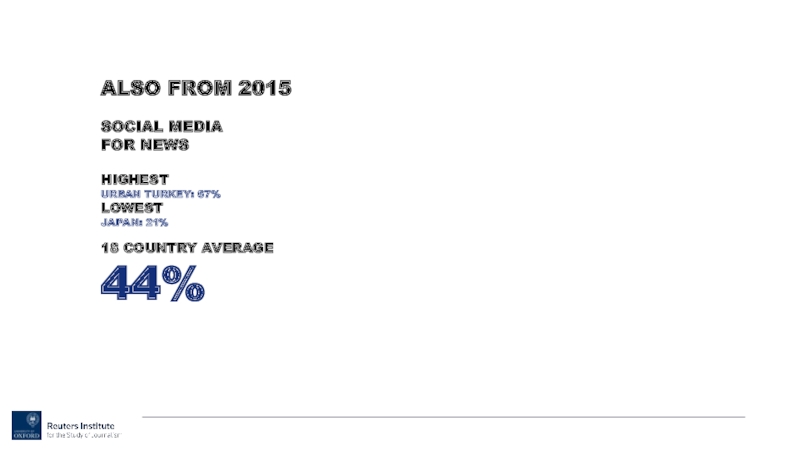
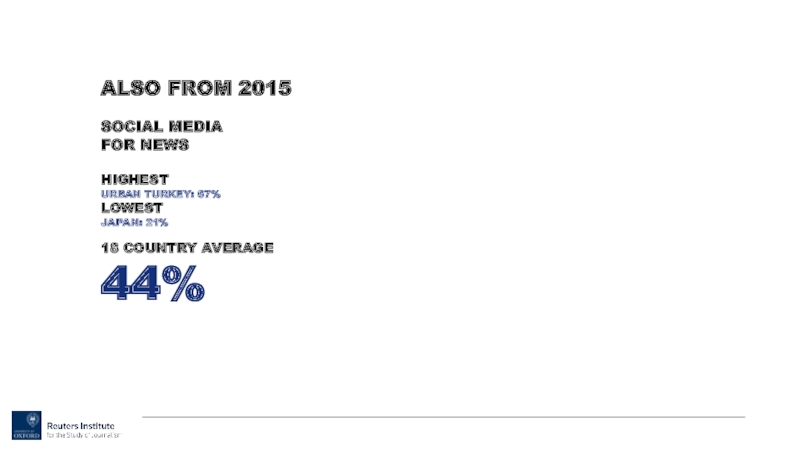
Слайд 16ALSO FROM 2015
SOCIAL MEDIA
FOR NEWS
HIGHEST
URBAN TURKEY: 67%
LOWEST
JAPAN: 21%
18 COUNTRY AVERAGE
44%
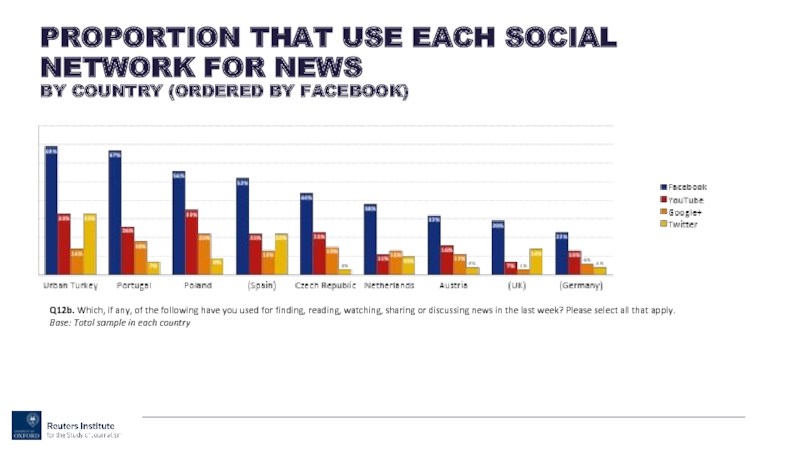
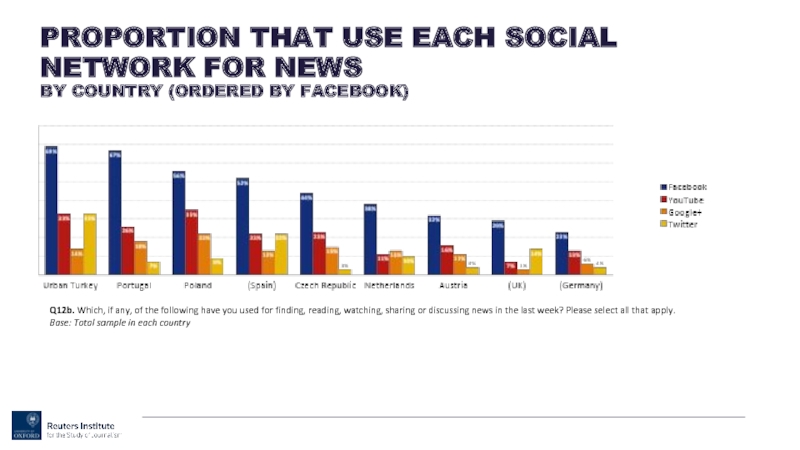
Слайд 17Q12b. Which, if any, of the following have you used for
PROPORTION THAT USE EACH SOCIAL NETWORK FOR NEWS
BY COUNTRY (ORDERED BY FACEBOOK)
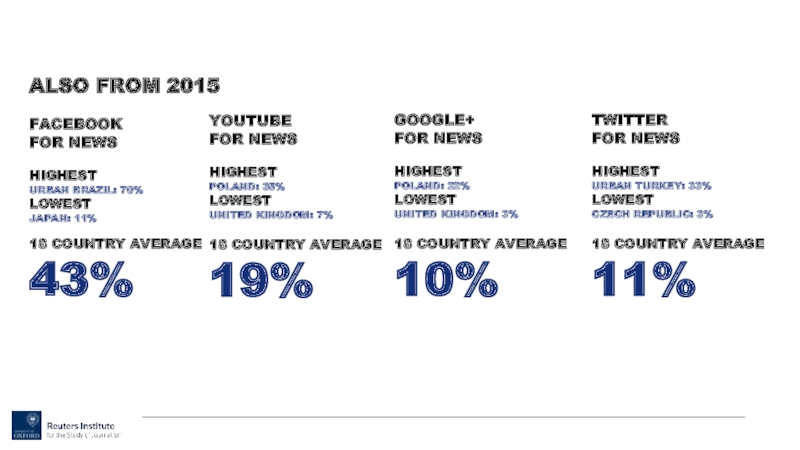
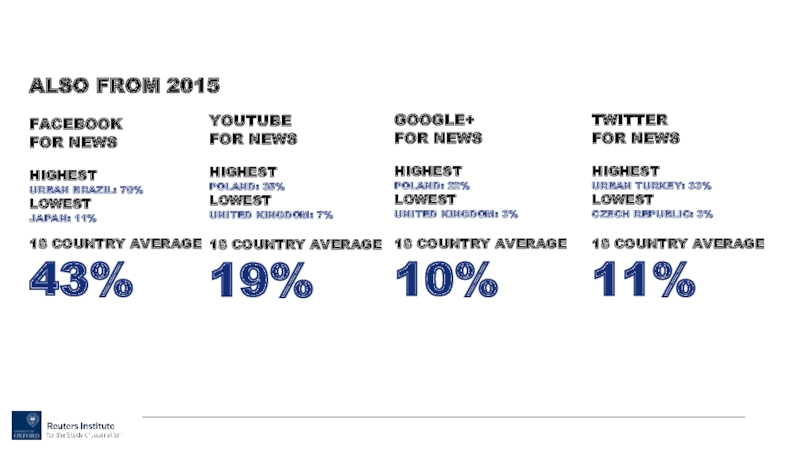
Слайд 18ALSO FROM 2015
FACEBOOK
FOR NEWS
HIGHEST
URBAN BRAZIL: 70%
LOWEST
JAPAN: 11%
18 COUNTRY AVERAGE
43%
YOUTUBE
FOR NEWS
HIGHEST
POLAND: 35%
LOWEST
UNITED
18 COUNTRY AVERAGE
19%
GOOGLE+
FOR NEWS
HIGHEST
POLAND: 22%
LOWEST
UNITED KINGDOM: 3%
18 COUNTRY AVERAGE
10%
TWITTER
FOR NEWS
HIGHEST
URBAN TURKEY: 33%
LOWEST
CZECH REPUBLIC: 3%
18 COUNTRY AVERAGE
11%
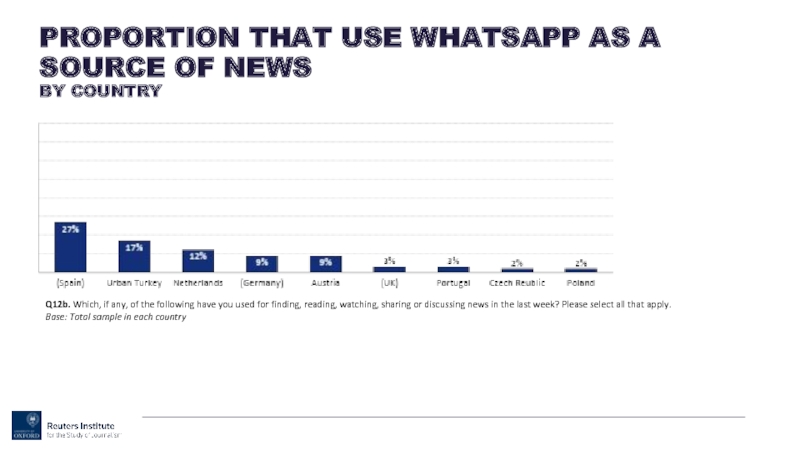
Слайд 19Q12b. Which, if any, of the following have you used for
PROPORTION THAT USE WHATSAPP AS A SOURCE OF NEWS
BY COUNTRY
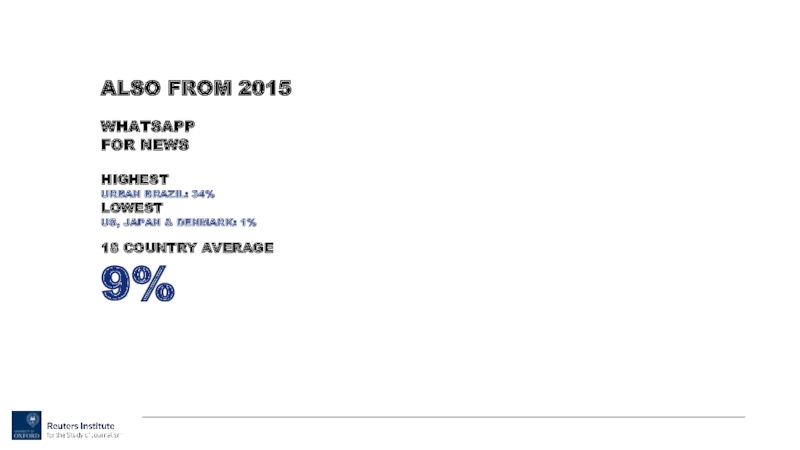
Слайд 20ALSO FROM 2015
WHATSAPP
FOR NEWS
HIGHEST
URBAN BRAZIL: 34%
LOWEST
US, JAPAN & DENMARK: 1%
18 COUNTRY
9%
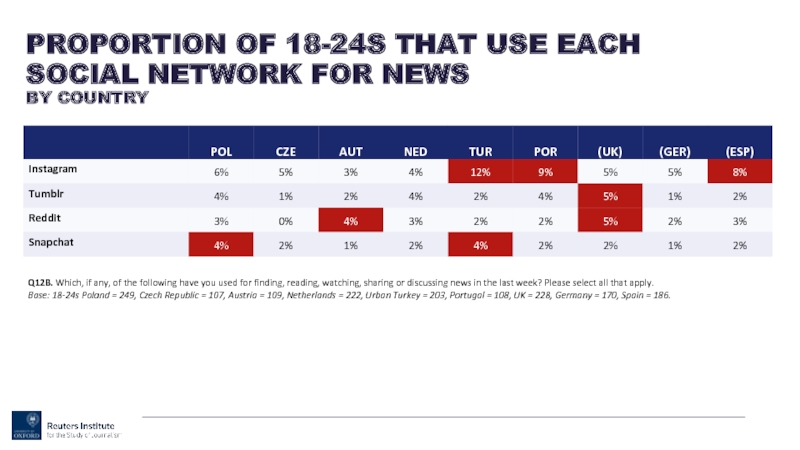
Слайд 21Q12B. Which, if any, of the following have you used for
PROPORTION OF 18-24S THAT USE EACH SOCIAL NETWORK FOR NEWS
BY COUNTRY
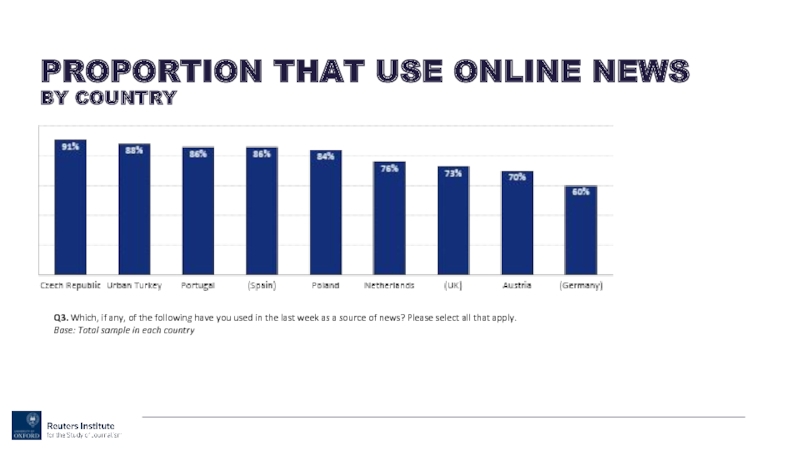
Слайд 22Q3. Which, if any, of the following have you used in
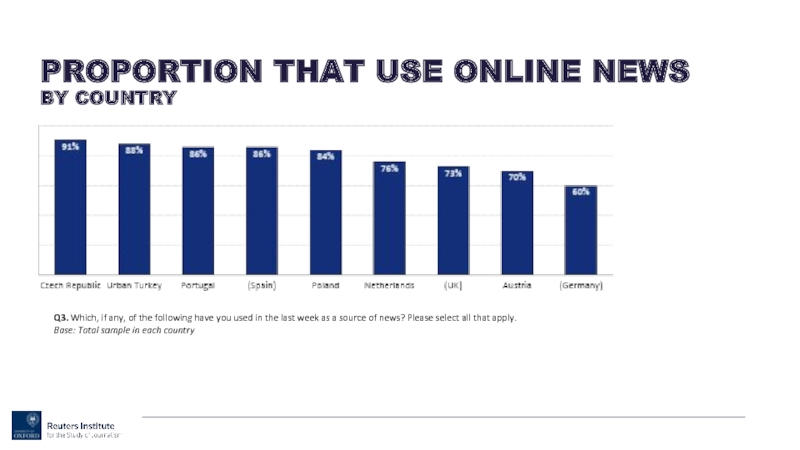
PROPORTION THAT USE ONLINE NEWS
BY COUNTRY
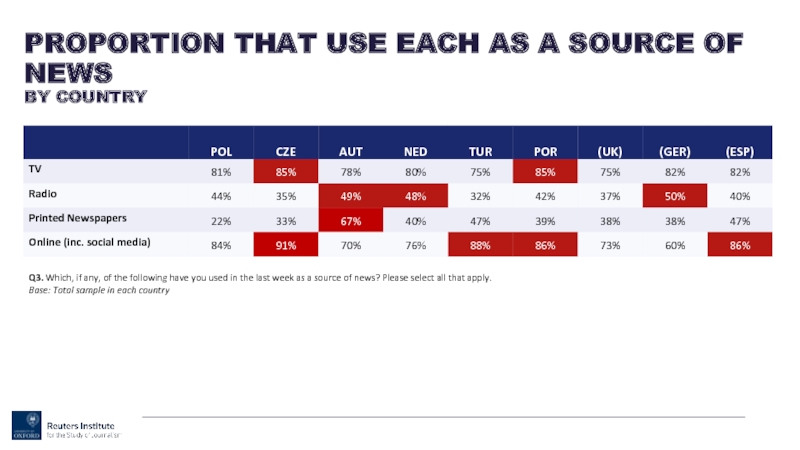
Слайд 23Q3. Which, if any, of the following have you used in
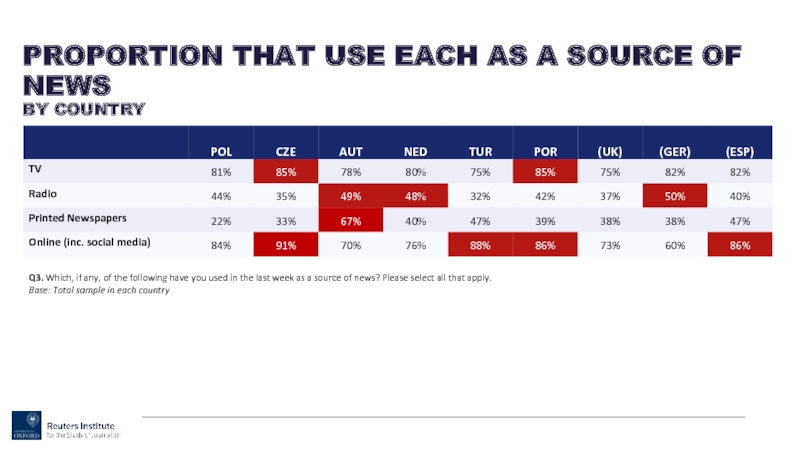
PROPORTION THAT USE EACH AS A SOURCE OF NEWS
BY COUNTRY
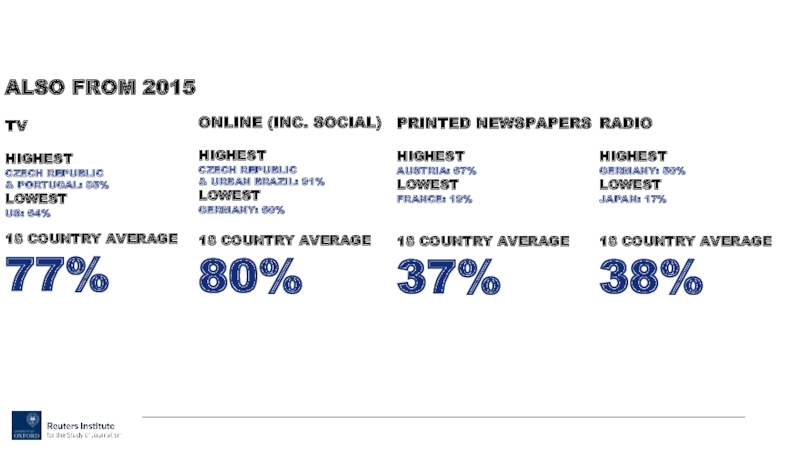
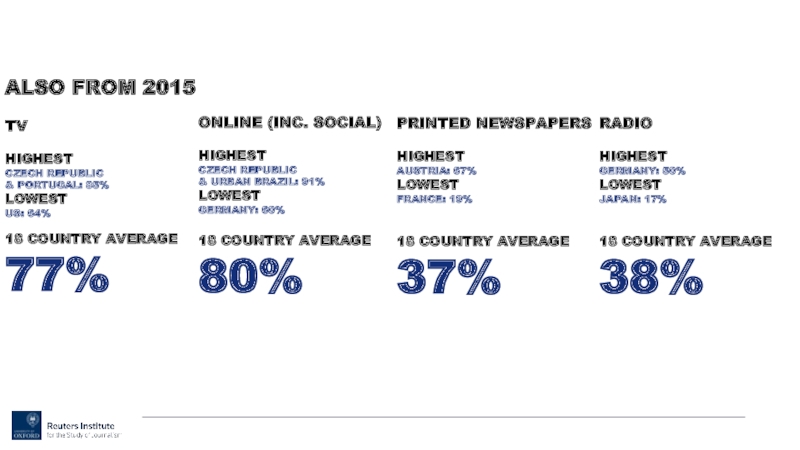
Слайд 24ALSO FROM 2015
TV
HIGHEST
CZECH REPUBLIC
& PORTUGAL: 85%
LOWEST
US: 64%
18 COUNTRY AVERAGE
77%
ONLINE (INC.
HIGHEST CZECH REPUBLIC & URBAN BRAZIL: 91%
LOWEST
GERMANY: 60%
18 COUNTRY AVERAGE
80%
PRINTED NEWSPAPERS
HIGHEST
AUSTRIA: 67%
LOWEST
FRANCE: 19%
18 COUNTRY AVERAGE
37%
RADIO
HIGHEST
GERMANY: 50%
LOWEST
JAPAN: 17%
18 COUNTRY AVERAGE
38%
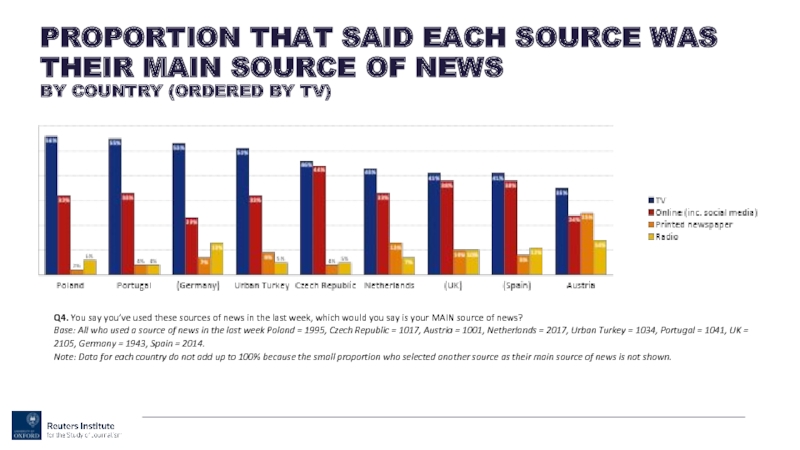
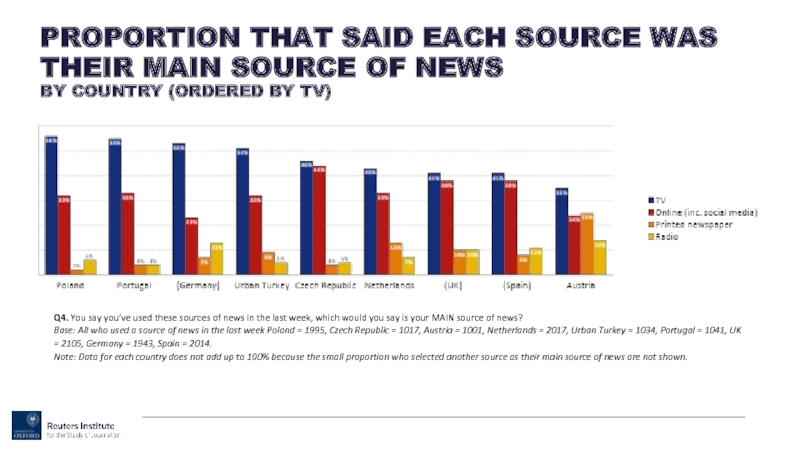
Слайд 25Q4. You say you’ve used these sources of news in the
PROPORTION THAT SAID EACH SOURCE WAS THEIR MAIN SOURCE OF NEWS
BY COUNTRY (ORDERED BY TV)
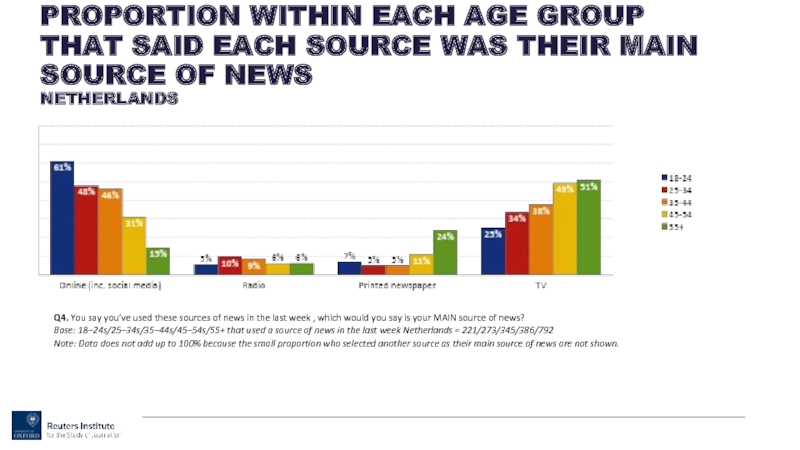
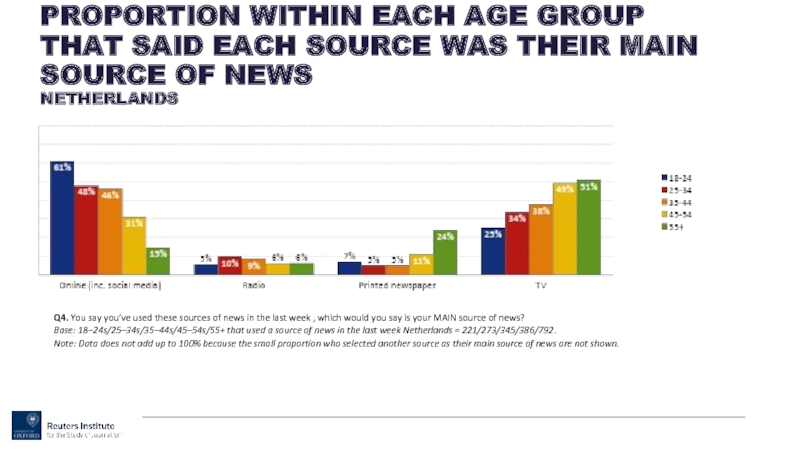
Слайд 26Q4. You say you’ve used these sources of news in the
PROPORTION WITHIN EACH AGE GROUP THAT SAID EACH SOURCE WAS THEIR MAIN SOURCE OF NEWS
NETHERLANDS
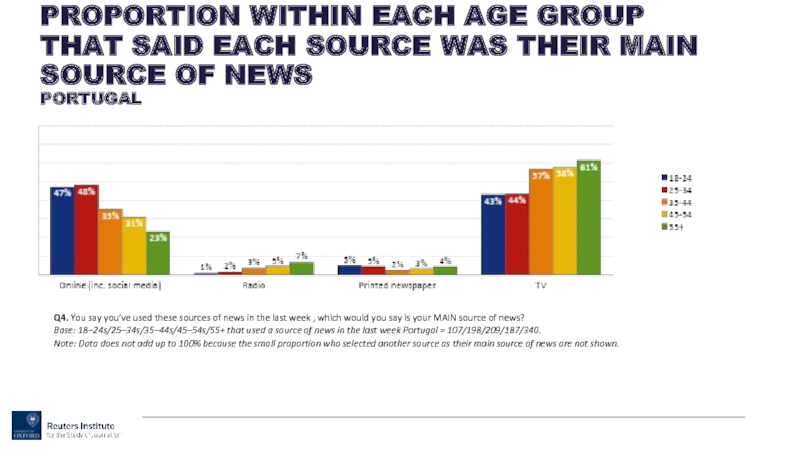
Слайд 27Q4. You say you’ve used these sources of news in the
PROPORTION WITHIN EACH AGE GROUP THAT SAID EACH SOURCE WAS THEIR MAIN SOURCE OF NEWS
PORTUGAL
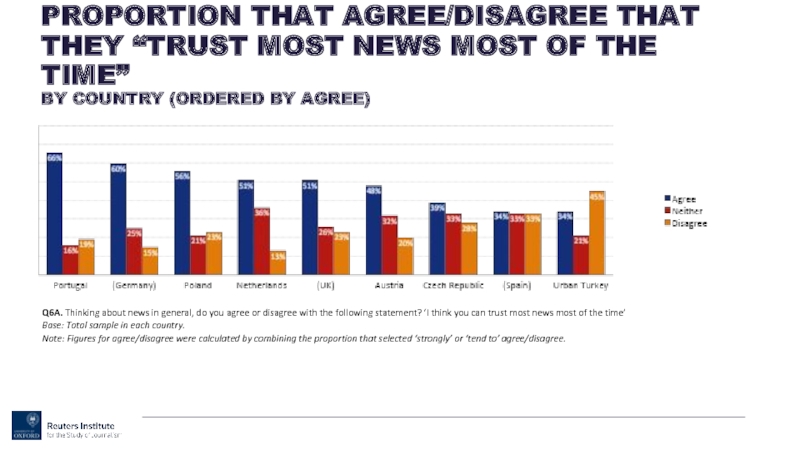
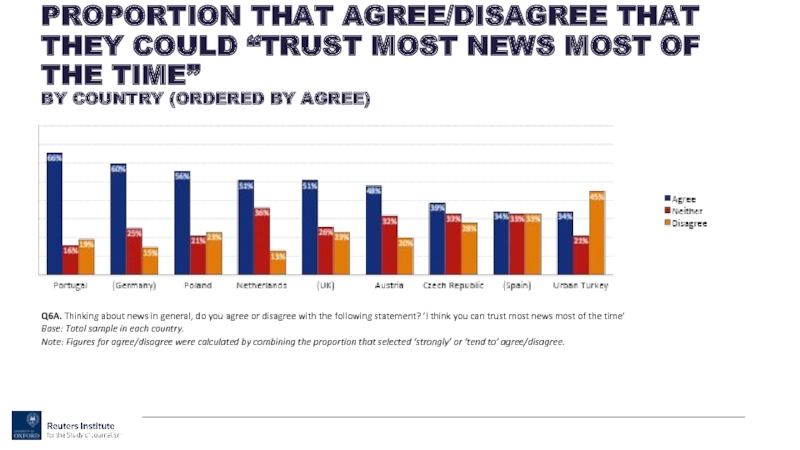
Слайд 28Q6A. Thinking about news in general, do you agree or disagree
PROPORTION THAT AGREE/DISAGREE THAT THEY “TRUST MOST NEWS MOST OF THE TIME”
BY COUNTRY (ORDERED BY AGREE)
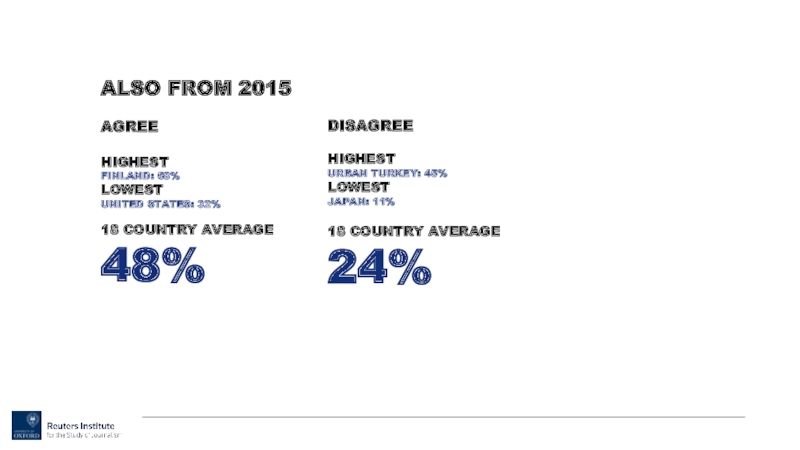
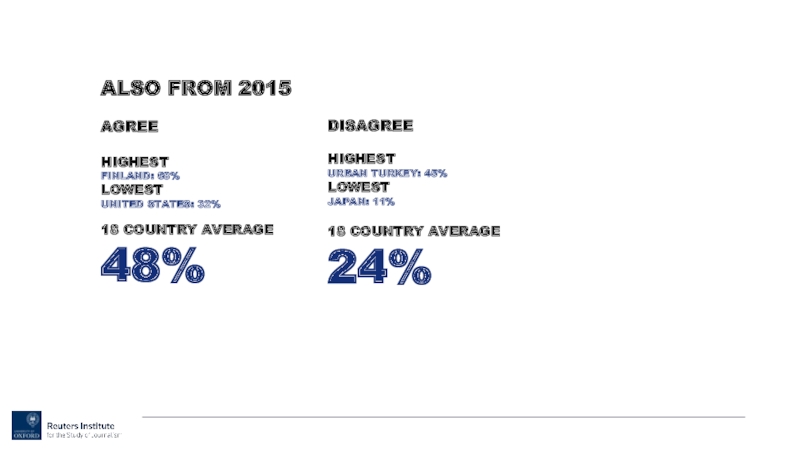
Слайд 29ALSO FROM 2015
AGREE
HIGHEST
FINLAND: 68%
LOWEST
UNITED STATES: 32%
18 COUNTRY AVERAGE
48%
DISAGREE
HIGHEST
URBAN TURKEY: 45%
LOWEST
JAPAN: 11%
18
24%
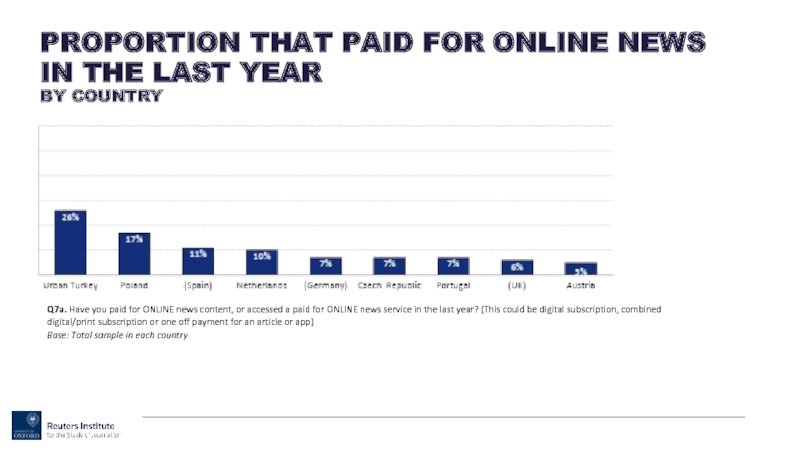
Слайд 30Q7a. Have you paid for ONLINE news content, or accessed a
PROPORTION THAT PAID FOR ONLINE NEWS IN THE LAST YEAR
BY COUNTRY
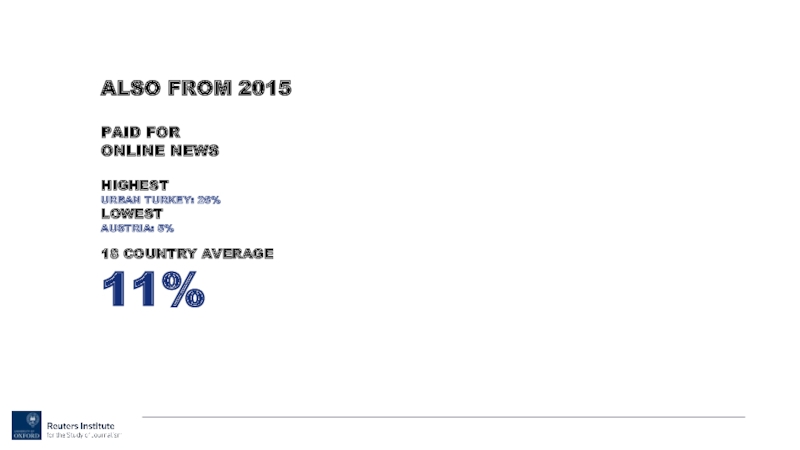
Слайд 31ALSO FROM 2015
PAID FOR
ONLINE NEWS
HIGHEST
URBAN TURKEY: 26%
LOWEST
AUSTRIA: 5%
18 COUNTRY AVERAGE
11%
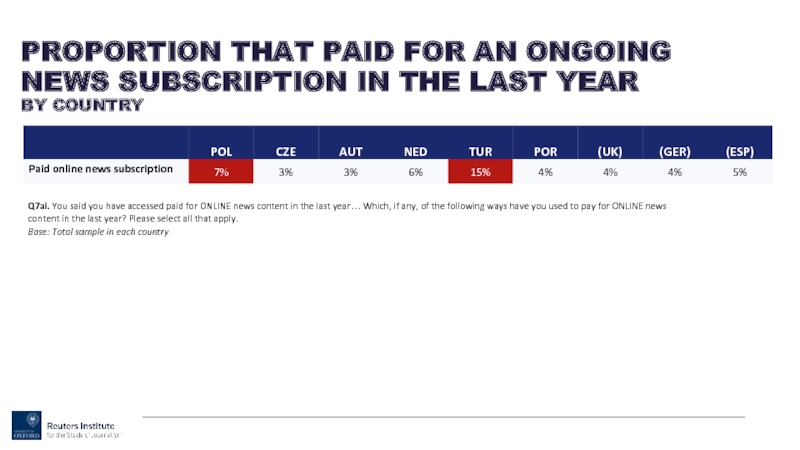
Слайд 32Q7ai. You said you have accessed paid for ONLINE news content
PROPORTION THAT PAID FOR AN ONGOING NEWS SUBSCRIPTION IN THE LAST YEAR
BY COUNTRY
Слайд 41Q5b. Which, if any, of the following have you used to
ONLINE REACH OF EACH BRAND TYPE
BY COUNTRY (ORDERED BY DIGITAL-BORN)
Слайд 42ALSO FROM 2015
DIGITAL-BORN
HIGHEST
POLAND: 75%
LOWEST
AUSTRIA: 21%
18 COUNTRY AVERAGE
47%
NEWSPAPER ONLINE
HIGHEST
FINLAND: 79%
LOWEST
JAPAN: 32%
18 COUNTRY
52%
BROADCASTER ONLINE
HIGHEST
URBAN BRAZIL: 72%
LOWEST
AUSTRIA: 23%
18 COUNTRY AVERAGE
44%
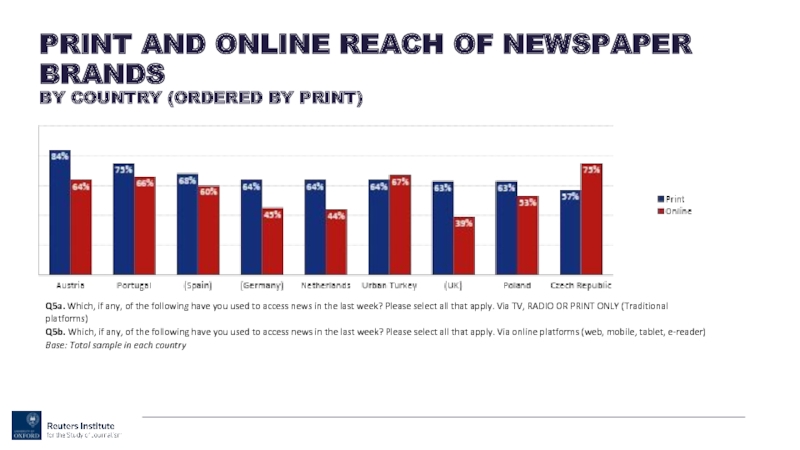
Слайд 43Q5a. Which, if any, of the following have you used to
PRINT AND ONLINE REACH OF NEWSPAPER BRANDS
BY COUNTRY (ORDERED BY PRINT)
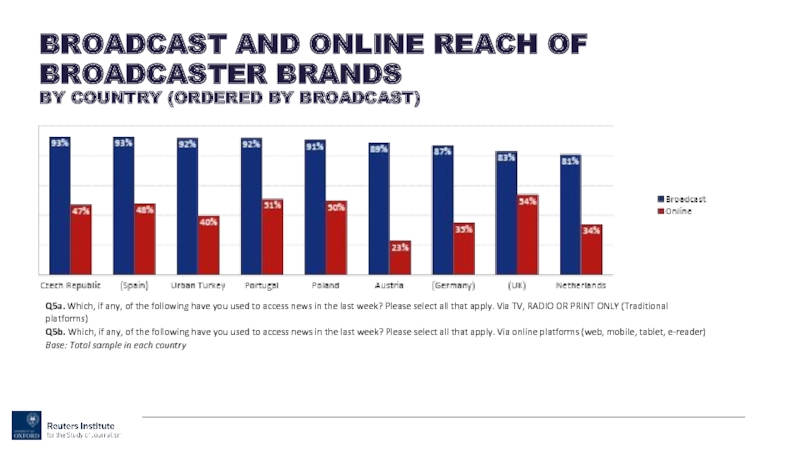
Слайд 44Q5a. Which, if any, of the following have you used to
BROADCAST AND ONLINE REACH OF BROADCASTER BRANDS
BY COUNTRY (ORDERED BY BROADCAST)
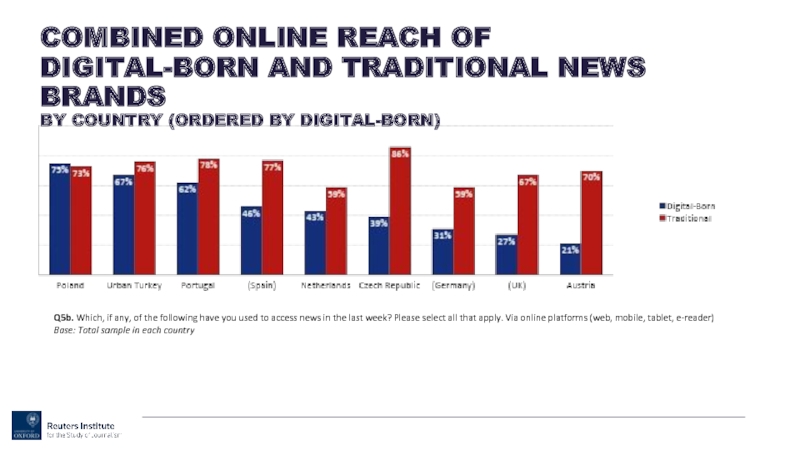
Слайд 45Q5b. Which, if any, of the following have you used to
COMBINED ONLINE REACH OF DIGITAL-BORN AND TRADITIONAL NEWS BRANDS
BY COUNTRY (ORDERED BY DIGITAL-BORN)
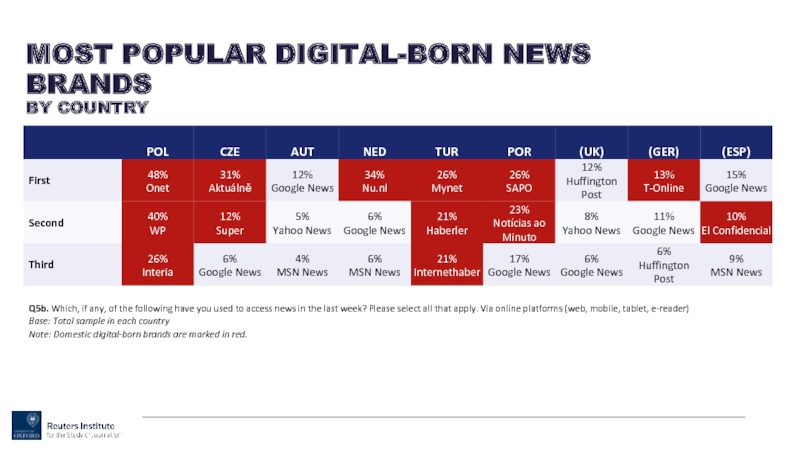
Слайд 46Q5b. Which, if any, of the following have you used to
MOST POPULAR DIGITAL-BORN NEWS BRANDS
BY COUNTRY
Слайд 49Q5b. Which, if any, of the following have you used to
PROPORTION THAT USE SELECTED INTERNATIONAL DIGITAL-BORN BRANDS FOR NEWS
BY COUNTRY
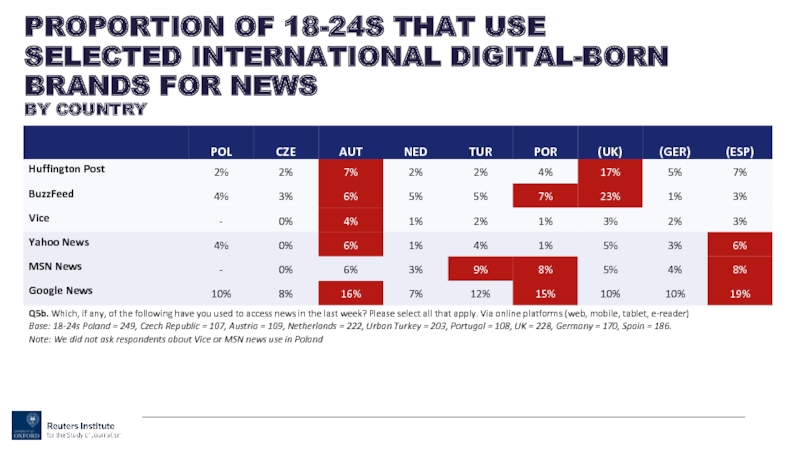
Слайд 50Q5b. Which, if any, of the following have you used to
PROPORTION OF 18-24S THAT USE SELECTED INTERNATIONAL DIGITAL-BORN BRANDS FOR NEWS
BY COUNTRY
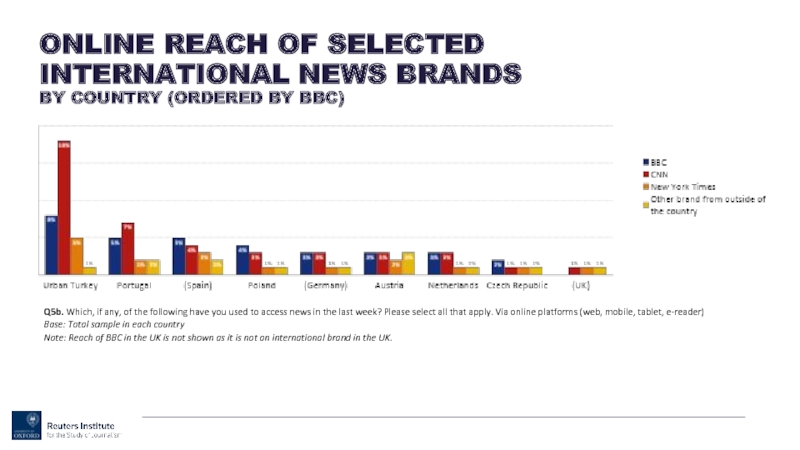
Слайд 51Q5b. Which, if any, of the following have you used to
ONLINE REACH OF SELECTED INTERNATIONAL NEWS BRANDS
BY COUNTRY (ORDERED BY BBC)
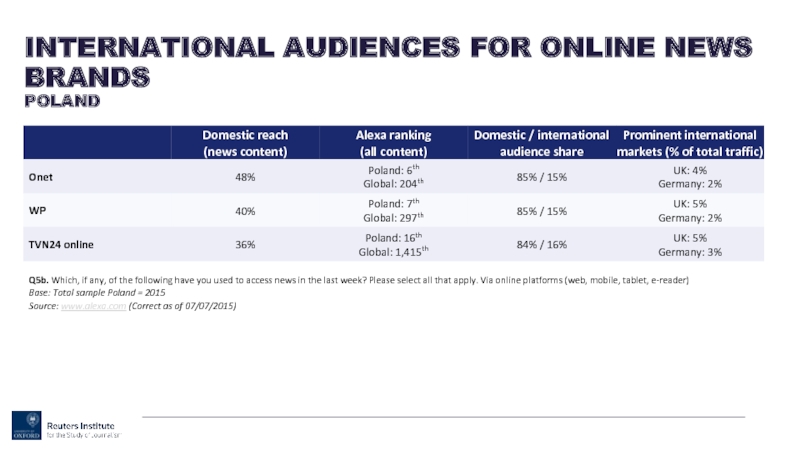
Слайд 52Q5b. Which, if any, of the following have you used to
INTERNATIONAL AUDIENCES FOR ONLINE NEWS BRANDS
POLAND
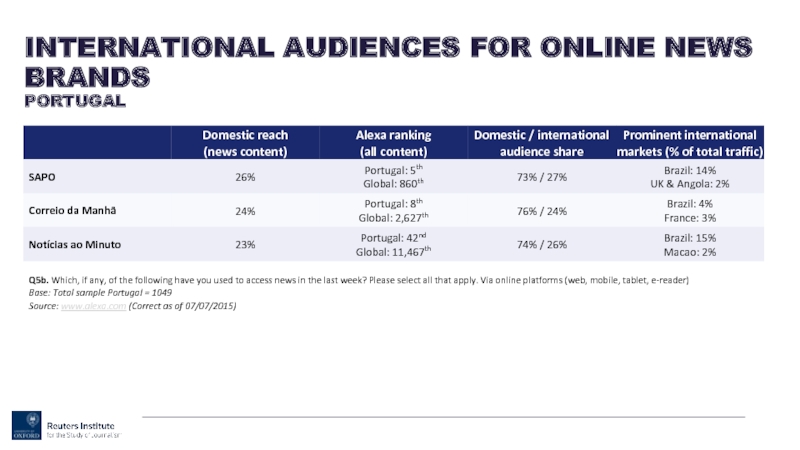
Слайд 53Q5b. Which, if any, of the following have you used to
INTERNATIONAL AUDIENCES FOR ONLINE NEWS BRANDS
PORTUGAL
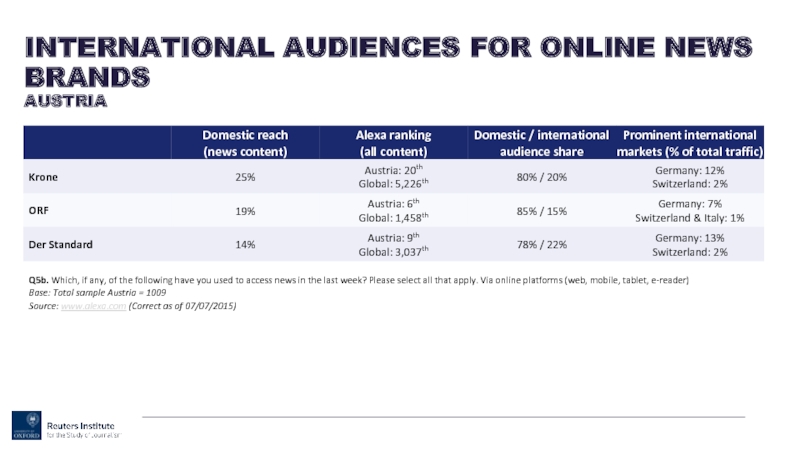
Слайд 54Q5b. Which, if any, of the following have you used to
INTERNATIONAL AUDIENCES FOR ONLINE NEWS BRANDS
AUSTRIA
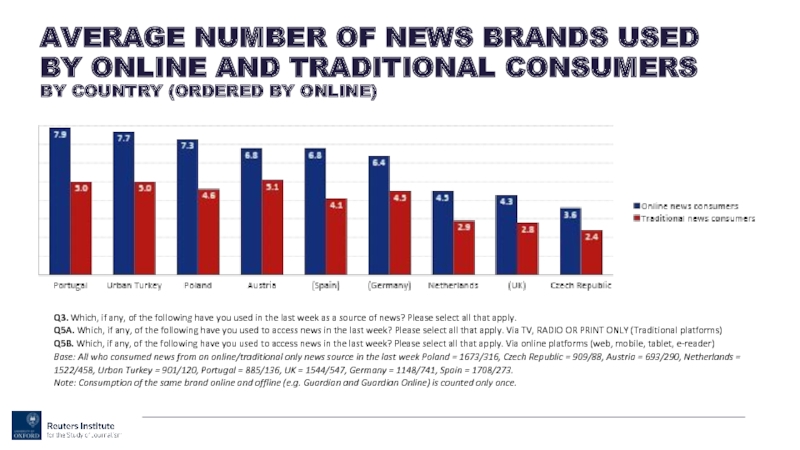
Слайд 55Q3. Which, if any, of the following have you used in
AVERAGE NUMBER OF NEWS BRANDS USED BY ONLINE AND TRADITIONAL CONSUMERS
BY COUNTRY (ORDERED BY ONLINE)
Слайд 57Q3. Which, if any, of the following have you used in
PROPORTION THAT USE ONLINE NEWS
BY COUNTRY
Слайд 58Q3. Which, if any, of the following have you used in
PROPORTION THAT USE EACH AS A SOURCE OF NEWS
BY COUNTRY
Слайд 59ALSO FROM 2015
TV
HIGHEST
CZECH REPUBLIC
& PORTUGAL: 85%
LOWEST
US: 64%
18 COUNTRY AVERAGE
77%
ONLINE (INC.
HIGHEST CZECH REPUBLIC & URBAN BRAZIL: 91%
LOWEST
GERMANY: 60%
18 COUNTRY AVERAGE
80%
PRINTED NEWSPAPERS
HIGHEST
AUSTRIA: 67%
LOWEST
FRANCE: 19%
18 COUNTRY AVERAGE
37%
RADIO
HIGHEST
GERMANY: 50%
LOWEST
JAPAN: 17%
18 COUNTRY AVERAGE
38%
Слайд 60Q4. You say you’ve used these sources of news in the
PROPORTION THAT SAID EACH SOURCE WAS THEIR MAIN SOURCE OF NEWS
BY COUNTRY (ORDERED BY TV)
Слайд 61Q4. You say you’ve used these sources of news in the
PROPORTION WITHIN EACH AGE GROUP THAT SAID EACH SOURCE WAS THEIR MAIN SOURCE OF NEWS
NETHERLANDS
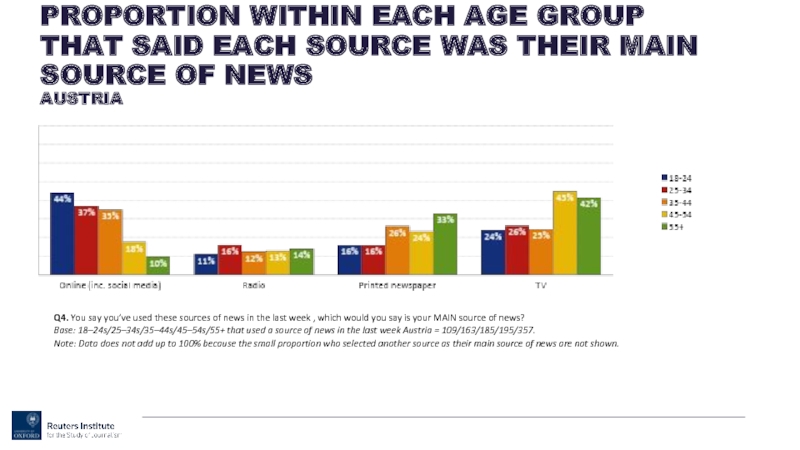
Слайд 62Q4. You say you’ve used these sources of news in the
PROPORTION WITHIN EACH AGE GROUP THAT SAID EACH SOURCE WAS THEIR MAIN SOURCE OF NEWS
AUSTRIA
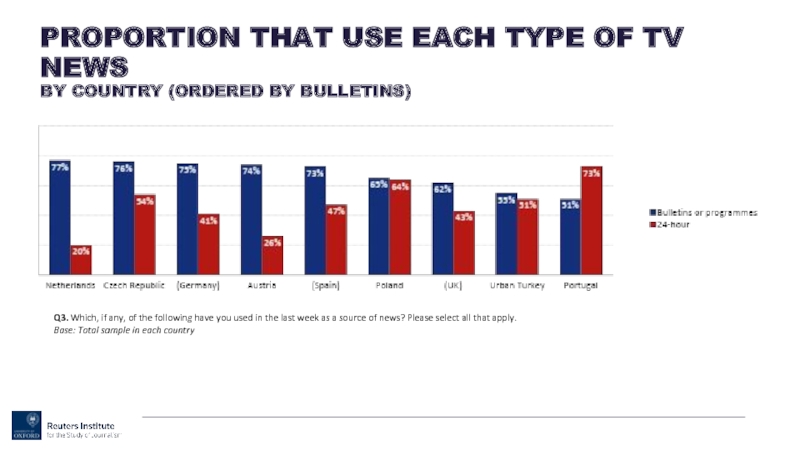
Слайд 63Q3. Which, if any, of the following have you used in
PROPORTION THAT USE EACH TYPE OF TV NEWS
BY COUNTRY (ORDERED BY BULLETINS)
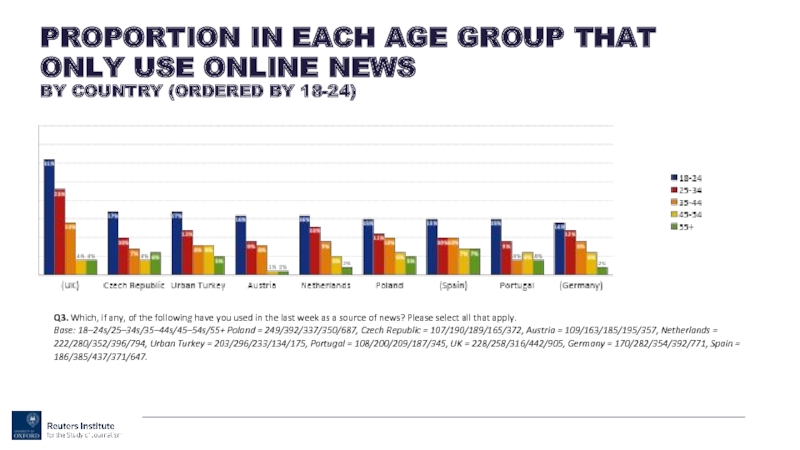
Слайд 64Q3. Which, if any, of the following have you used in
PROPORTION IN EACH AGE GROUP THAT ONLY USE ONLINE NEWS
BY COUNTRY (ORDERED BY 18-24)
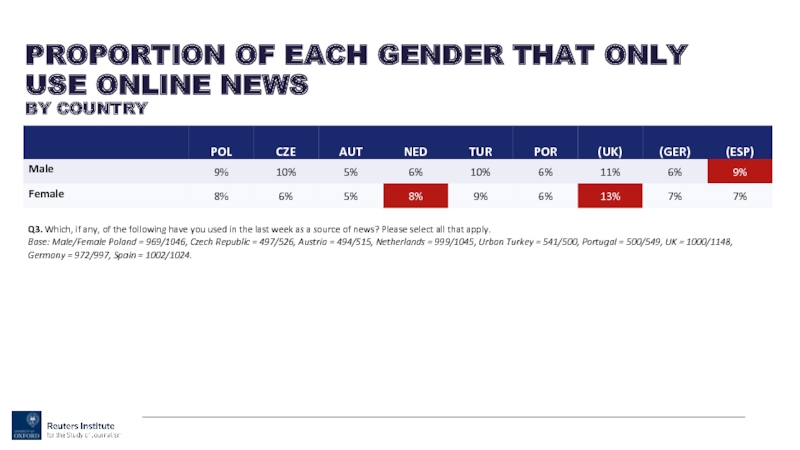
Слайд 65Q3. Which, if any, of the following have you used in
PROPORTION OF EACH GENDER THAT ONLY USE ONLINE NEWS
BY COUNTRY
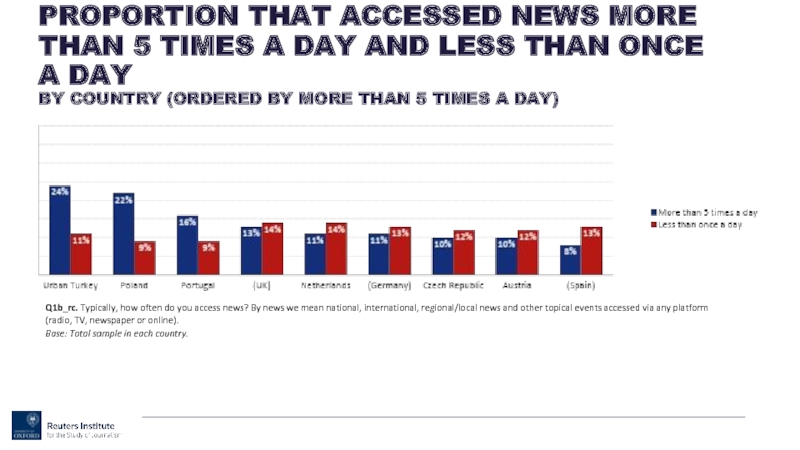
Слайд 67Q1b_rc. Typically, how often do you access news? By news we
PROPORTION THAT ACCESSED NEWS MORE THAN 5 TIMES A DAY AND LESS THAN ONCE A DAY
BY COUNTRY (ORDERED BY MORE THAN 5 TIMES A DAY)
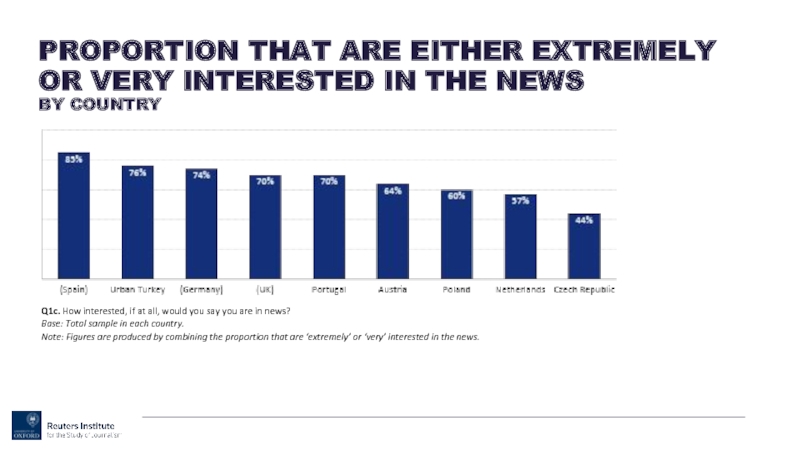
Слайд 68Q1c. How interested, if at all, would you say you are
PROPORTION THAT ARE EITHER EXTREMELY OR VERY INTERESTED IN THE NEWS
BY COUNTRY
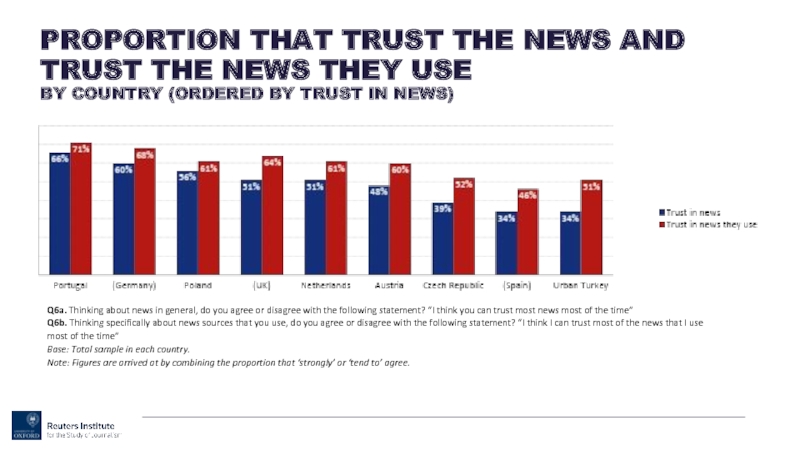
Слайд 70Q6a. Thinking about news in general, do you agree or disagree
PROPORTION THAT TRUST THE NEWS AND TRUST THE NEWS THEY USE
BY COUNTRY (ORDERED BY TRUST IN NEWS)
Слайд 71Q6A. Thinking about news in general, do you agree or disagree
PROPORTION THAT AGREE/DISAGREE THAT THEY COULD “TRUST MOST NEWS MOST OF THE TIME”
BY COUNTRY (ORDERED BY AGREE)
Слайд 72ALSO FROM 2015
AGREE
HIGHEST
FINLAND: 68%
LOWEST
UNITED STATES: 32%
18 COUNTRY AVERAGE
48%
DISAGREE
HIGHEST
URBAN TURKEY: 45%
LOWEST
JAPAN: 11%
18
24%
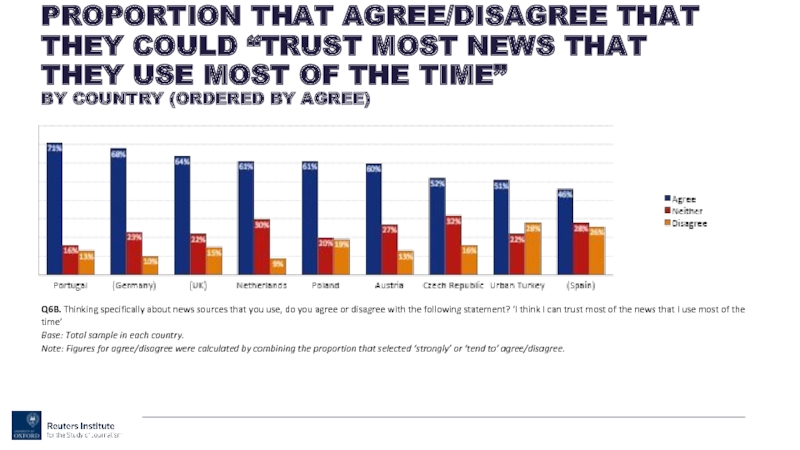
Слайд 73Q6B. Thinking specifically about news sources that you use, do you
PROPORTION THAT AGREE/DISAGREE THAT THEY COULD “TRUST MOST NEWS THAT THEY USE MOST OF THE TIME”
BY COUNTRY (ORDERED BY AGREE)
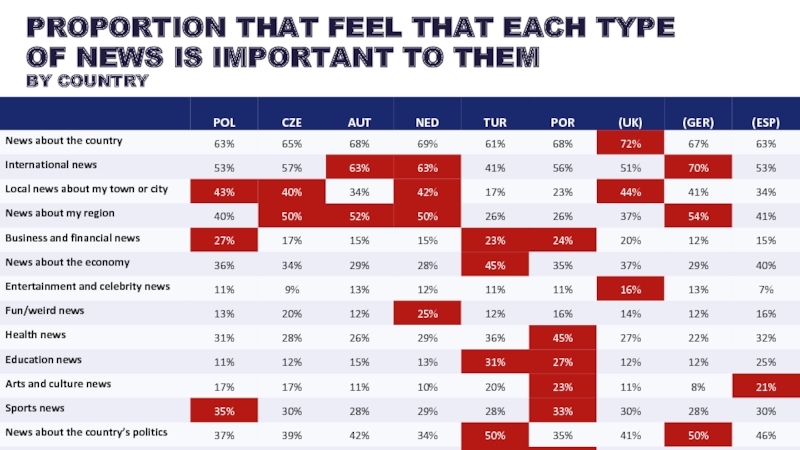
Слайд 75Q13. During an average week in which, if any, of the
PROPORTION THAT FEEL THAT EACH TYPE OF NEWS IS IMPORTANT TO THEM
BY COUNTRY
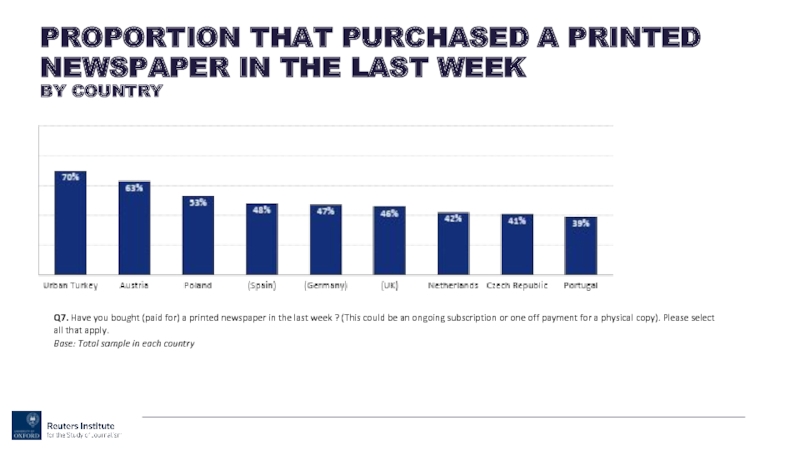
Слайд 77Q7. Have you bought (paid for) a printed newspaper in the
PROPORTION THAT PURCHASED A PRINTED NEWSPAPER IN THE LAST WEEK
BY COUNTRY
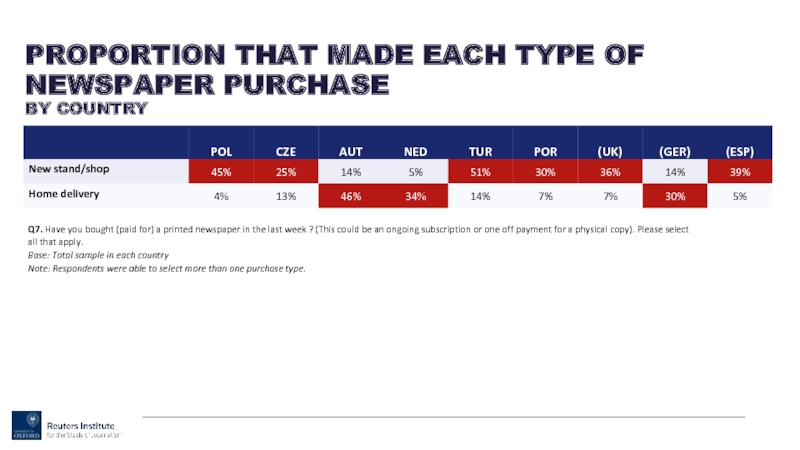
Слайд 78Q7. Have you bought (paid for) a printed newspaper in the
PROPORTION THAT MADE EACH TYPE OF NEWSPAPER PURCHASE
BY COUNTRY
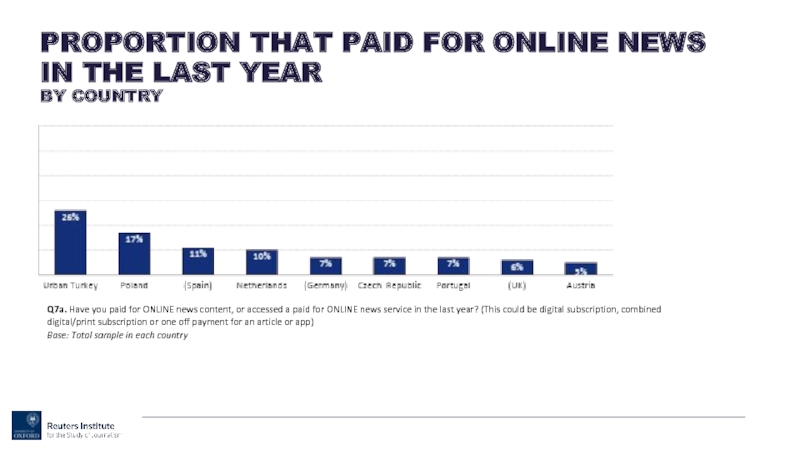
Слайд 79Q7a. Have you paid for ONLINE news content, or accessed a
PROPORTION THAT PAID FOR ONLINE NEWS IN THE LAST YEAR
BY COUNTRY
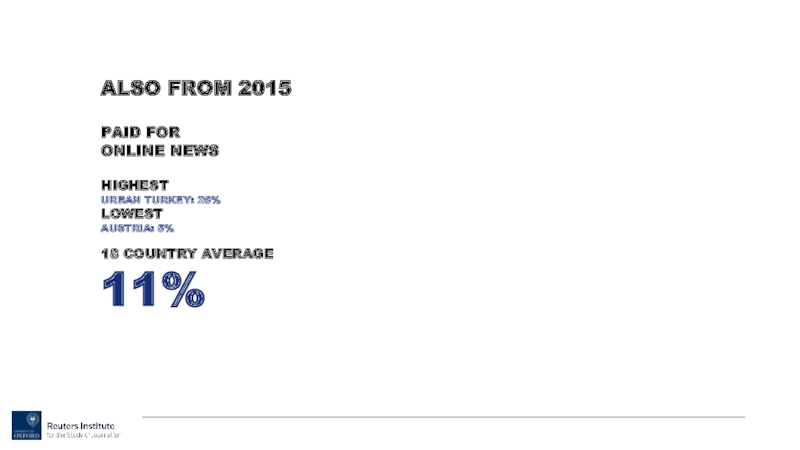
Слайд 80ALSO FROM 2015
PAID FOR
ONLINE NEWS
HIGHEST
URBAN TURKEY: 26%
LOWEST
AUSTRIA: 5%
18 COUNTRY AVERAGE
11%
Слайд 82Q7ai. You said you have accessed paid for ONLINE news content
PROPORTION THAT PAID FOR AN ONGOING NEWS SUBSCRIPTION IN THE LAST YEAR
BY COUNTRY
Слайд 83Q7a. Have you paid for ONLINE news content, or accessed a
PROPORTION OF UNDER 45S AND 45S AND OVER WHO PAID FOR ONLINE NEWS IN THE LAST YEAR
BY COUNTRY (ORDERED BY DIFFERENCE)
Слайд 84Q7a. Have you paid for ONLINE news content, or accessed a
PROPORTION OF EACH GENDER THAT PAID FOR ONLINE NEWS IN THE LAST YEAR
BY COUNTRY
Слайд 85Q7aii. You said you have not paid for online digital content
PROPORTION THAT SAID THEY WERE LIKELY TO PAY FOR ONLINE NEWS IN THE FUTURE
BY COUNTRY
Слайд 87Q8B. Which, if any, of the following devices have you used
PROPORTION THAT USE EACH DIGITAL DEVICE TO ACCESS NEWS
BY COUNTRY
Слайд 88ALSO FROM 2015
COMPUTER
FOR NEWS
HIGHEST
CZECH REPUBLIC: 83%
LOWEST
GERMANY: 57%
18 COUNTRY AVERAGE
68%
SMARTPHONE
FOR NEWS
HIGHEST
AUSTRALIA: 59%
LOWEST
JAPAN:
18 COUNTRY AVERAGE
45%
TABLET
FOR NEWS
HIGHEST
DENMARK: 39%
LOWEST
JAPAN: 13%
18 COUNTRY AVERAGE
23%
Слайд 89UK8b6_5. You’ve said you use the following devices to access news
PROPORTION THAT SAID EACH DEVICE WAS THEIR MAIN DIGITAL NEWS DEVICE
BY COUNTRY (ORDERED BY COMPUTER)
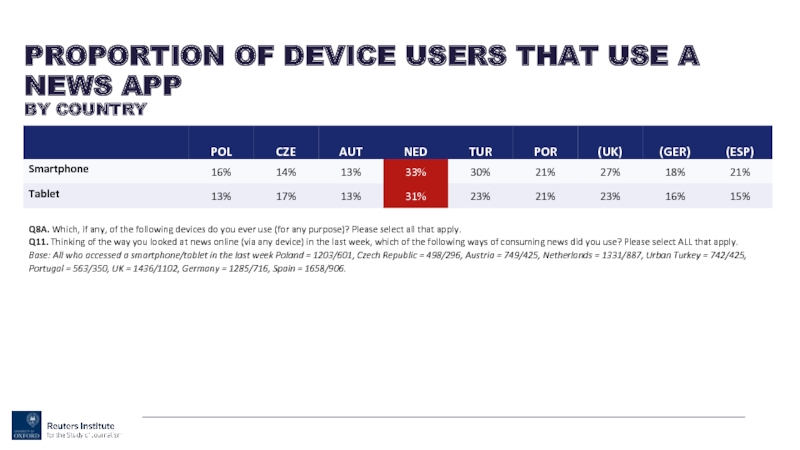
Слайд 90Q8A. Which, if any, of the following devices do you ever
PROPORTION OF DEVICE USERS THAT USE A NEWS APP
BY COUNTRY
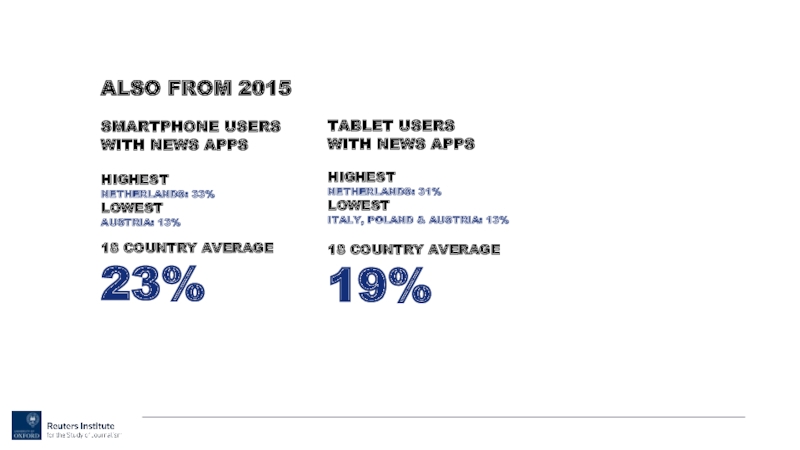
Слайд 91ALSO FROM 2015
SMARTPHONE USERS
WITH NEWS APPS
HIGHEST
NETHERLANDS: 33%
LOWEST
AUSTRIA: 13%
18 COUNTRY AVERAGE
23%
TABLET USERS
WITH
HIGHEST NETHERLANDS: 31%
LOWEST
ITALY, POLAND & AUSTRIA: 13%
18 COUNTRY AVERAGE
19%
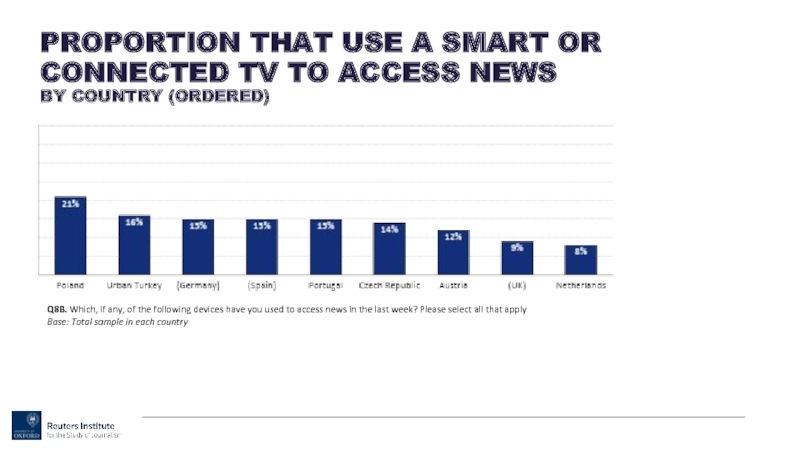
Слайд 92Q8B. Which, if any, of the following devices have you used
PROPORTION THAT USE A SMART OR CONNECTED TV TO ACCESS NEWS
BY COUNTRY (ORDERED)
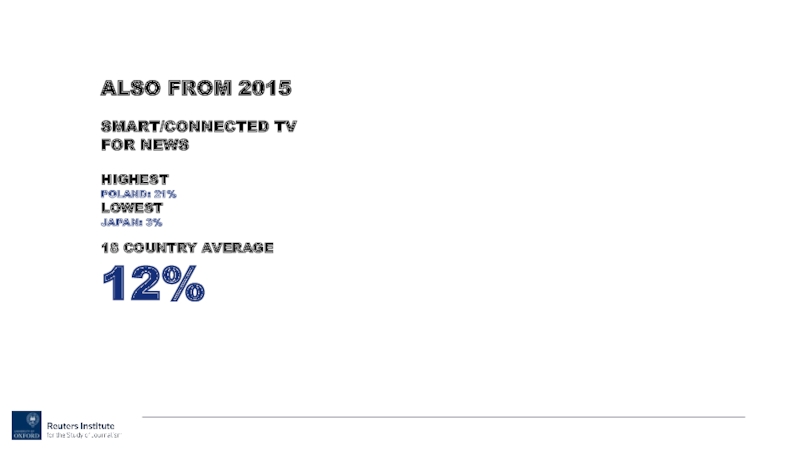
Слайд 93ALSO FROM 2015
SMART/CONNECTED TV
FOR NEWS
HIGHEST
POLAND: 21%
LOWEST
JAPAN: 3%
18 COUNTRY AVERAGE
12%
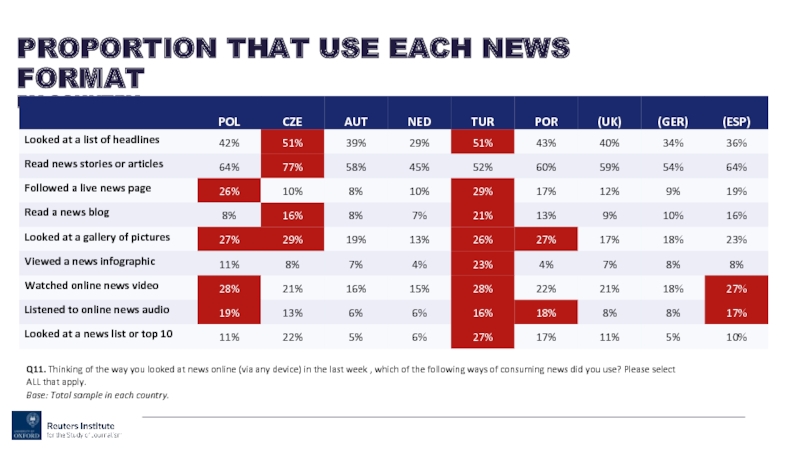
Слайд 95Q11. Thinking of the way you looked at news online (via
PROPORTION THAT USE EACH NEWS FORMAT
BY COUNTRY
Слайд 96Q11. Thinking of the way you looked at news online (via
PROPORTION THAT USE ONLINE NEWS VIDEO
BY COUNTRY
Слайд 97ALSO FROM 2015
ONLINE NEWS VIDEO
HIGHEST
US: 30%
LOWEST
JAPAN & NETHERLANDS: 15%
18 COUNTRY AVERAGE
23%
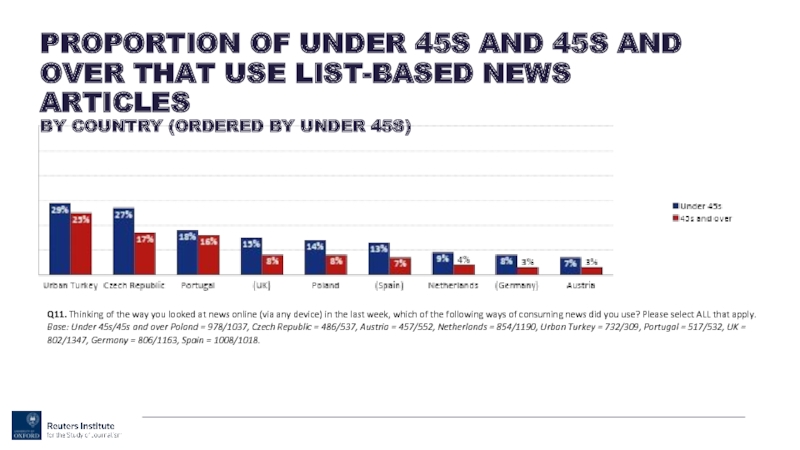
Слайд 98Q11. Thinking of the way you looked at news online (via
PROPORTION OF UNDER 45S AND 45S AND OVER THAT USE LIST-BASED NEWS ARTICLES
BY COUNTRY (ORDERED BY UNDER 45S)
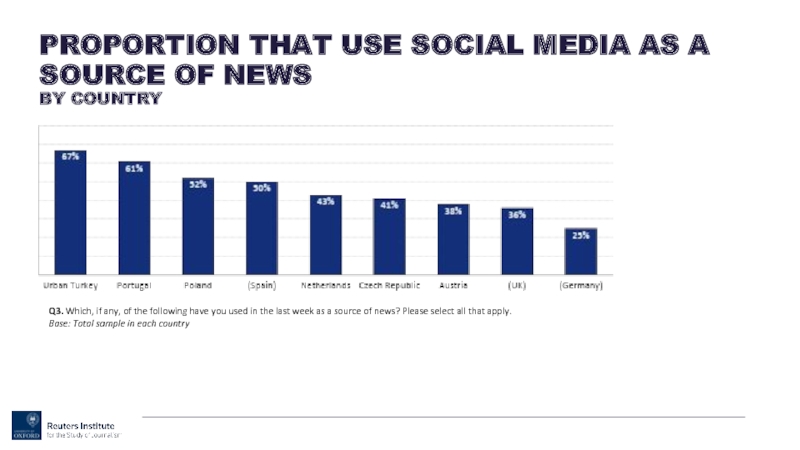
Слайд 100Q3. Which, if any, of the following have you used in
PROPORTION THAT USE SOCIAL MEDIA AS A SOURCE OF NEWS
BY COUNTRY
Слайд 101ALSO FROM 2015
SOCIAL MEDIA
FOR NEWS
HIGHEST
URBAN TURKEY: 67%
LOWEST
JAPAN: 21%
18 COUNTRY AVERAGE
44%
Слайд 102Q12b. Which, if any, of the following have you used for
PROPORTION THAT USE EACH SOCIAL NETWORK FOR NEWS
BY COUNTRY (ORDERED BY FACEBOOK)
Слайд 103ALSO FROM 2015
FACEBOOK
FOR NEWS
HIGHEST
URBAN BRAZIL: 70%
LOWEST
JAPAN: 11%
18 COUNTRY AVERAGE
43%
YOUTUBE
FOR NEWS
HIGHEST
POLAND: 35%
LOWEST
UNITED
18 COUNTRY AVERAGE
19%
GOOGLE+
FOR NEWS
HIGHEST
POLAND: 22%
LOWEST
UNITED KINGDOM: 3%
18 COUNTRY AVERAGE
10%
TWITTER
FOR NEWS
HIGHEST
URBAN TURKEY: 33%
LOWEST
CZECH REPUBLIC: 3%
18 COUNTRY AVERAGE
11%
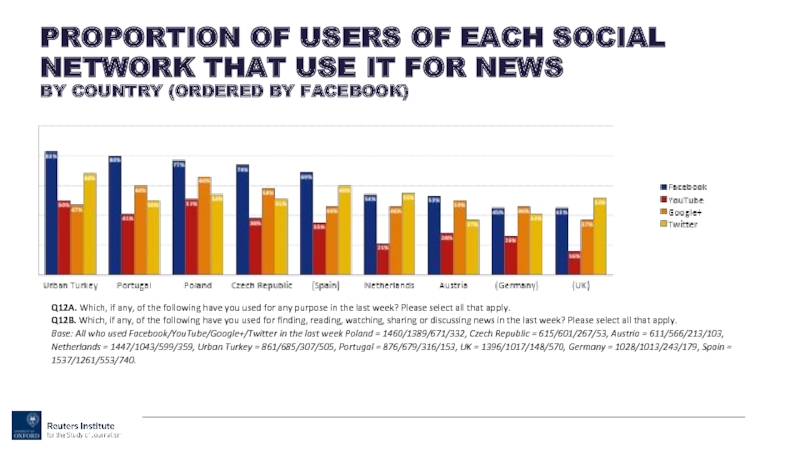
Слайд 104Q12A. Which, if any, of the following have you used for
PROPORTION OF USERS OF EACH SOCIAL NETWORK THAT USE IT FOR NEWS
BY COUNTRY (ORDERED BY FACEBOOK)
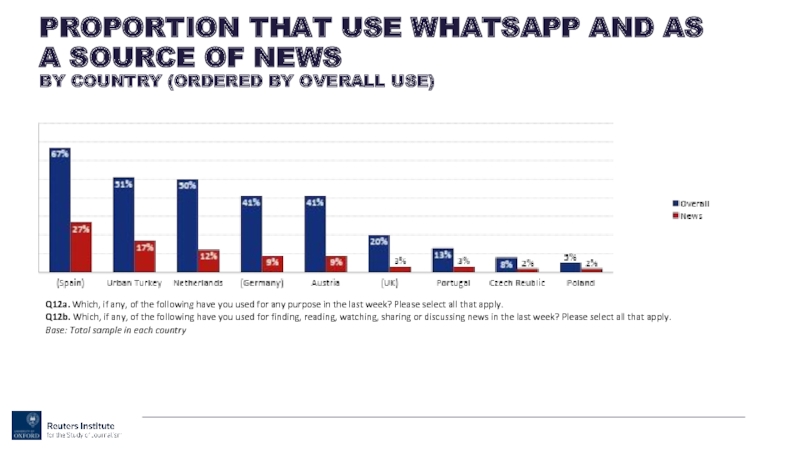
Слайд 105Q12a. Which, if any, of the following have you used for
PROPORTION THAT USE WHATSAPP AND AS A SOURCE OF NEWS
BY COUNTRY (ORDERED BY OVERALL USE)
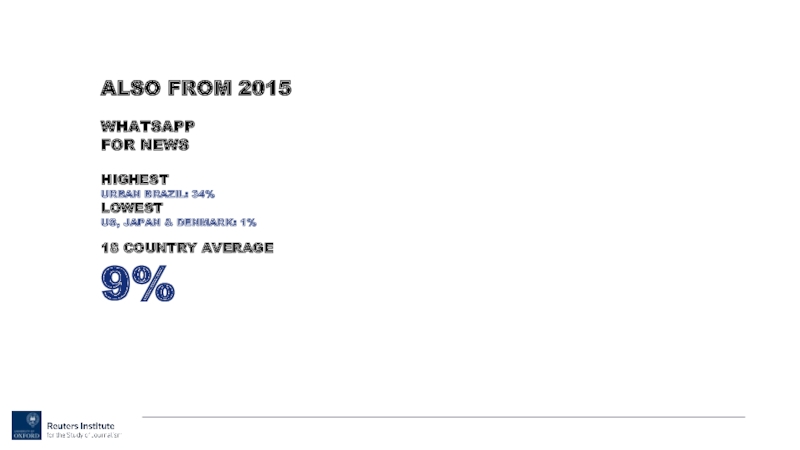
Слайд 106ALSO FROM 2015
WHATSAPP
FOR NEWS
HIGHEST
URBAN BRAZIL: 34%
LOWEST
US, JAPAN & DENMARK: 1%
18 COUNTRY
9%
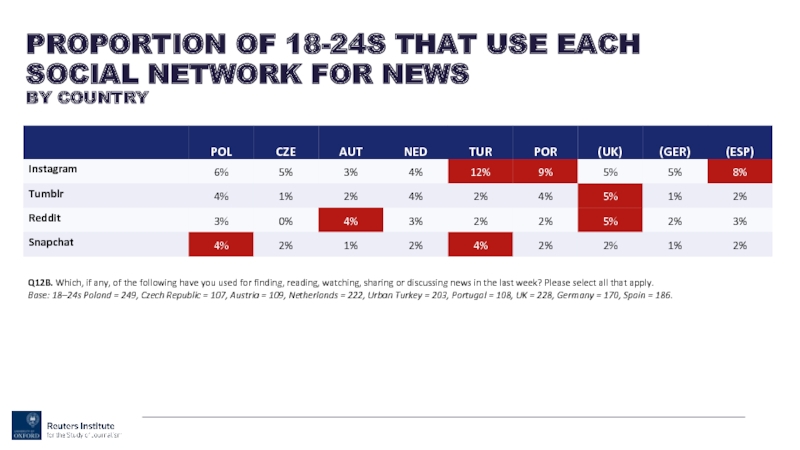
Слайд 107Q12B. Which, if any, of the following have you used for
PROPORTION OF 18-24S THAT USE EACH SOCIAL NETWORK FOR NEWS
BY COUNTRY
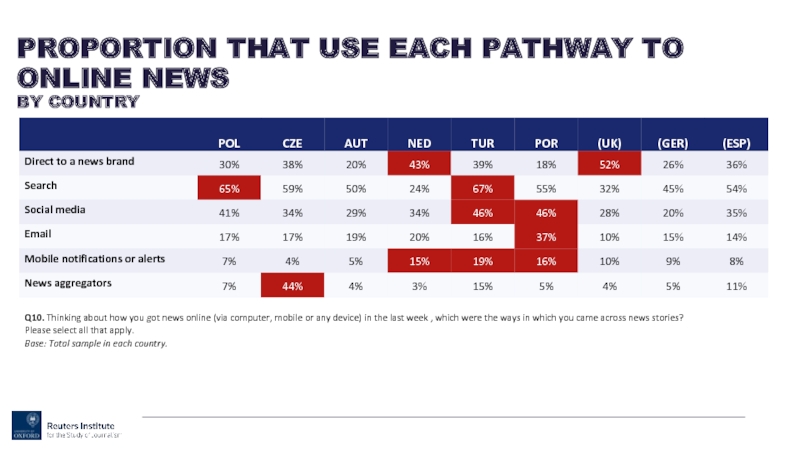
Слайд 109Q10. Thinking about how you got news online (via computer, mobile
PROPORTION THAT USE EACH PATHWAY TO ONLINE NEWS
BY COUNTRY
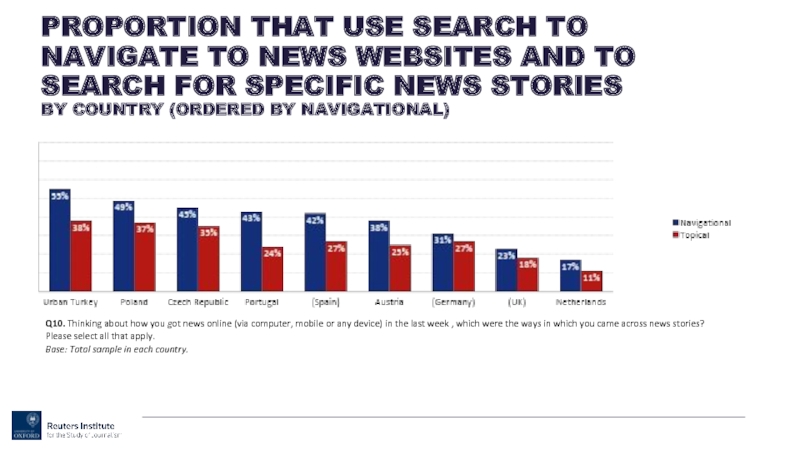
Слайд 110Q10. Thinking about how you got news online (via computer, mobile
PROPORTION THAT USE SEARCH TO NAVIGATE TO NEWS WEBSITES AND TO SEARCH FOR SPECIFIC NEWS STORIES
BY COUNTRY (ORDERED BY NAVIGATIONAL)
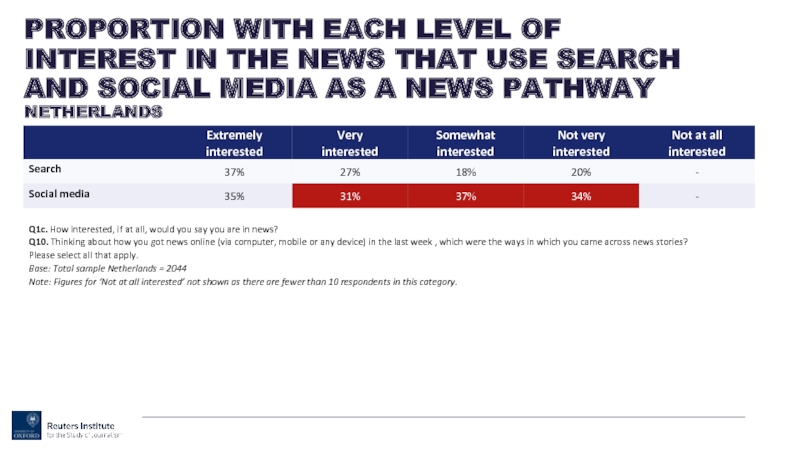
Слайд 111Q1c. How interested, if at all, would you say you are
PROPORTION WITH EACH LEVEL OF INTEREST IN THE NEWS THAT USE SEARCH AND SOCIAL MEDIA AS A NEWS PATHWAY
NETHERLANDS
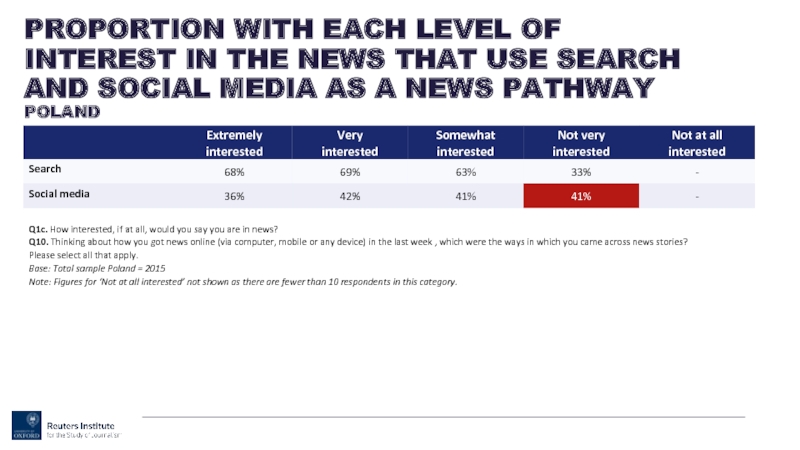
Слайд 112Q1c. How interested, if at all, would you say you are
PROPORTION WITH EACH LEVEL OF INTEREST IN THE NEWS THAT USE SEARCH AND SOCIAL MEDIA AS A NEWS PATHWAY
POLAND
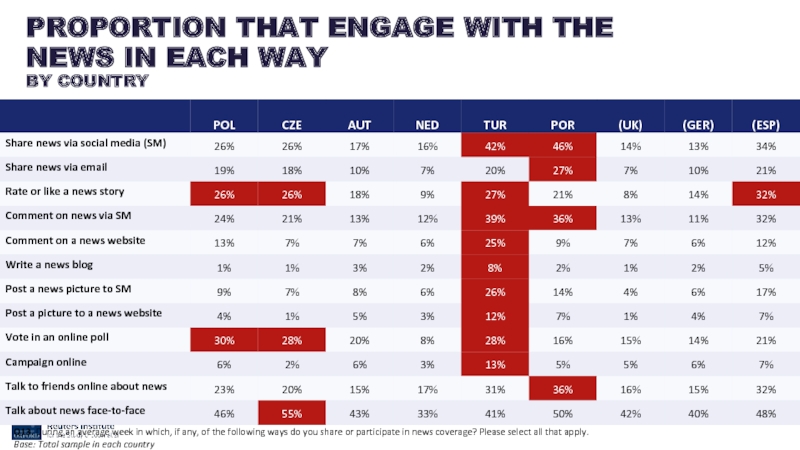
Слайд 114Q13. During an average week in which, if any, of the
PROPORTION THAT ENGAGE WITH THE NEWS IN EACH WAY
BY COUNTRY
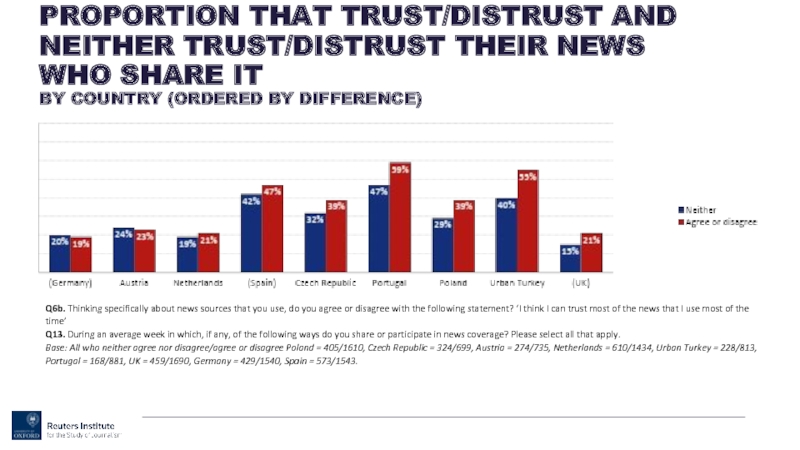
Слайд 115Q6b. Thinking specifically about news sources that you use, do you
PROPORTION THAT TRUST/DISTRUST AND NEITHER TRUST/DISTRUST THEIR NEWS WHO SHARE IT
BY COUNTRY (ORDERED BY DIFFERENCE)
