- Главная
- Разное
- Дизайн
- Бизнес и предпринимательство
- Аналитика
- Образование
- Развлечения
- Красота и здоровье
- Финансы
- Государство
- Путешествия
- Спорт
- Недвижимость
- Армия
- Графика
- Культурология
- Еда и кулинария
- Лингвистика
- Английский язык
- Астрономия
- Алгебра
- Биология
- География
- Детские презентации
- Информатика
- История
- Литература
- Маркетинг
- Математика
- Медицина
- Менеджмент
- Музыка
- МХК
- Немецкий язык
- ОБЖ
- Обществознание
- Окружающий мир
- Педагогика
- Русский язык
- Технология
- Физика
- Философия
- Химия
- Шаблоны, картинки для презентаций
- Экология
- Экономика
- Юриспруденция
Canada презентация
Содержание
- 1. Canada
- 3. Indicators of openness of Canada Export quota=
- 4. Percentage share each export category represents in
- 5. The following product groups represent the highest
- 6. 7 of Canada’s top trading partners, countries
- 7. Over nine-tenths (93.1%) of Canadian exports in
- 8. EU-Canada relationship; Trade picture The
- 9. Trade picture Top three export categories
- 10. EU-Canada trade agreement CETA New opportunities for
- 11. EU-Canada trade agreement CETA
- 12. Report WTO Canada has recovered well
- 13. Canada has a well-developed intellectual property protection
- 14. Canada and IMF Canada, mainly through
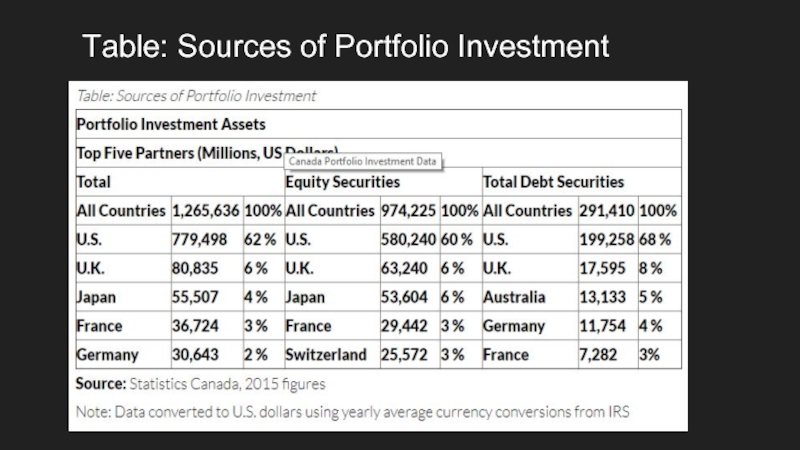
- 15. International portfolio investments in Canada Largest
- 16. Table: Sources of Portfolio Investment
- 17. Table: Sources and Destination of FDI
- 18. Table: Types of portfolio investments in Canada
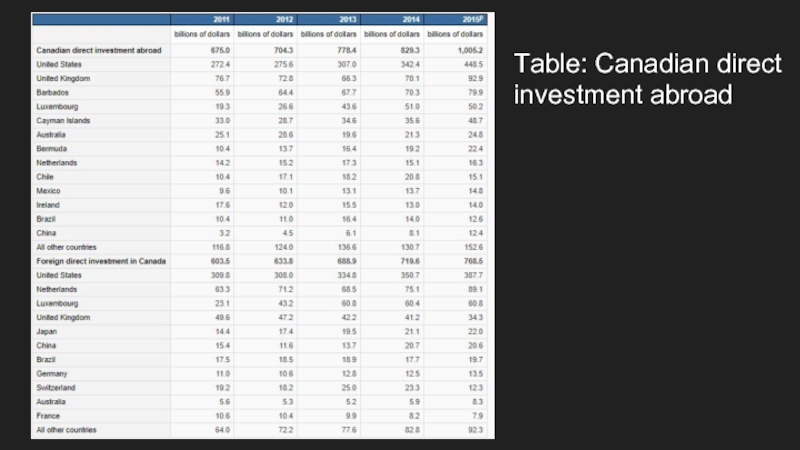
- 19. Table: Canadian direct investment abroad
- 20. The stock of Canadian direct investment abroad
- 21. Сanada and World Bank group (IFC) Canada
- 22. Canada and IFC partner in Sub-Saharan
- 23. Managing Labour Migration to Canada Supporting Canada’s
- 25. Labour migration to Canada is a mix
- 26. Temporary worker programs: opportunity for all Programs
- 27. List of used literature LIBRARY OF PARLIAMENT
- 28. Thank you for your attention
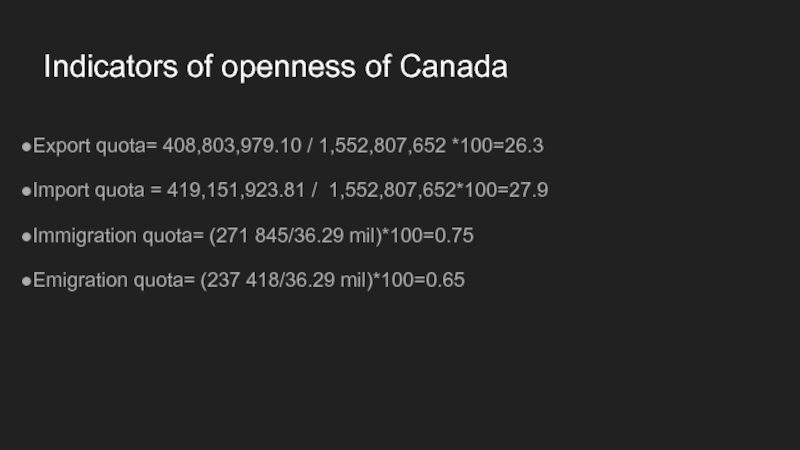
Слайд 3 Indicators of openness of Canada
Export quota= 408,803,979.10 / 1,552,807,652 *100=26.3
Import quota
Immigration quota= (271 845/36.29 mil)*100=0.75
Emigration quota= (237 418/36.29 mil)*100=0.65
Слайд 4Percentage share each export category represents in terms of overall exports
Vehicles : US$64.3 billion (16.5% of total exports)
Mineral fuels including oil: $62.3 billion (16%)
Machinery including computers: $30 billion (7.7%)
Gems, precious metals: $18.7 billion (4.8%)
Wood: $13.2 billion (3.4%)
Electrical machinery, equipment: $12.6 billion (3.2%)
Plastics, plastic articles: $12.1 billion (3.1%)
Aircraft, spacecraft: $10.3 billion (2.6%)
Pharmaceuticals: $8.4 billion (2.2%)
Aluminum: $8.1 billion (2.1%)
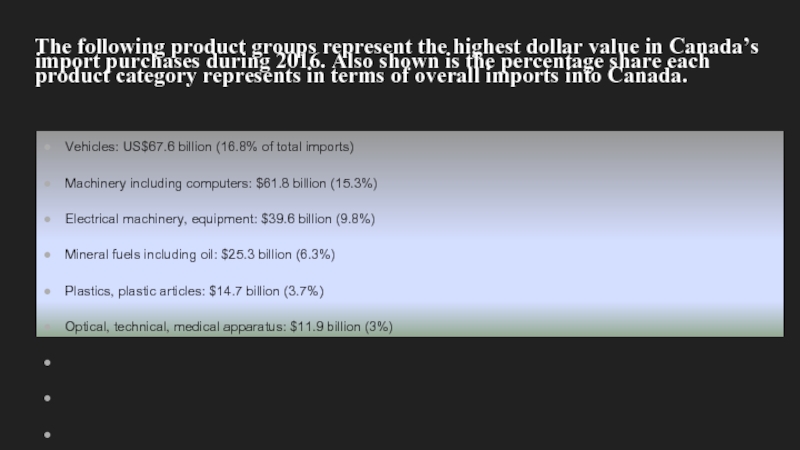
Слайд 5The following product groups represent the highest dollar value in Canada’s
Vehicles: US$67.6 billion (16.8% of total imports)
Machinery including computers: $61.8 billion (15.3%)
Electrical machinery, equipment: $39.6 billion (9.8%)
Mineral fuels including oil: $25.3 billion (6.3%)
Plastics, plastic articles: $14.7 billion (3.7%)
Optical, technical, medical apparatus: $11.9 billion (3%)
Pharmaceuticals: $11.4 billion (2.8%)
Gems, precious metals: $10.5 billion (2.6%)
Furniture, bedding, lighting, signs, prefab buildings: $8.8 billion (2.2%)
Articles of iron or steel: $8.4 billion (2.1%)
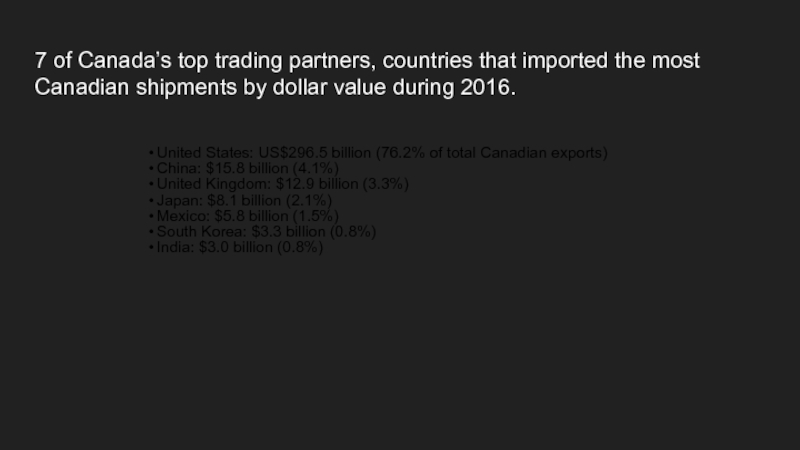
Слайд 67 of Canada’s top trading partners, countries that imported the most
United States: US$296.5 billion (76.2% of total Canadian exports)
China: $15.8 billion (4.1%)
United Kingdom: $12.9 billion (3.3%)
Japan: $8.1 billion (2.1%)
Mexico: $5.8 billion (1.5%)
South Korea: $3.3 billion (0.8%)
India: $3.0 billion (0.8%)
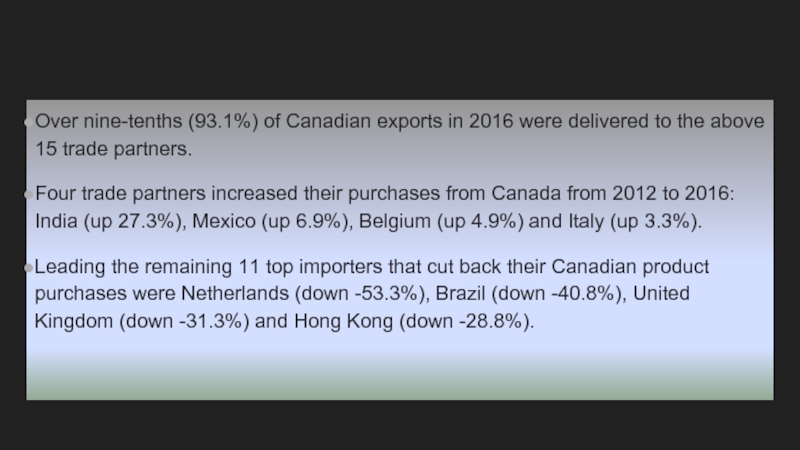
Слайд 7Over nine-tenths (93.1%) of Canadian exports in 2016 were delivered to
Four trade partners increased their purchases from Canada from 2012 to 2016: India (up 27.3%), Mexico (up 6.9%), Belgium (up 4.9%) and Italy (up 3.3%).
Leading the remaining 11 top importers that cut back their Canadian product purchases were Netherlands (down -53.3%), Brazil (down -40.8%), United Kingdom (down -31.3%) and Hong Kong (down -28.8%).
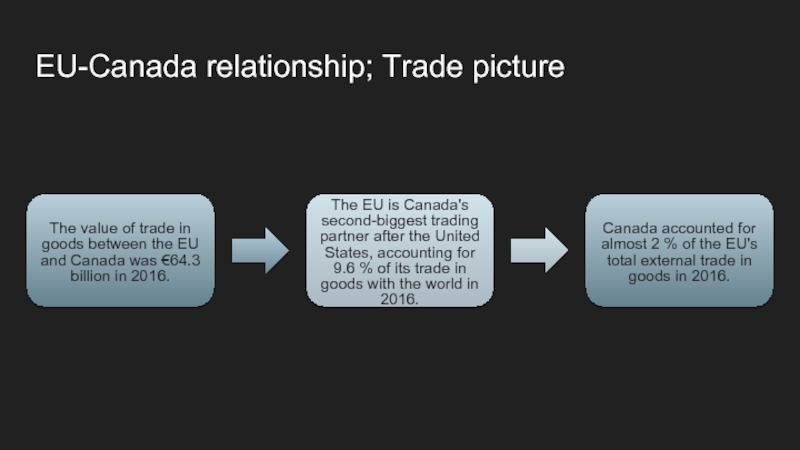
Слайд 8EU-Canada relationship; Trade picture
The value of trade in goods between
The EU is Canada's second-biggest trading partner after the United States, accounting for 9.6 % of its trade in goods with the world in 2016.
Canada accounted for almost 2 % of the EU's total external trade in goods in 2016.
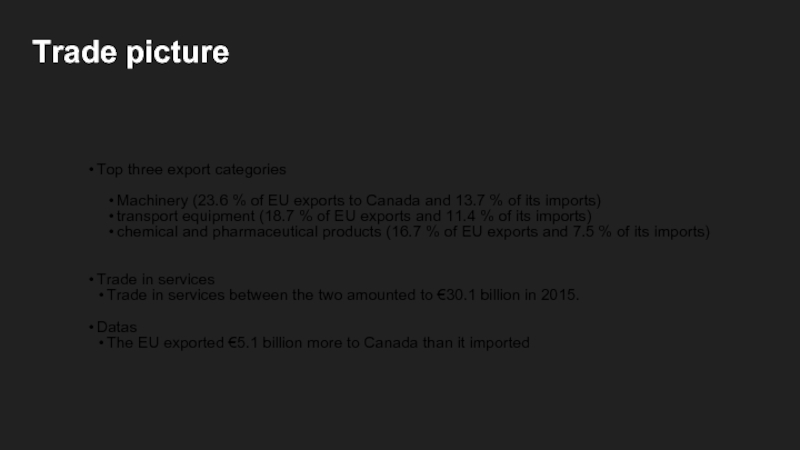
Слайд 9Trade picture
Top three export categories
Machinery (23.6 % of EU exports to
transport equipment (18.7 % of EU exports and 11.4 % of its imports)
chemical and pharmaceutical products (16.7 % of EU exports and 7.5 % of its imports)
Trade in services
Trade in services between the two amounted to €30.1 billion in 2015.
Datas
The EU exported €5.1 billion more to Canada than it imported
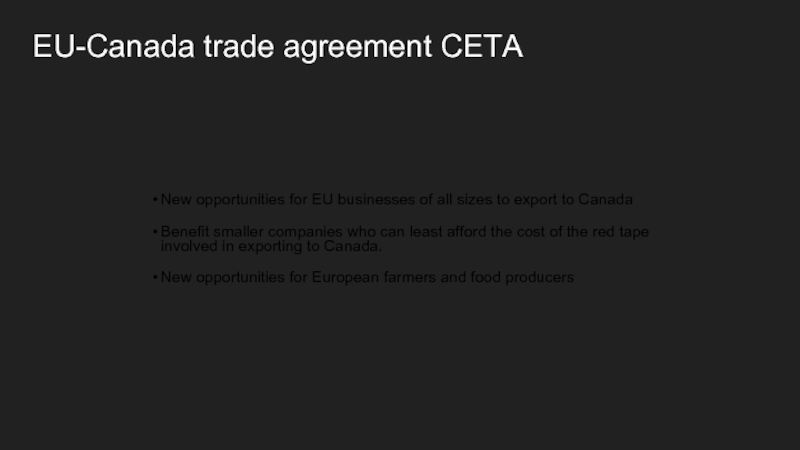
Слайд 10EU-Canada trade agreement CETA
New opportunities for EU businesses of all sizes
Benefit smaller companies who can least afford the cost of the red tape involved in exporting to Canada.
New opportunities for European farmers and food producers
Слайд 12Report WTO
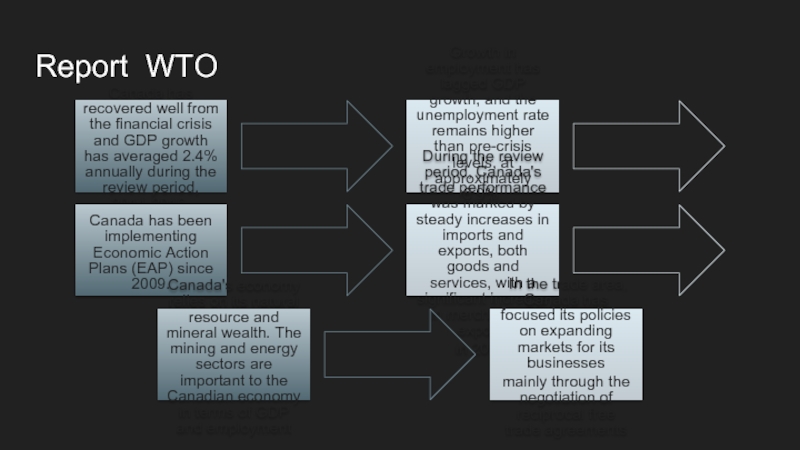
Canada has recovered well from the financial crisis and GDP
Growth in employment has lagged GDP growth, and the unemployment rate remains higher than pre-crisis levels, at approximately 6.9%.
This also reflects an improvement in labour productivity
Canada has been implementing Economic Action Plans (EAP) since 2009.
During the review period, Canada's trade performance was marked by steady increases in imports and exports, both goods and services, with a significant increase in merchandise exports
in 2016.
Canada's economy relies on its natural resource and mineral wealth. The mining and energy sectors are important to the Canadian economy in terms of GDP and employment
In the trade area, Canada has focused its policies on expanding markets for its businesses
mainly through the negotiation of reciprocal free trade agreements
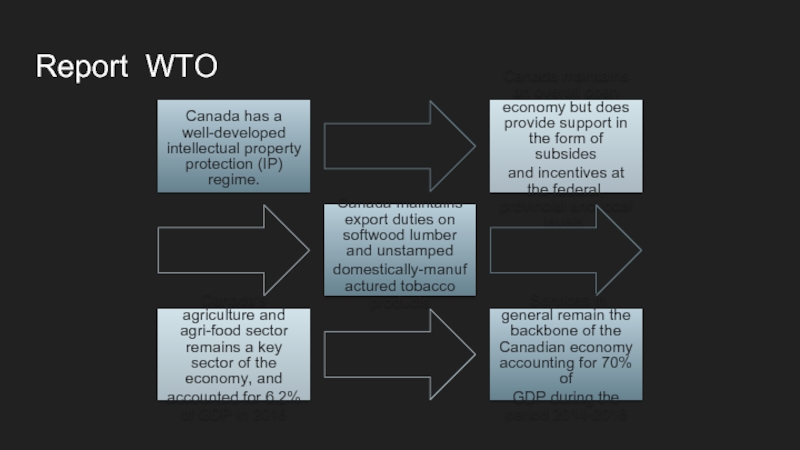
Слайд 13Canada has a well-developed intellectual property protection (IP) regime.
Canada maintains an
and incentives at the federal, provincial and local levels.
Canada maintains export duties on softwood lumber and unstamped
domestically-manufactured tobacco products
Canada's agriculture and agri-food sector remains a key sector of the economy, and
accounted for 6.2% of GDP in 2016
Services in general remain the backbone of the Canadian economy accounting for 70% of
GDP during the period 2014-2016
Report WTO
Слайд 14Canada and IMF
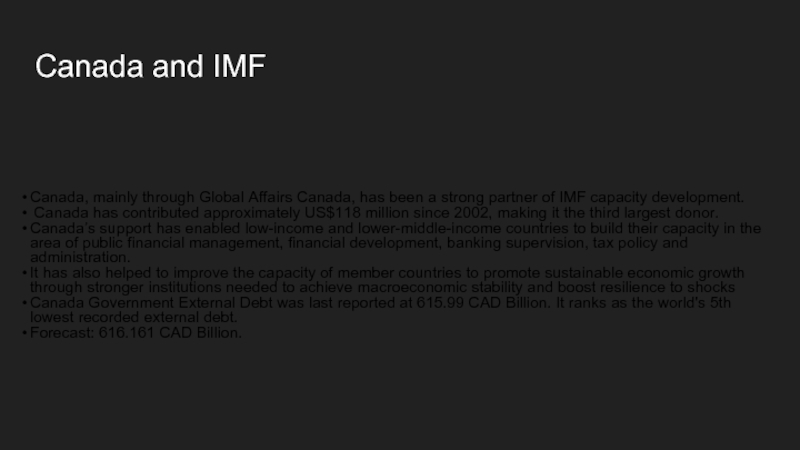
Canada, mainly through Global Affairs Canada, has been a
Canada has contributed approximately US$118 million since 2002, making it the third largest donor.
Canada’s support has enabled low-income and lower-middle-income countries to build their capacity in the area of public financial management, financial development, banking supervision, tax policy and administration.
It has also helped to improve the capacity of member countries to promote sustainable economic growth through stronger institutions needed to achieve macroeconomic stability and boost resilience to shocks
Canada Government External Debt was last reported at 615.99 CAD Billion. It ranks as the world's 5th lowest recorded external debt.
Forecast: 616.161 CAD Billion.
Слайд 15International portfolio investments in Canada
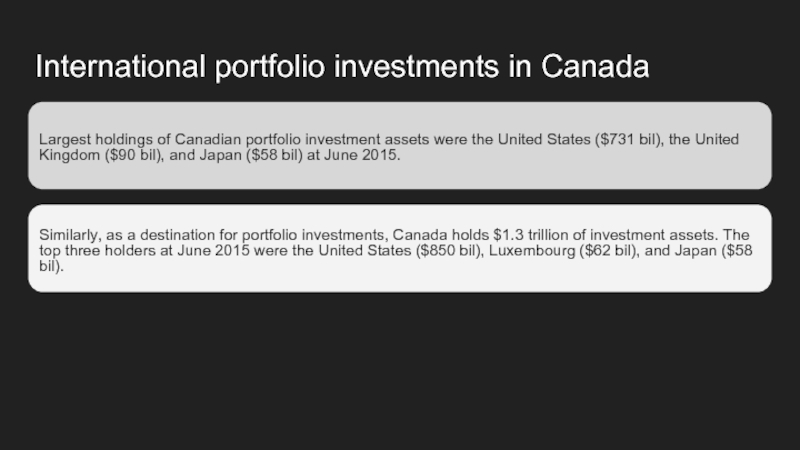
Largest holdings of Canadian portfolio investment assets
Similarly, as a destination for portfolio investments, Canada holds $1.3 trillion of investment assets. The top three holders at June 2015 were the United States ($850 bil), Luxembourg ($62 bil), and Japan ($58 bil).
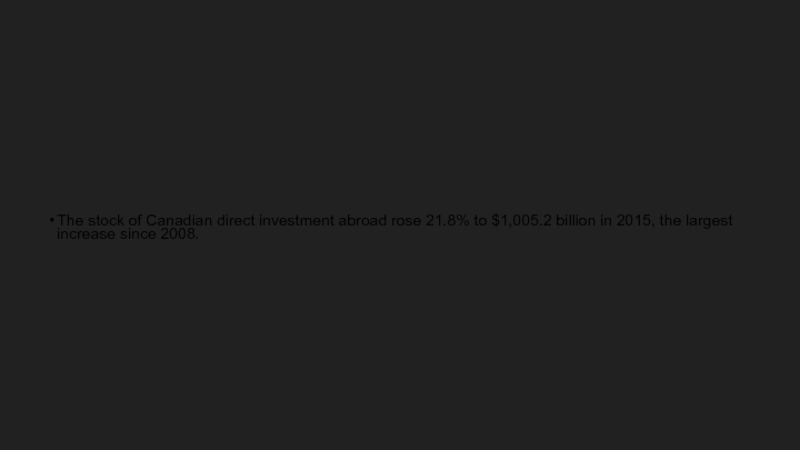
Слайд 20The stock of Canadian direct investment abroad rose 21.8% to $1,005.2
Слайд 21Сanada and World Bank group (IFC)
Canada is a founding member of
Through the Canadian International Development Agency, Canada partners with IFC in the delivery of technical and advisory assistance to companies and governments in the developing world with the aim of reducing poverty through private sector growth.
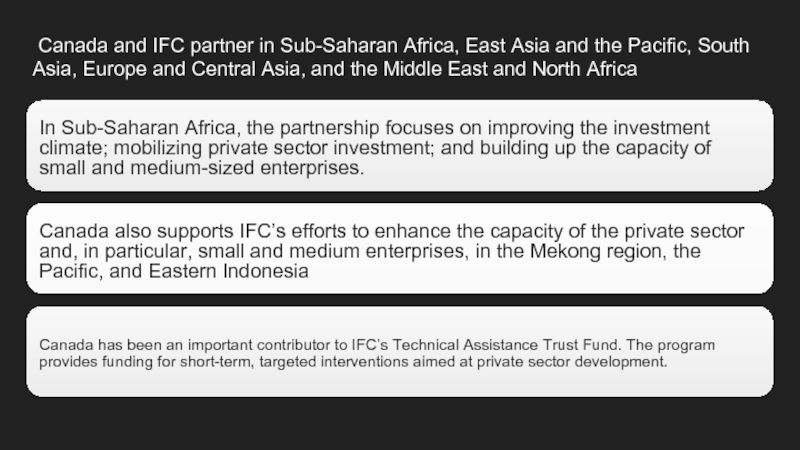
Слайд 22 Canada and IFC partner in Sub-Saharan Africa, East Asia and
In Sub-Saharan Africa, the partnership focuses on improving the investment climate; mobilizing private sector investment; and building up the capacity of small and medium-sized enterprises.
Canada also supports IFC’s efforts to enhance the capacity of the private sector and, in particular, small and medium enterprises, in the Mekong region, the Pacific, and Eastern Indonesia
Canada has been an important contributor to IFC’s Technical Assistance Trust Fund. The program provides funding for short-term, targeted interventions aimed at private sector development.
Слайд 23Managing Labour Migration to Canada
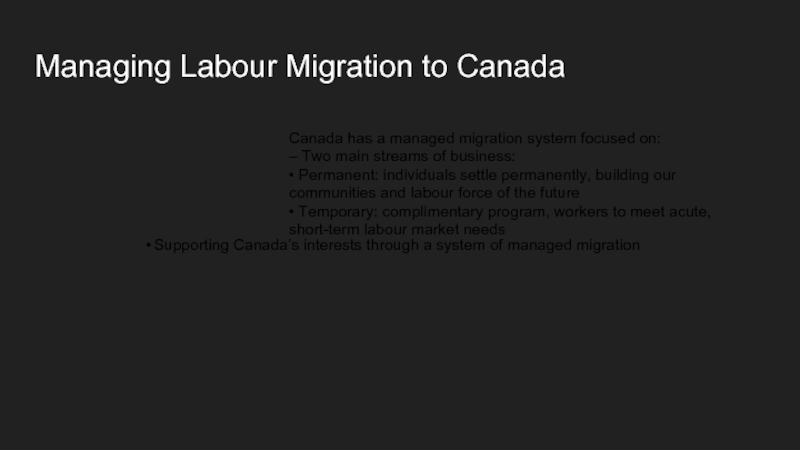
Supporting Canada’s interests through a system of
Canada has a managed migration system focused on:
– Two main streams of business:
• Permanent: individuals settle permanently, building our communities and labour force of the future
• Temporary: complimentary program, workers to meet acute, short-term labour market needs
Слайд 24
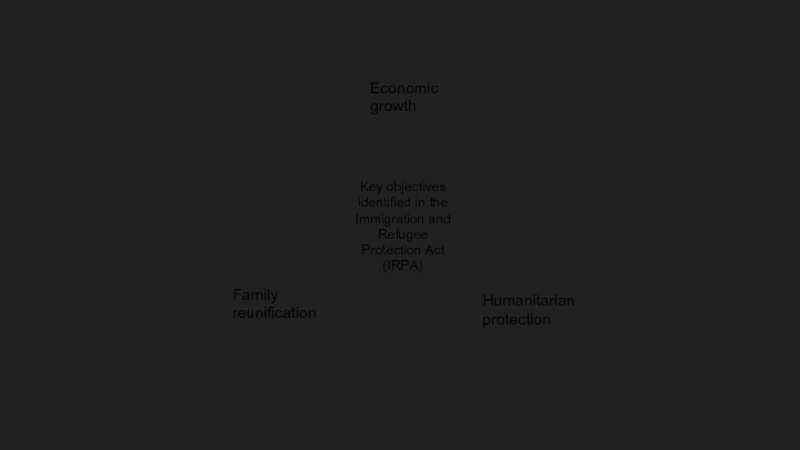
Key objectives identified in the Immigration and Refugee Protection Act (IRPA)
Economic
Family reunification
Humanitarian protection
Слайд 25Labour migration to Canada is a mix of planned and unplanned
Tools to manage the entry of individuals into Canada:
– Permanent stream:
Yearly levels plan – projection of number expected to become Permanent Residents in following year
Selection grid – only tool to control intake of applications, affects quality of skilled worker applicants
– Temporary stream:
No numerical limits/quotas in place – admissions are labour market sensitive
International students allowed to work during and after studies
Слайд 26Temporary worker programs: opportunity for all
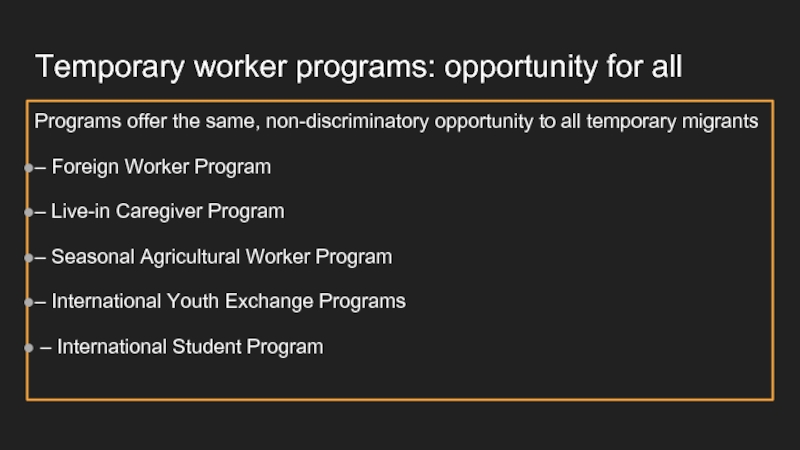
Programs offer the same, non-discriminatory opportunity
– Foreign Worker Program
– Live-in Caregiver Program
– Seasonal Agricultural Worker Program
– International Youth Exchange Programs
– International Student Program
Слайд 27List of used literature
LIBRARY OF PARLIAMENT RESEARCH PUBLICATIONS OF CANADA
Department of
TRADE POLICY REVIEW;REPORT BY THE SECRETARIAT OF CANADA
http://trade.ec.europa.eu/doclib/docs/2017/september/tradoc_156043.pdf
Worlds top exports http://www.worldstopexports.com/canadas-top-10-imports/
https://en.wikipedia.org/wiki/Canada


