- Главная
- Разное
- Дизайн
- Бизнес и предпринимательство
- Аналитика
- Образование
- Развлечения
- Красота и здоровье
- Финансы
- Государство
- Путешествия
- Спорт
- Недвижимость
- Армия
- Графика
- Культурология
- Еда и кулинария
- Лингвистика
- Английский язык
- Астрономия
- Алгебра
- Биология
- География
- Детские презентации
- Информатика
- История
- Литература
- Маркетинг
- Математика
- Медицина
- Менеджмент
- Музыка
- МХК
- Немецкий язык
- ОБЖ
- Обществознание
- Окружающий мир
- Педагогика
- Русский язык
- Технология
- Физика
- Философия
- Химия
- Шаблоны, картинки для презентаций
- Экология
- Экономика
- Юриспруденция
The American Dream at $130,000? презентация
Содержание
- 1. The American Dream at $130,000?
- 2. 1) Housing Costs USA Today used a
- 3. 1) Housing Costs The Problem According to
- 4. 1) Housing Costs The Solution The median
- 5. 1) Housing Costs The Result Total
- 6. 2) Car Costs USA Today assumed an
- 7. 2) Car Costs The Problem A mid-sized
- 8. 2) Car Costs The Solution According to
- 9. 2) Car Costs The Result Total
- 10. 3) Food Costs USA Today, using USDA
- 11. 3) Food Costs The Problem USA Today
- 12. 3) Food Costs The Solution Normalized for
- 13. 3) Food Costs The Result Total
- 14. 4) Education Costs USA Today, while not
- 15. 4) Education Costs The Problem According to
- 16. 4) Education Costs The Solution It is
- 17. 4) Education Costs The Result Total
- 18. 5) Summer Vacation Costs USA Today, using
- 19. 5) Summer Vacation Costs The Problem Again,
- 20. 5) Summer Vacation Costs The Solution Money
- 21. 5) Summer Vacation Costs The Result
- 22. 6) Tax Costs As the paper states:
- 23. 6) Tax Costs The Problem The CTJ
- 24. 6) Tax Costs The Solution The standard
- 25. 6) Tax Costs The Result Total
- 26. 7) Retirement Costs USA Today encouraged maxing
- 27. 7) Retirement Costs The Problem There’s actually
- 28. 7) Retirement Costs The Solution Using the
- 29. 7) Retirement Costs The Result Total
- 30. That’s almost one-third lower than USA Today’s number!
- 31. Important Points to Remember Assuming this new
- 32. Maximize Your Retirement Savings
Слайд 21) Housing Costs
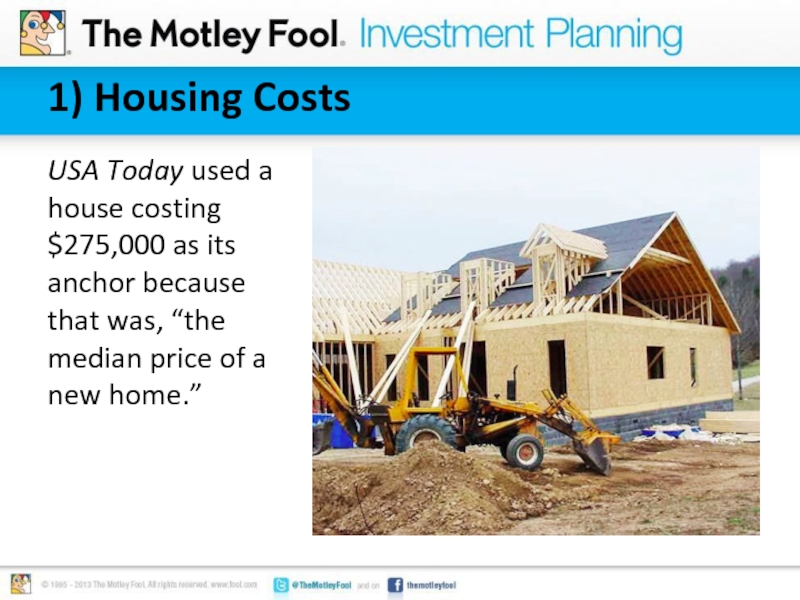
USA Today used a house costing $275,000 as its
anchor because that was, “the median price of a new home.”
Слайд 31) Housing Costs
The Problem
According to the National Association of Homebuilders, new
homes account for just 8%-10% of all home sales.
The other 90% are sales of existing homes—which are much cheaper.
The American Dream isn’t negated by buying an existing home.
The other 90% are sales of existing homes—which are much cheaper.
The American Dream isn’t negated by buying an existing home.
Слайд 41) Housing Costs
The Solution
The median existing home price from the timeframe
USA Today used was $198,000.
By weighting the mix of new and existing home sales, we arrive at a new median home price of $205,000.
This new price knocks the annual cost of owning a home down to $12,623.
By weighting the mix of new and existing home sales, we arrive at a new median home price of $205,000.
This new price knocks the annual cost of owning a home down to $12,623.
Слайд 51) Housing Costs
The Result
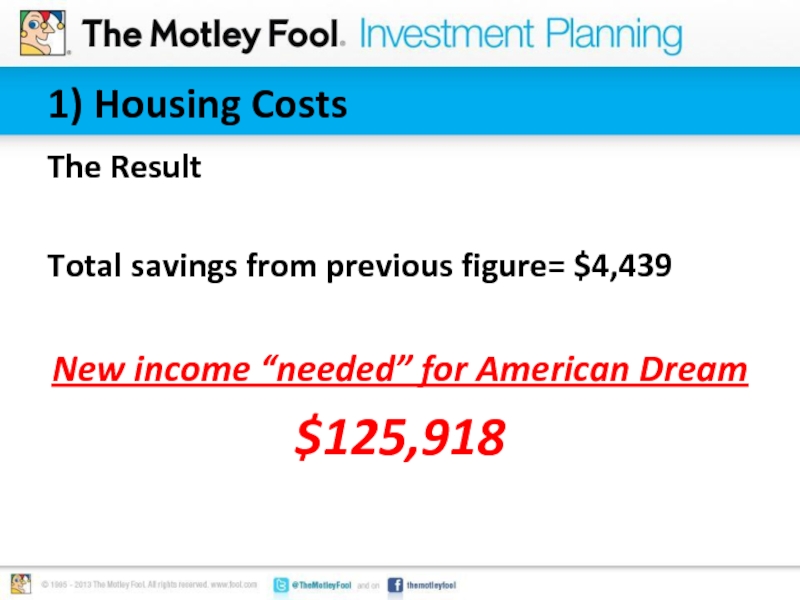
Total savings from previous figure= $4,439
New income “needed”
for American Dream
$125,918
$125,918
Слайд 62) Car Costs
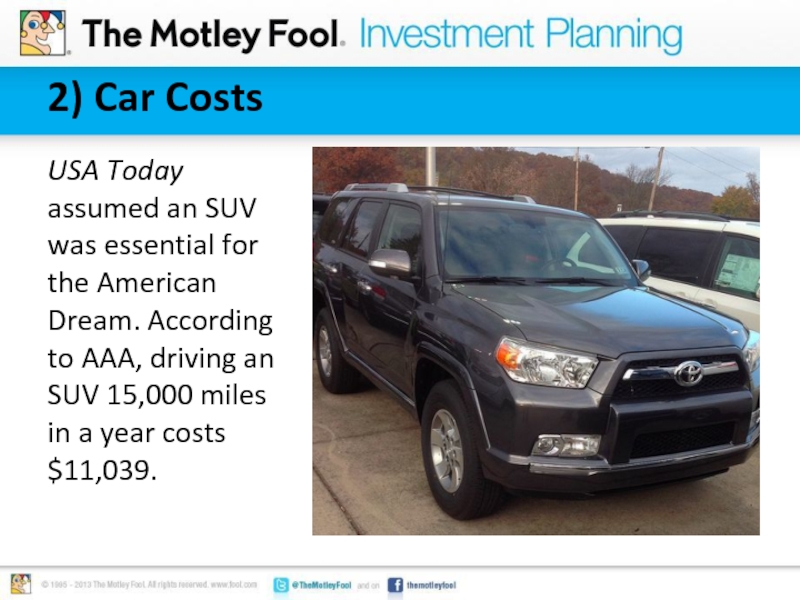
USA Today assumed an SUV was essential for the
American Dream. According to AAA, driving an SUV 15,000 miles in a year costs $11,039.
Слайд 72) Car Costs
The Problem
A mid-sized sedan can easily meet the needs
of a family of four, and is far cheaper and more fuel efficient than an SUV.
The average American driver, according to the Federal Highway Administration, drives less than 10,000 miles per year, further reducing costs.
An SUV is not essential to living the American Dream.
The average American driver, according to the Federal Highway Administration, drives less than 10,000 miles per year, further reducing costs.
An SUV is not essential to living the American Dream.
Слайд 82) Car Costs
The Solution
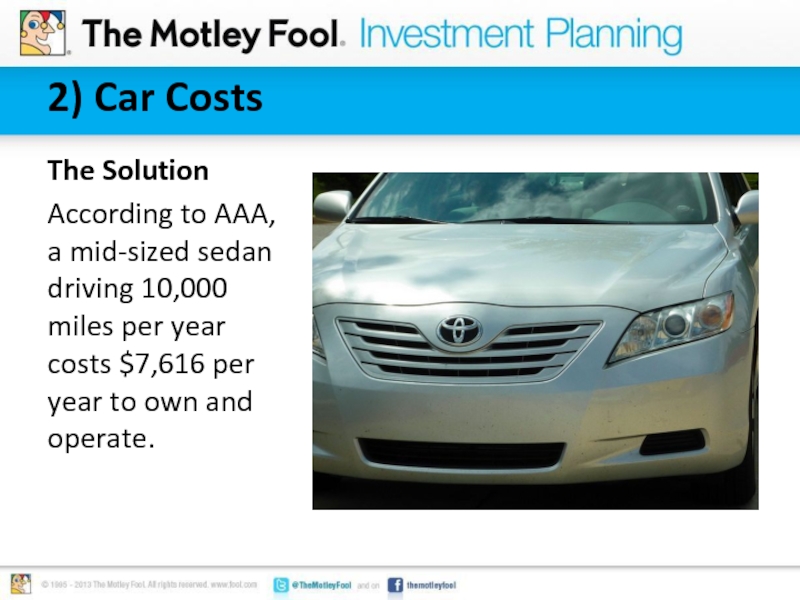
According to AAA, a mid-sized sedan driving 10,000
miles per year costs $7,616 per year to own and operate.
Слайд 92) Car Costs
The Result
Total savings from previous figure= $3,423
New income “needed”
for American Dream
$122,495
$122,495
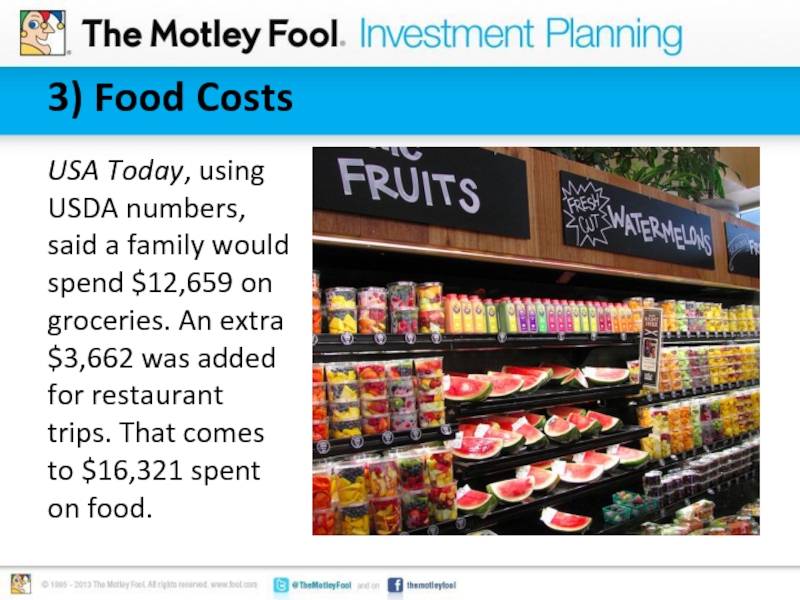
Слайд 103) Food Costs
USA Today, using USDA numbers, said a family would
spend $12,659 on groceries. An extra $3,662 was added for restaurant trips. That comes to $16,321 spent on food.
Слайд 113) Food Costs
The Problem
USA Today didn’t read the USDA’s fine print.
The USDA estimates assume, “that all meals and snacks are prepared at home.” [emphasis added] Obviously, that means no restaurants.
These numbers are also significantly higher than what the Bureau of Labor Statistics (BLS) says the average family spends on food—both at home and while eating out.
These numbers are also significantly higher than what the Bureau of Labor Statistics (BLS) says the average family spends on food—both at home and while eating out.
Слайд 123) Food Costs
The Solution
Normalized for a family of four, with two
children under the age of 18, the BLS figures say that the average American family spends $9,755 on food—both at home and away.
The USDA guidelines haven’t been updated in 7 years, and simply don’t reflect the reality of normal American eating patterns.
The USDA guidelines haven’t been updated in 7 years, and simply don’t reflect the reality of normal American eating patterns.
Слайд 133) Food Costs
The Result
Total savings from previous figure= $6,566
New income “needed”
for American Dream
$115,929
$115,929
Слайд 144) Education Costs
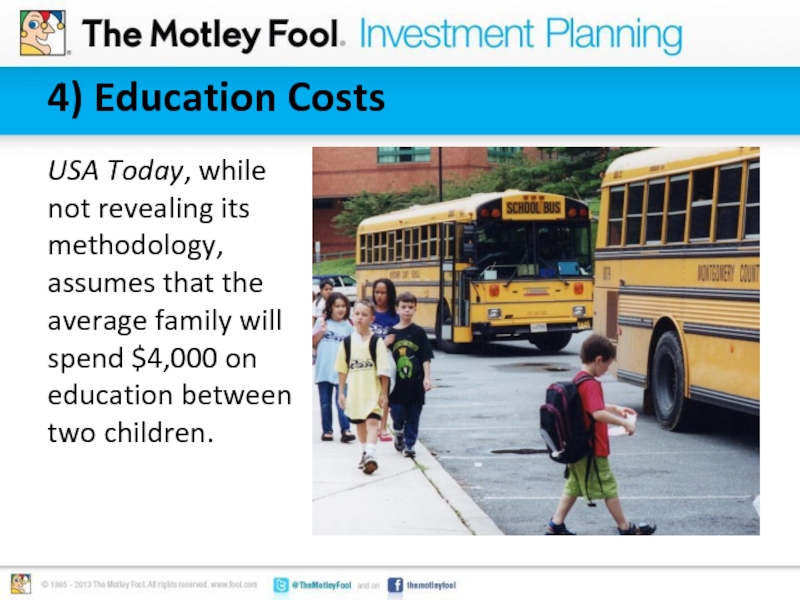
USA Today, while not revealing its methodology, assumes that
the average family will spend $4,000 on education between two children.
Слайд 154) Education Costs
The Problem
According to the National Center for Education Statistics,
only 9% of the nation’s 55 million school children attend private elementary or secondary schools.
The Pew Research Foundation says that there are 12.4 million stay-at-home parents, accounting for roughly 28% of all family households. These families typically don’t pay for childcare.
Attending public school or having a parent stay home does not eliminate you from the American Dream.
The Pew Research Foundation says that there are 12.4 million stay-at-home parents, accounting for roughly 28% of all family households. These families typically don’t pay for childcare.
Attending public school or having a parent stay home does not eliminate you from the American Dream.
Слайд 164) Education Costs
The Solution
It is difficult to correct these numbers, since
USA Today did not reveal its methods.
But given the vast majority of public school students, and spreading out the cost of childcare over 18 years, we’ll assume (liberally) that the average family spends $3,000 per year on education.
But given the vast majority of public school students, and spreading out the cost of childcare over 18 years, we’ll assume (liberally) that the average family spends $3,000 per year on education.
Слайд 174) Education Costs
The Result
Total savings from previous figure= $1,000
New income “needed”
for American Dream
$114,929
$114,929
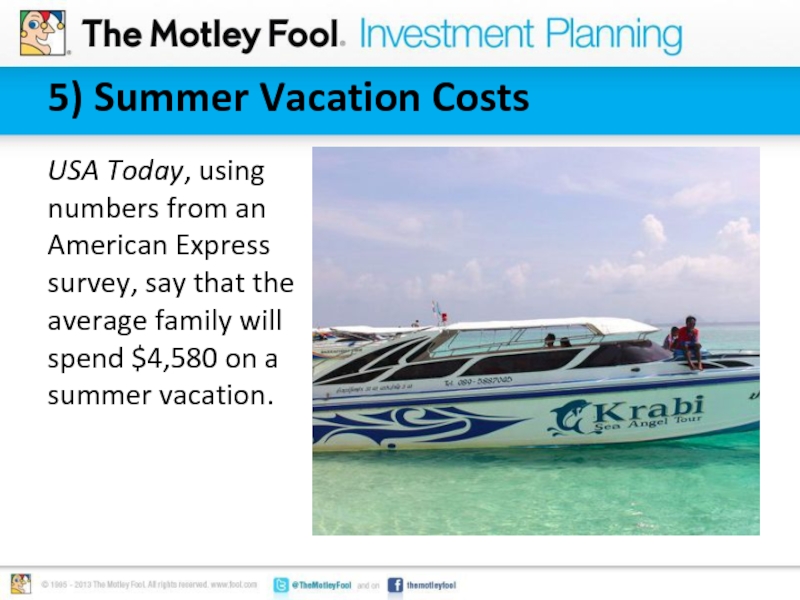
Слайд 185) Summer Vacation Costs
USA Today, using numbers from an American Express
survey, say that the average family will spend $4,580 on a summer vacation.
Слайд 195) Summer Vacation Costs
The Problem
Again, USA Today didn’t read the fine
print. American Express readily admits that its survey includes, “an affluent demographic, defined by a minimum annual household income of $100,000.”
Obviously, the American Dream family will need over $100,000 if data is being pulled from this subset.
You don’t need a $4,580 vacation to live the American Dream.
Obviously, the American Dream family will need over $100,000 if data is being pulled from this subset.
You don’t need a $4,580 vacation to live the American Dream.
Слайд 205) Summer Vacation Costs
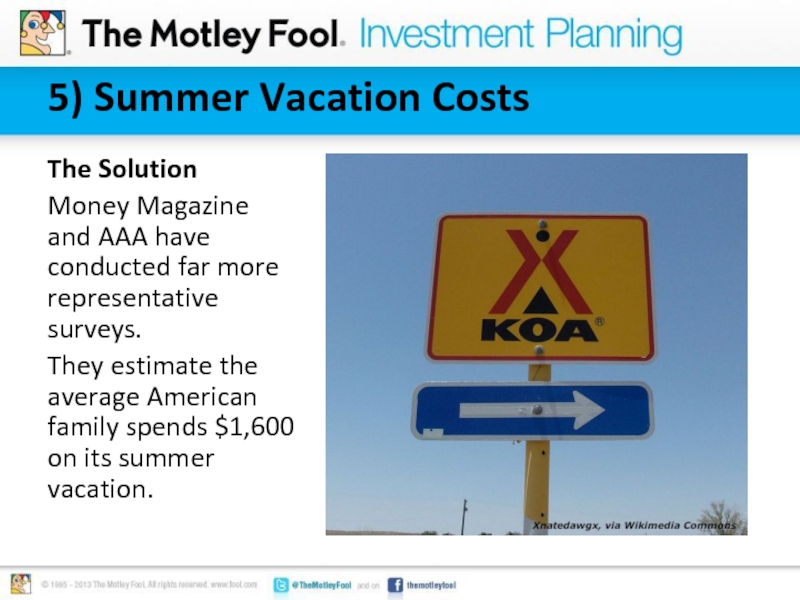
The Solution
Money Magazine and AAA have conducted far
more representative surveys.
They estimate the average American family spends $1,600 on its summer vacation.
They estimate the average American family spends $1,600 on its summer vacation.
Слайд 215) Summer Vacation Costs
The Result
Total savings from previous figure= $2,980
New income
“needed” for American Dream=$111,949
Слайд 226) Tax Costs
As the paper states: “Total federal, state, and local
taxes were pegged at 30% for households at this income level, based on a model developed for Citizens for Tax Justice [CTJ].”
Слайд 236) Tax Costs
The Problem
The CTJ includes ALL taxes paid, including sales
tax. By using these numbers, USA Today double counted taxes on the tens of thousands of dollars already spent.
The CTJ adds in unearned income from investments to one’s adjusted gross income. But according to USA Today’s model, all investments are in tax-deferred retirement accounts—meaning no unearned income is present.
The CTJ adds in unearned income from investments to one’s adjusted gross income. But according to USA Today’s model, all investments are in tax-deferred retirement accounts—meaning no unearned income is present.
Слайд 246) Tax Costs
The Solution
The standard deduction, along with typical exemptions and
tax-deferred savings are used to calculate federal taxes owed.
According to the Tax Foundation, the median average combined state and local tax rate is 6.9% (varies wildly by state).
The New York Times calculated the average property tax rate in the United States at 1.38% (again, varies wildly).
Given all of this, and the reduced overall spending, the tax burden would be $13,824.
Слайд 256) Tax Costs
The Result
Total savings from previous figure= $18,533
New income “needed”
for American Dream
$93,416
$93,416
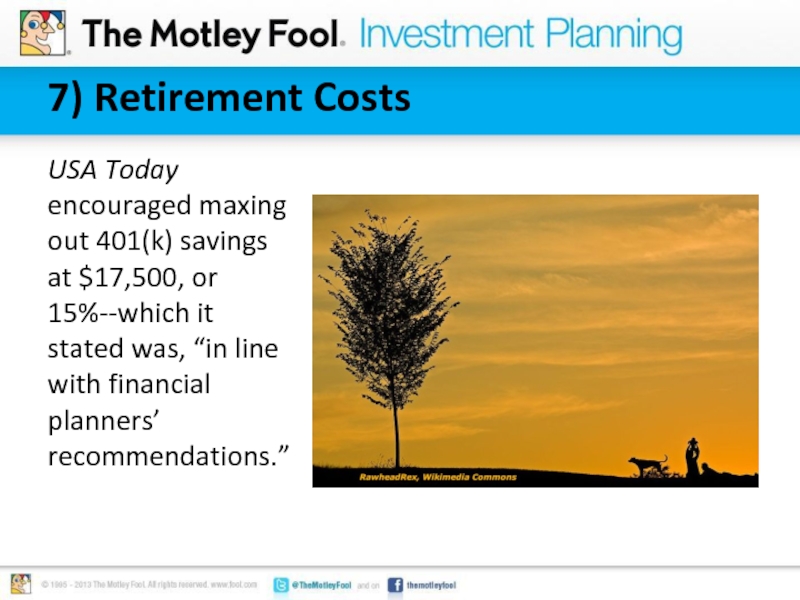
Слайд 267) Retirement Costs
USA Today encouraged maxing out 401(k) savings at $17,500,
or 15%--which it stated was, “in line with financial planners’ recommendations.”
Слайд 277) Retirement Costs
The Problem
There’s actually no problem here. If you can
put away the maximum into your 401(k), the more power to you.
However, it would end up being far more than the 15% USA Today mentioned as a good guideline.
You don’t need to put away this much to live the American Dream.
However, it would end up being far more than the 15% USA Today mentioned as a good guideline.
You don’t need to put away this much to live the American Dream.
Слайд 287) Retirement Costs
The Solution
Using the new income level after all of
our adjustments, you would want to put away $13,175 per year in your 401(k) if 15% was your goal.
Слайд 297) Retirement Costs
The Result
Total savings from previous figure= $4,325
New income “needed”
for American Dream
$89,091
$89,091
Слайд 31Important Points to Remember
Assuming this new number, roughly one-third of U.S.
households could have the American Dream—much better than one in eight.
However, almost no one’s situation will match this exactly. Everyone’s life situation (and definition of the American Dream) is different.
This simply illustrates glaring facts that weren’t taken into consideration.
However, almost no one’s situation will match this exactly. Everyone’s life situation (and definition of the American Dream) is different.
This simply illustrates glaring facts that weren’t taken into consideration.

