- Главная
- Разное
- Дизайн
- Бизнес и предпринимательство
- Аналитика
- Образование
- Развлечения
- Красота и здоровье
- Финансы
- Государство
- Путешествия
- Спорт
- Недвижимость
- Армия
- Графика
- Культурология
- Еда и кулинария
- Лингвистика
- Английский язык
- Астрономия
- Алгебра
- Биология
- География
- Детские презентации
- Информатика
- История
- Литература
- Маркетинг
- Математика
- Медицина
- Менеджмент
- Музыка
- МХК
- Немецкий язык
- ОБЖ
- Обществознание
- Окружающий мир
- Педагогика
- Русский язык
- Технология
- Физика
- Философия
- Химия
- Шаблоны, картинки для презентаций
- Экология
- Экономика
- Юриспруденция
Results for Q2 Fiscal 2016 презентация
Содержание
- 1. Results for Q2 Fiscal 2016
- 2. Risks and Non-GAAP Disclosures This presentation contains
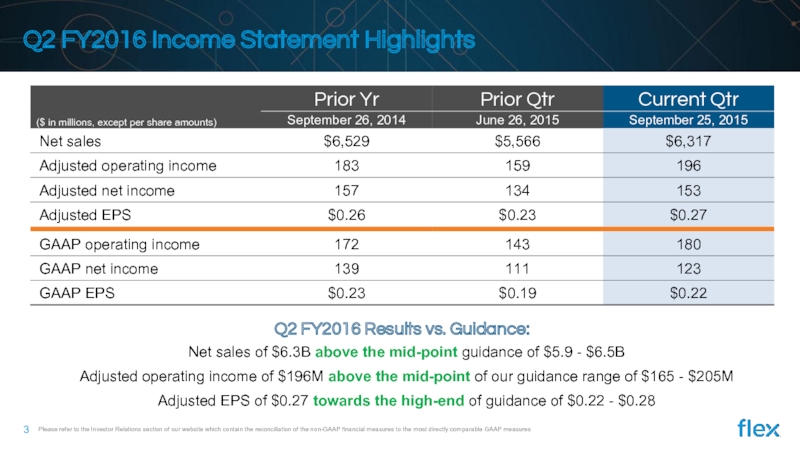
- 3. Q2 FY2016 Income Statement Highlights Please
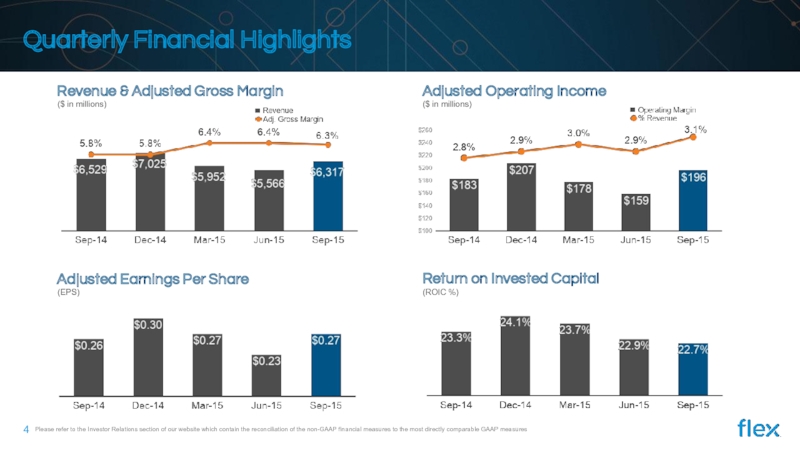
- 4. Quarterly Financial Highlights Please refer to the
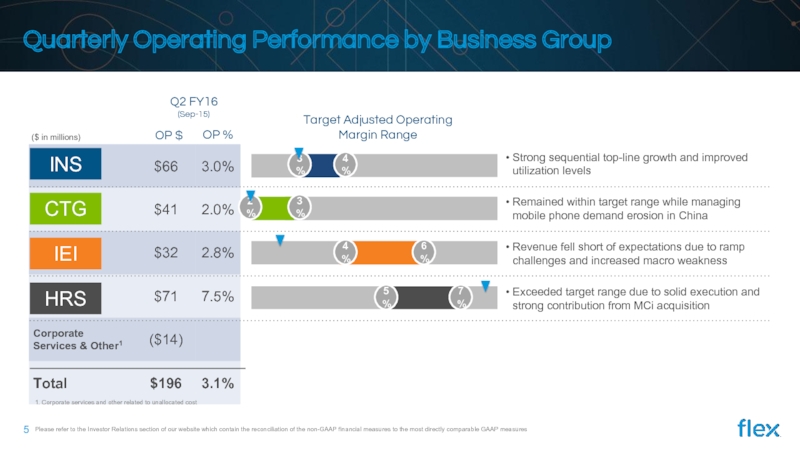
- 5. Quarterly Operating Performance by Business Group Please
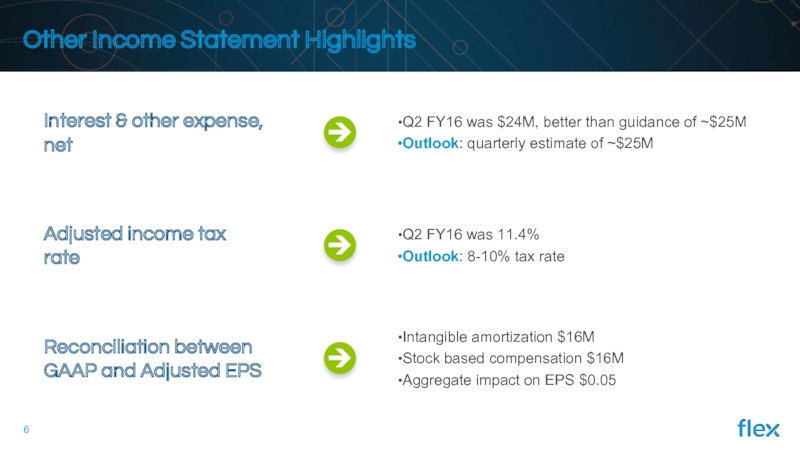
- 6. Other Income Statement Highlights Q2 FY16 was
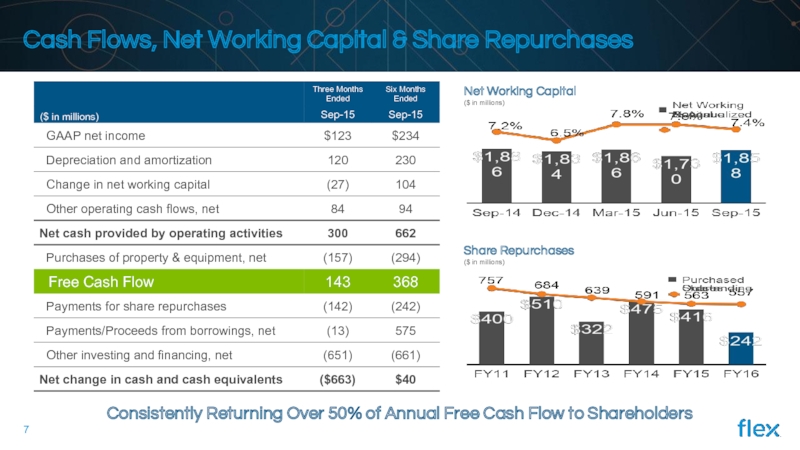
- 7. Cash Flows, Net Working Capital & Share
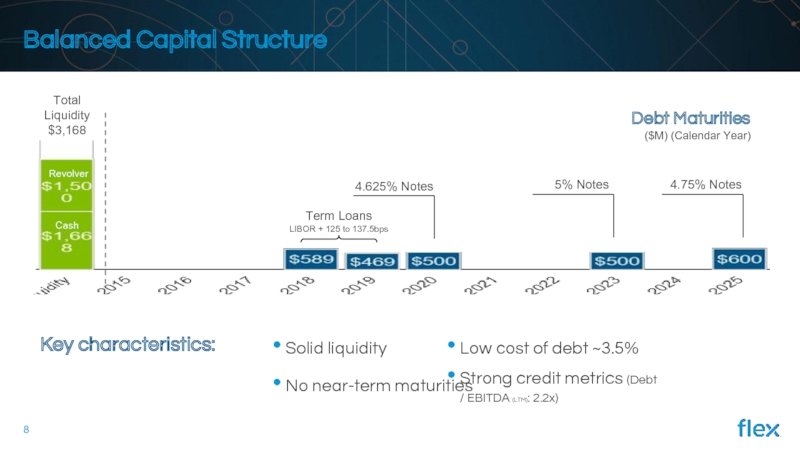
- 8. Balanced Capital Structure Key characteristics: No near-term
- 9. Q2 FY2016 Highlights and Key Trends Strong
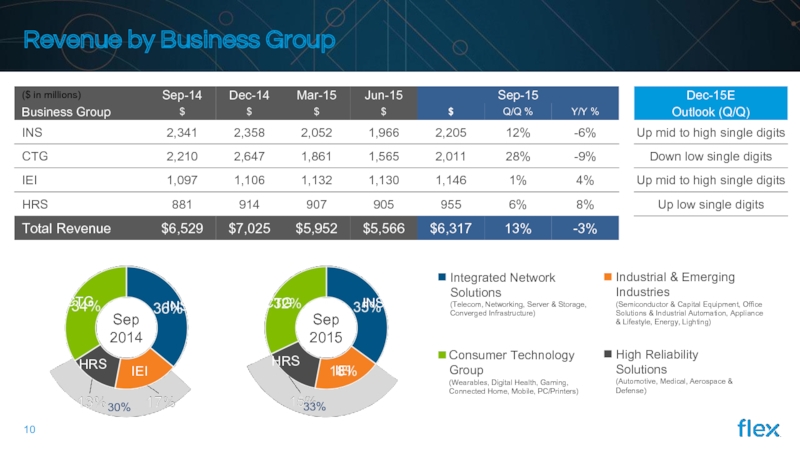
- 10. Revenue by Business Group
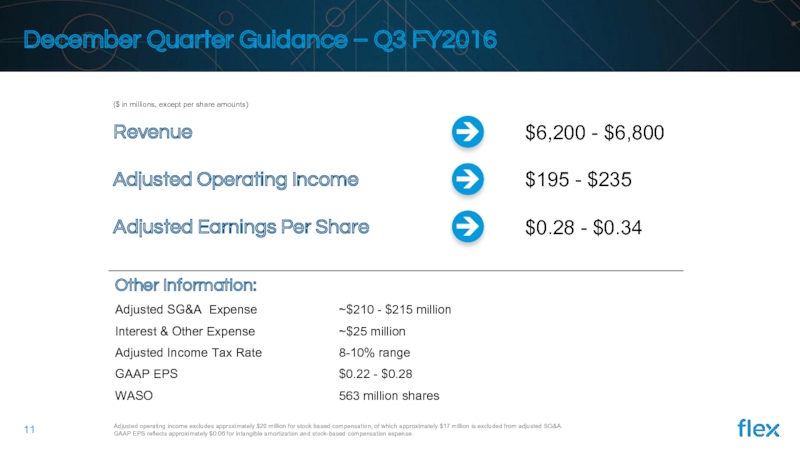
- 11. ($ in millions, except per share amounts)
- 12. For more information go to investors.flextronics.com
Слайд 2Risks and Non-GAAP Disclosures
This presentation contains forward-looking statements, which are based
If this presentation references non-GAAP financial measures, these measures are located on the “Investor Relations” section of our website, www.flextronics.com along with the required reconciliation to the most comparable GAAP financial measures.
Слайд 3Q2 FY2016 Income Statement Highlights
Please refer to the Investor Relations
Слайд 4Quarterly Financial Highlights
Please refer to the Investor Relations section of our
Return on Invested Capital
(ROIC %)
Adjusted Earnings Per Share
(EPS)
Adjusted Operating Income
($ in millions)
Revenue & Adjusted Gross Margin
($ in millions)
Слайд 5Quarterly Operating Performance by Business Group
Please refer to the Investor Relations
INS
CTG
HRS
($ in millions)
IEI
Target Adjusted Operating Margin Range
1. Corporate services and other related to unallocated cost
OP $
OP %
3%
5%
7%
3%
4%
4%
6%
Strong sequential top-line growth and improved utilization levels
Remained within target range while managing mobile phone demand erosion in China
Q2 FY16
(Sep-15)
Exceeded target range due to solid execution and strong contribution from MCi acquisition
Revenue fell short of expectations due to ramp challenges and increased macro weakness
2%
Слайд 6Other Income Statement Highlights
Q2 FY16 was $24M, better than guidance of
Outlook: quarterly estimate of ~$25M
Interest & other expense, net
Q2 FY16 was 11.4%
Outlook: 8-10% tax rate
Adjusted income tax rate
Intangible amortization $16M
Stock based compensation $16M
Aggregate impact on EPS $0.05
Reconciliation between GAAP and Adjusted EPS
Слайд 7Cash Flows, Net Working Capital & Share Repurchases
Consistently Returning Over 50%
Слайд 8Balanced Capital Structure
Key characteristics:
No near-term maturities
Low cost of debt ~3.5%
Solid liquidity
Strong
Слайд 9Q2 FY2016 Highlights and Key Trends
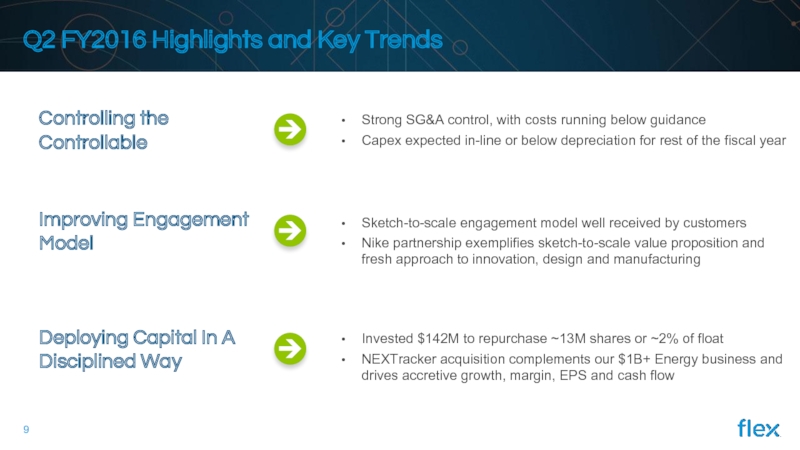
Strong SG&A control, with costs running
Capex expected in-line or below depreciation for rest of the fiscal year
Controlling the Controllable
Sketch-to-scale engagement model well received by customers
Nike partnership exemplifies sketch-to-scale value proposition and fresh approach to innovation, design and manufacturing
Improving Engagement Model
Invested $142M to repurchase ~13M shares or ~2% of float
NEXTracker acquisition complements our $1B+ Energy business and drives accretive growth, margin, EPS and cash flow
Deploying Capital In A Disciplined Way
Слайд 11($ in millions, except per share amounts)
Adjusted operating income excludes approximately
GAAP EPS reflects approximately $0.06 for intangible amortization and stock-based compensation expense.
$6,200 - $6,800
Revenue
$195 - $235
Adjusted Operating Income
$0.28 - $0.34
Adjusted Earnings Per Share
December Quarter Guidance – Q3 FY2016
