A.V. Meleshina1, V.V. Dudenkova1,2, A.S. Bystrova1,2, E.V. Zagaynova1,2
1Nizhny Novgorod State Medical Academy, Nizhny Novgorod, Russia
2Nizhny Novgorod State University, Nizhny Novgorod, Russia
A.V. Meleshina1, V.V. Dudenkova1,2, A.S. Bystrova1,2, E.V. Zagaynova1,2
1Nizhny Novgorod State Medical Academy, Nizhny Novgorod, Russia
2Nizhny Novgorod State University, Nizhny Novgorod, Russia


Genotype
• Polymerase chain reaction (PCR)
Differentiation potency
• Immunocytochemistry
• Fluorescence Microscopy + fluorescence dyes
/protein
• Fluorescence Lifetime Imaging Microscopy
(FLIM) +exso/endogenous markers
• Stochastic Optical Reconstruction Microscopy
(STORM) +fluorescence dyes/protein

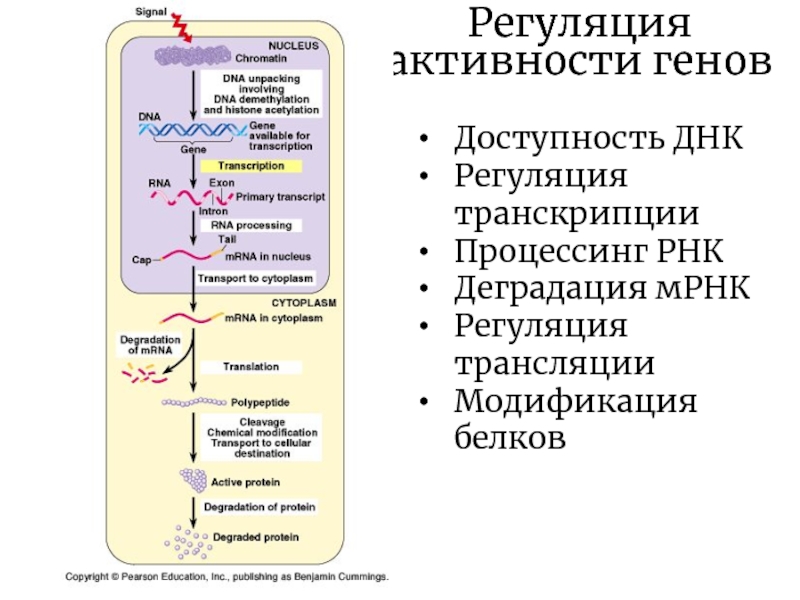
Metabolism: fluorescence microscopy and FLIM of NAD(P)H and FAD
pH: fluorescence microscopy and SypHer–2
• YFP, monomer
• two peaks of fluorescence excitation
(420 nm and 500 nm), peak emission 516 nm
• at alkaline pH values, the excitation peak at 420 nm
decreases, and at 500 nm - increases,
while for acidic - on the contrary
LSM 710 laser scanning confocal
microscope (Carl Zeiss, Germany)
FLIM system based on
Simple Tau 152 TCSPC system
(Becker & Hickl GmbH)
Nicotinamide adenine dinucleotide, NADH: excitation - 750 nm ,detection - 455-500 nm
Flavine adenine dinucleotide, FAD: excitation - 900 nm , detection – 500-550 nm
redox ratio FAD/NAD(P)H
Lifetimes
λ, nm

Viscosity: FLIM and Bodipy 2
Cytoskeleton: STORM and TagRFP
TagRFP
em=550nm
detection= 584nm
EclipseTi (Nikon, Japan),
module N-STORM, system PSF
ex = 800 nm,
detection range = 409-660 nm
Outline of the experiment

FAD:
excitation - 900 nm (5mW) ,
detection - 500-550 nm
image size is 213 × 213 μm
(1024 × 1024 pixels)
[Meleshina et al. Stem Cell Research & Therapy (2017) 8:15]
H changes during chondrogenic differentiationNADH: excitation -750 nm (5 mW)detection -")
Pseudocolor-coded FLIM images of the free (t1) and protein-bound (t2) forms of NAD(P)H.
For NAD(P)H: excitation - 750 nm, detection - 455–500 nm. Field of view 213*213μm (512*512 pixels)
H in MSCs during chondrogenic differentiation [Meleshina et al. Stem Cell Research")
days of differentiation
pH, a.u.
bias to acidic pH values
ex = 405 nm and 488 nm, detection range = 500-550 nm
[unpublished data]

Alcian blue staining
on acidic polysaccharides
Hematoxylin
staining
[Meleshina et al. Stem Cell Research & Therapy (2017) 8:15]
SHG of collagen was excited at wavelength of 750 nm and detected in the range 373-387 nm
the image size is 130×130 μm (512 × 512 pixels)


viscosity increase – cholesterol accumulation
viscosity, cP
days of differentiation
ex of Bodipy 2 = 800 nm, detection range = 409-660 nm
[unpublished data]

Undifferentiated MSCs
7 day
14 day
21 day
Increase of actin fibers thickness
ex of TagRFP = 555 nm, em=584 nm
[unpublished data]


M.V. Shirmanova
M.K. Kuimova
N.V. Klementieva
O. Furman
F.A. Kulagin
V.V. Dudenkova
A.S. Bystrova
E.V. Zagaynova
 M.V. ShirmanovaM.K.")
Если не удалось найти и скачать презентацию, Вы можете заказать его на нашем сайте. Мы постараемся найти нужный Вам материал и отправим по электронной почте. Не стесняйтесь обращаться к нам, если у вас возникли вопросы или пожелания:
Email: Нажмите что бы посмотреть
Это сайт презентаций, докладов, проектов, шаблонов в формате PowerPoint. Мы помогаем школьникам, студентам, учителям, преподавателям хранить и обмениваться учебными материалами с другими пользователями.