- Главная
- Разное
- Дизайн
- Бизнес и предпринимательство
- Аналитика
- Образование
- Развлечения
- Красота и здоровье
- Финансы
- Государство
- Путешествия
- Спорт
- Недвижимость
- Армия
- Графика
- Культурология
- Еда и кулинария
- Лингвистика
- Английский язык
- Астрономия
- Алгебра
- Биология
- География
- Детские презентации
- Информатика
- История
- Литература
- Маркетинг
- Математика
- Медицина
- Менеджмент
- Музыка
- МХК
- Немецкий язык
- ОБЖ
- Обществознание
- Окружающий мир
- Педагогика
- Русский язык
- Технология
- Физика
- Философия
- Химия
- Шаблоны, картинки для презентаций
- Экология
- Экономика
- Юриспруденция
Using Analytics To Make Smart HR Decisions презентация
Содержание
- 2. Rusty Lindquist VP Strategic HR
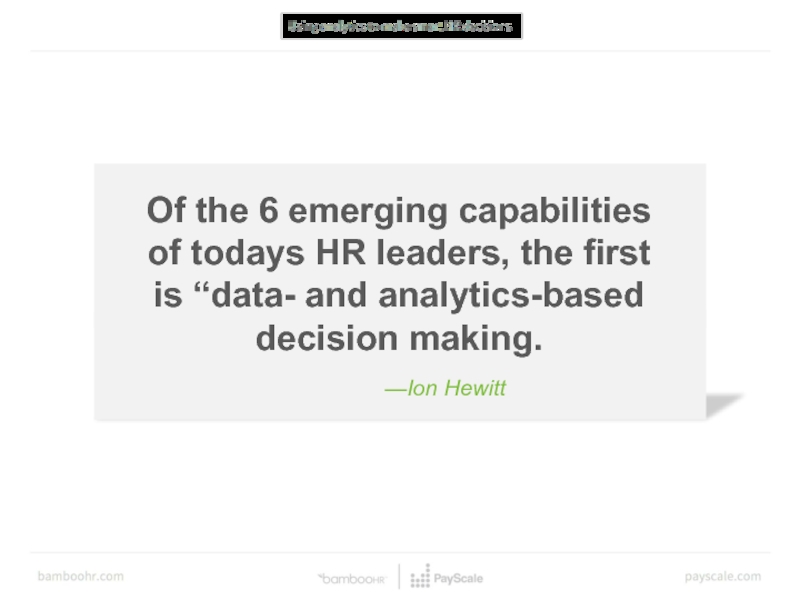
- 3. —Ion Hewitt Of the 6
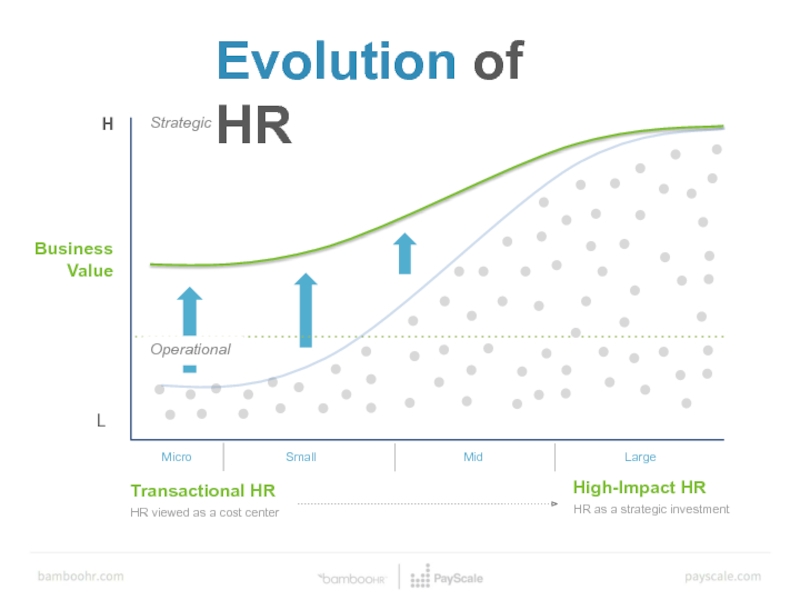
- 4. Evolution of HR Business Value
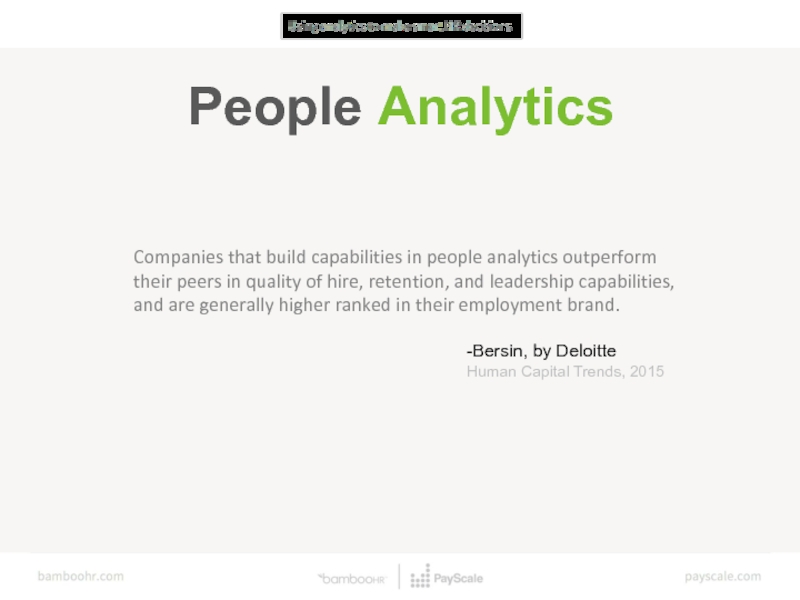
- 5. People Analytics Companies that build capabilities
- 6. Competency Gap Three in four surveyed
- 7. Competency Gap Too few organizations are
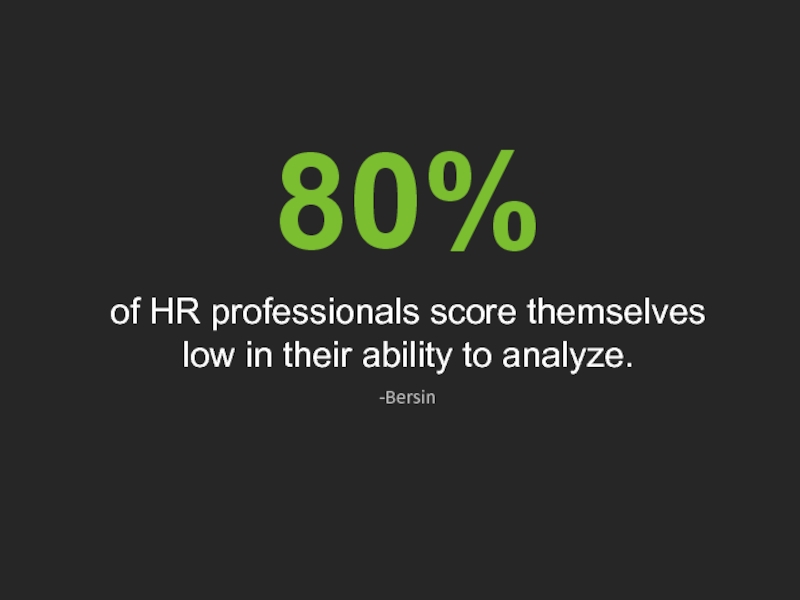
- 9. of HR professionals score themselves low in their ability to analyze. 80% -Bersin
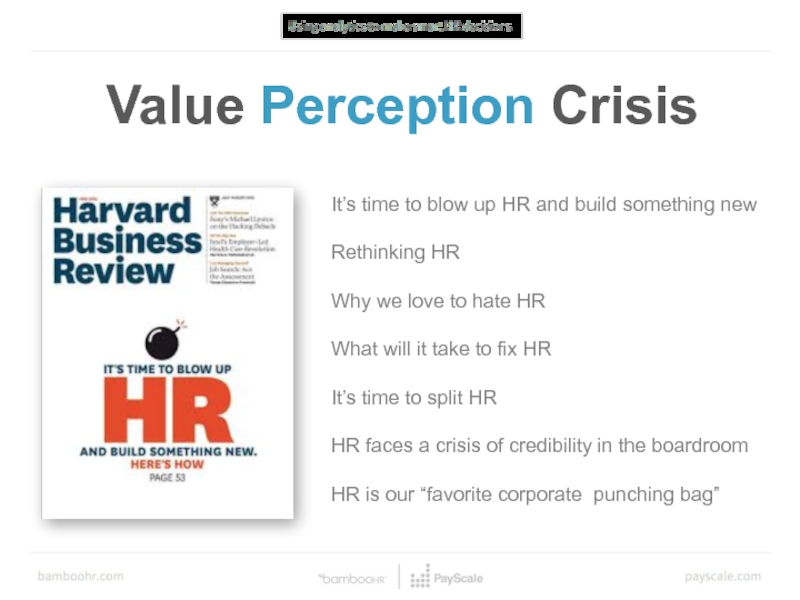
- 10. It’s time to blow up HR and
- 11. It’s more than just Competency Outdated Technologies
- 12. How do we fix it?
- 13. Increase exposure to the data you do use
- 14. Identify the data you need
- 15. Data is not the point
- 16. Suck Threshold Features Suck Threshold Not
- 17. Suck Threshold What Matters Most Not doing
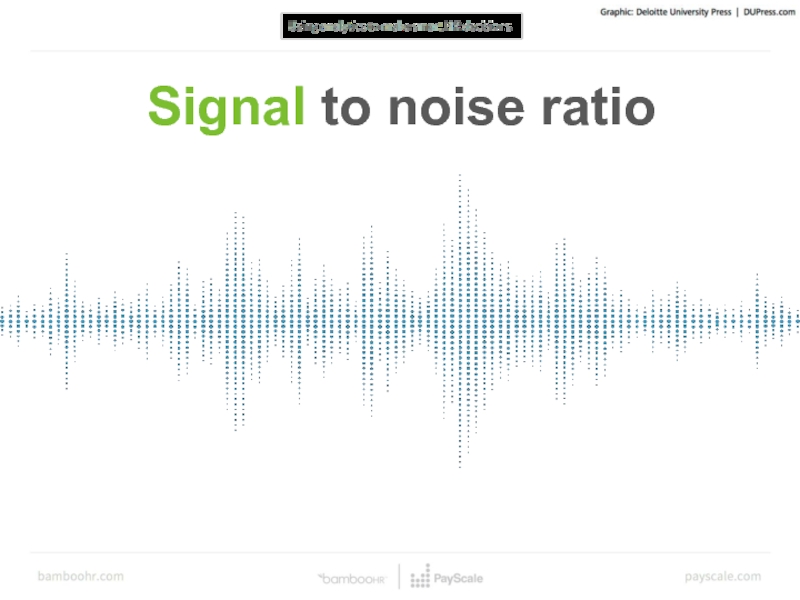
- 18. Signal to noise ratio
- 19. Align With Strategy
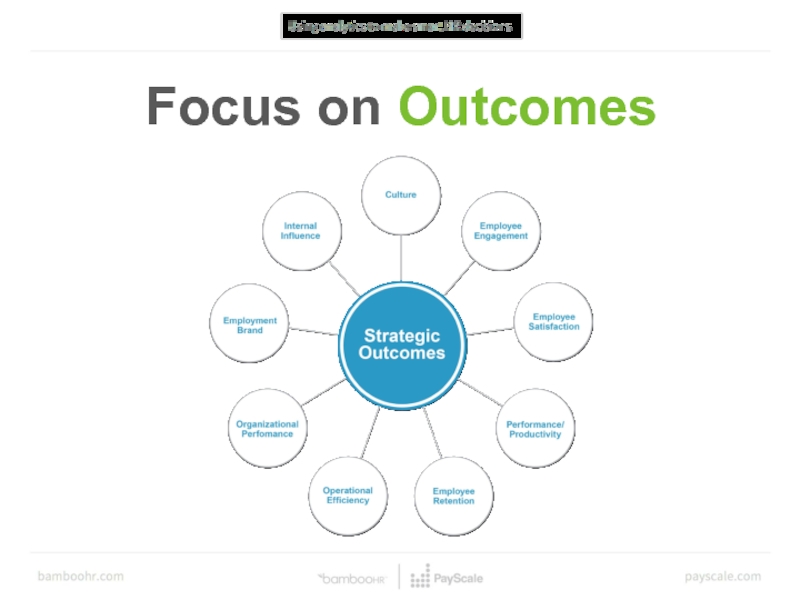
- 20. Focus on Outcomes
- 21. Examples: Comp Analytics
- 22. What are comp analytics
- 23. Range Midpoint Minimum Maximum $20,000
- 24. Range Width [=(max-min)/min] How
- 25. Range Penetration [=(EE Pay-min)/(max-min)] How
- 26. Compa-Ratio [=EE Pay/Mid] Are we on
- 27. Communicating With Execs About Compensation
- 28. How are we doing? What’s the
- 29. Cost to bring Green Outliers to range
- 30. Are we keeping up with the
- 31. Sample Market Ratio Report Are we keeping up with the market?
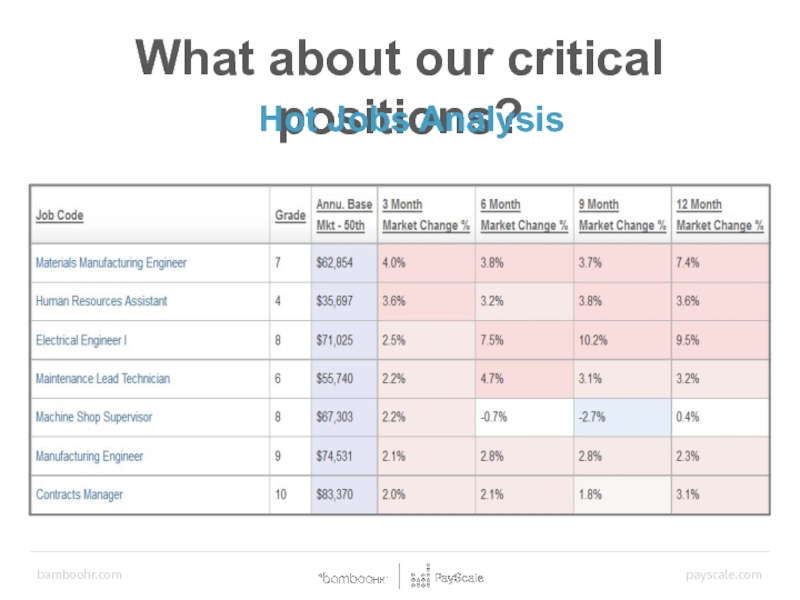
- 32. What about our critical positions?
- 33. What about our critical positions? Hot Jobs Analysis
- 34. How are our top performers doing?
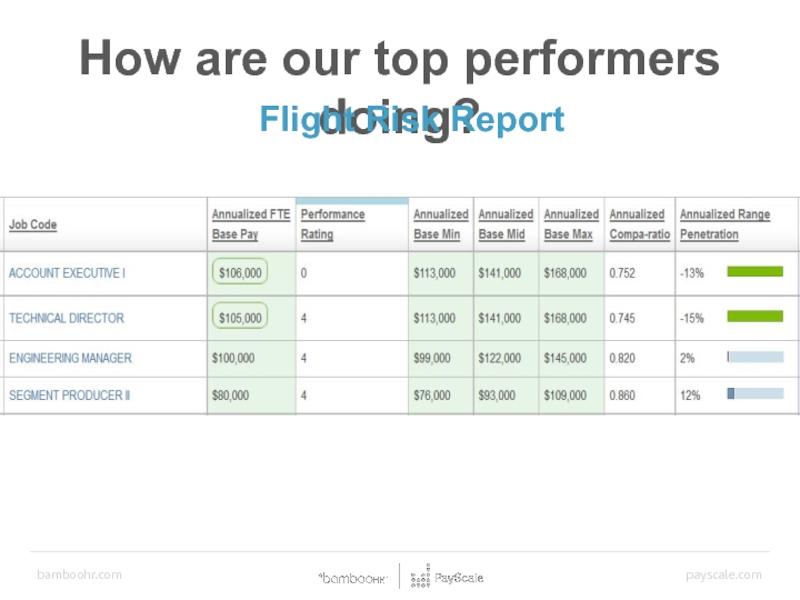
- 35. How are our top performers doing? Flight
- 36. What’s the real concern? Where are we
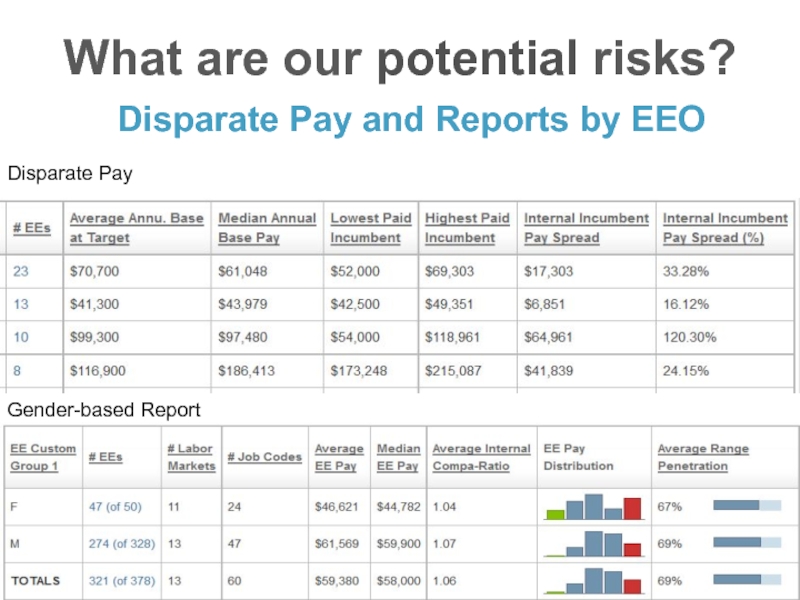
- 37. Are there any potential risks? Disparate Pay
- 38. What’s the real concern? We’ve had a
- 39. Any turnover issues? Calculating the Cost
- 40. Examples of Recruitment Measures Examples of
- 41. Flight Risk - # flight risk
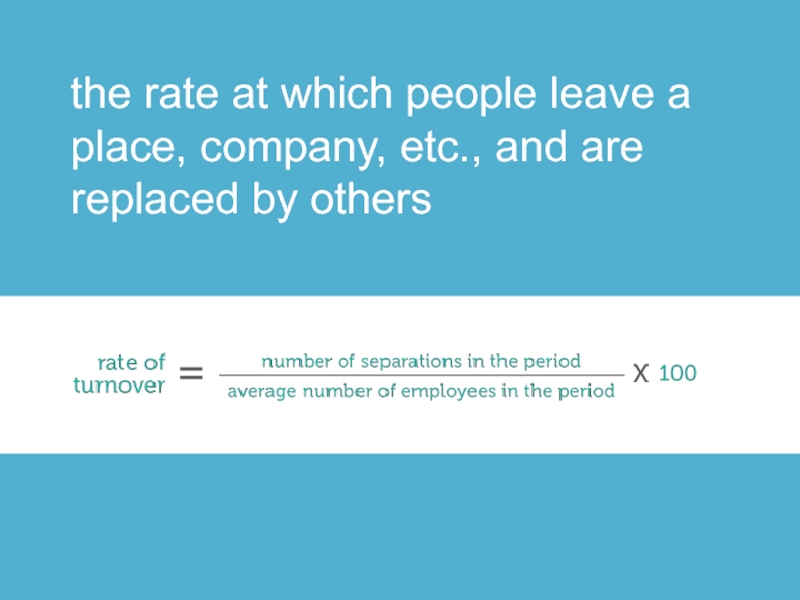
- 42. the rate at which people
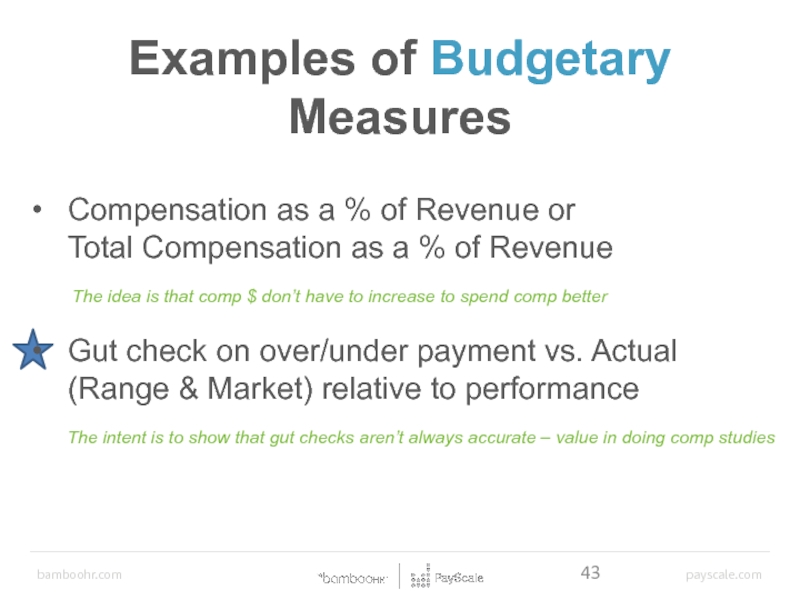
- 43. Examples of Budgetary Impact Measures Compensation
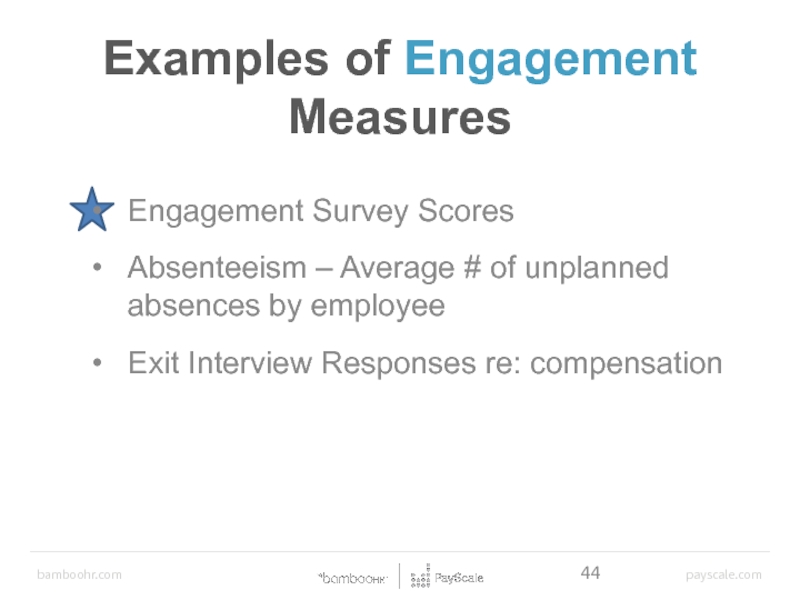
- 44. Examples of Engagement Measures Engagement Survey
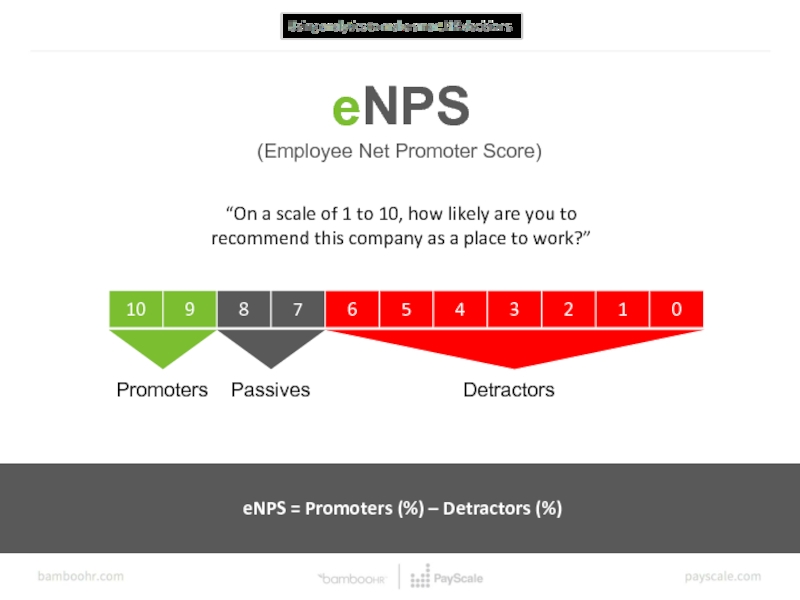
- 45. eNPS (Employee Net Promoter Score) “On
- 46. General Guidelines Start small (the journey of
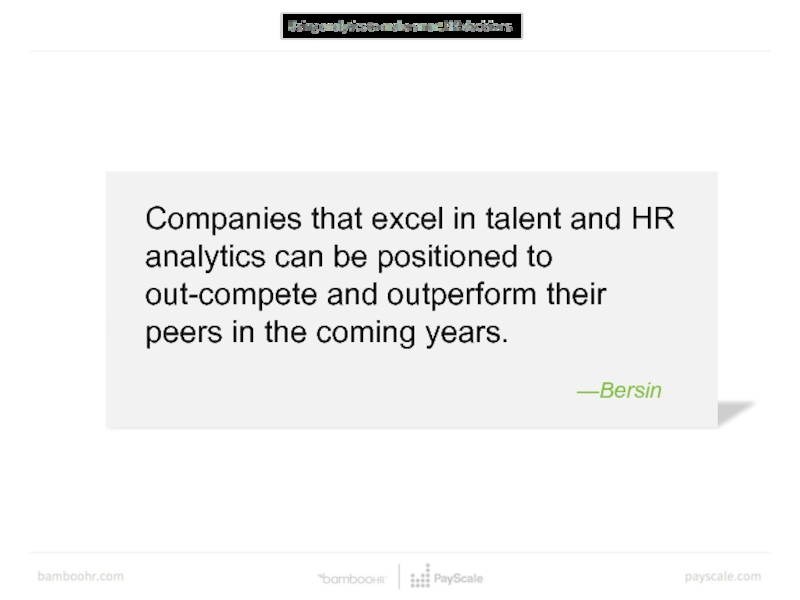
- 47. Companies that excel in talent
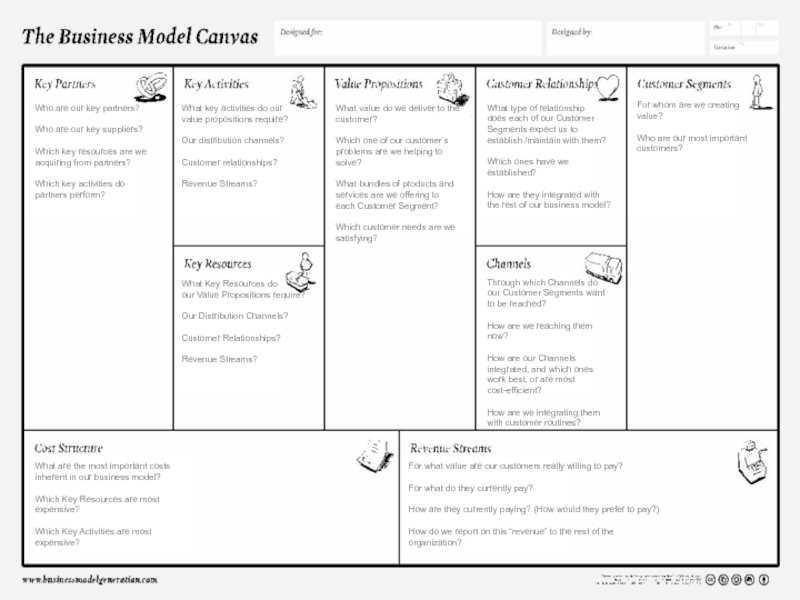
- 48. Who are our key partners?
- 49. Follow BambooHR and PayScale on social media:
- 50. Questions? BambooHR Receive a free job
Слайд 2
Rusty Lindquist
VP Strategic HR Insights
BambooHR
Mykkah Herner
Head of Professional Services
PayScale
Слайд 3
—Ion Hewitt
Of the 6 emerging capabilities of todays HR leaders, the
Слайд 5
People Analytics
Companies that build capabilities in people analytics outperform their peers
-Bersin, by Deloitte
Human Capital Trends, 2015
Слайд 6
Competency Gap
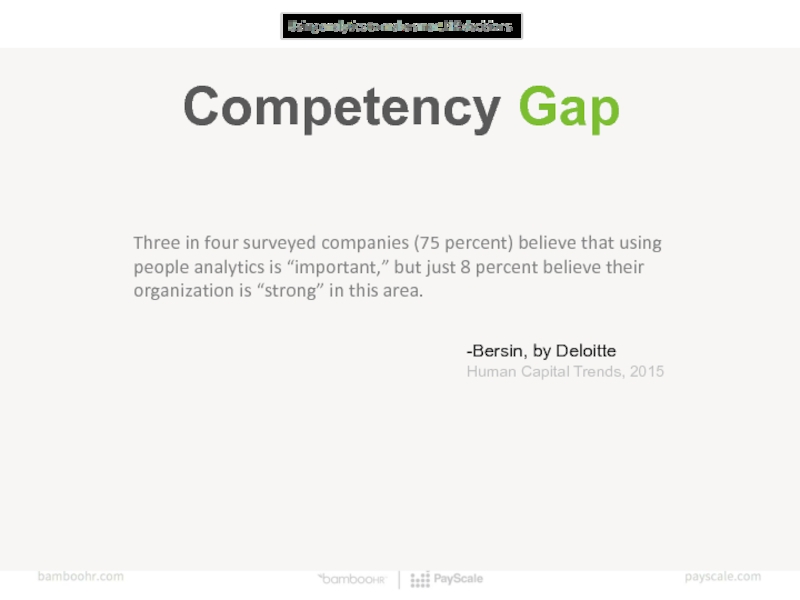
Three in four surveyed companies (75 percent) believe that using
-Bersin, by Deloitte
Human Capital Trends, 2015
Слайд 7
Competency Gap
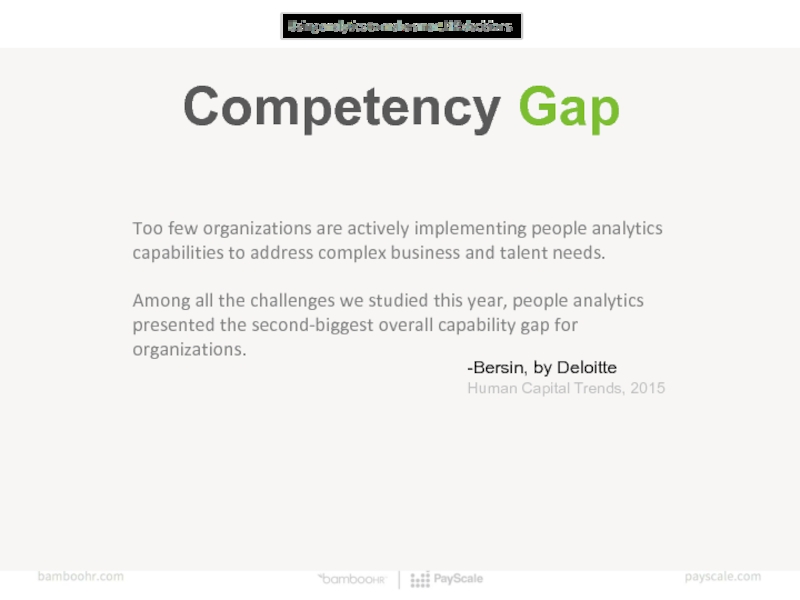
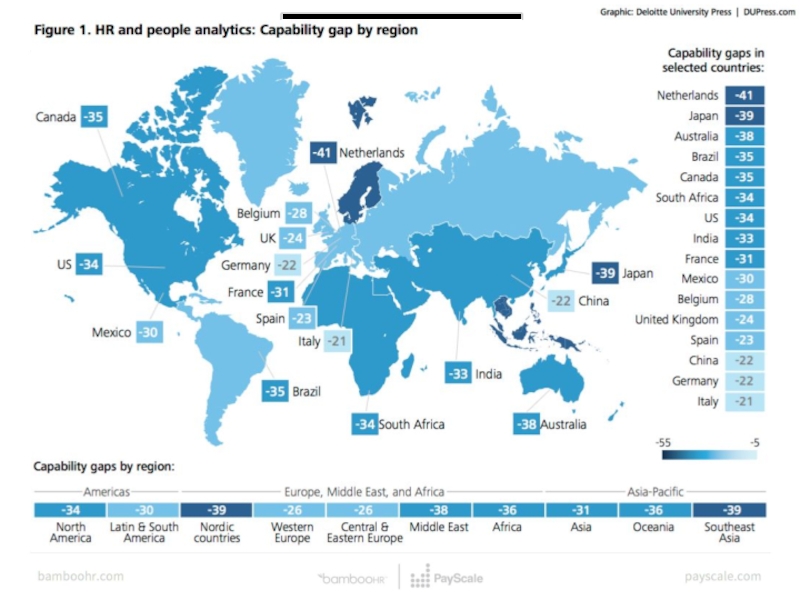
Too few organizations are actively implementing people analytics capabilities to
Among all the challenges we studied this year, people analytics presented the second-biggest overall capability gap for organizations.
-Bersin, by Deloitte
Human Capital Trends, 2015
Слайд 10It’s time to blow up HR and build something new
Rethinking HR
Why we love to hate HR
What will it take to fix HR
It’s time to split HR
HR faces a crisis of credibility in the boardroom
HR is our “favorite corporate punching bag”
Value Perception Crisis
Слайд 11It’s more than just Competency
Outdated Technologies (like spreadsheets)
Need for data consolidation
Need to look externally
Waiting too long to start measuring
Don’t know what to measure and how
Слайд 16
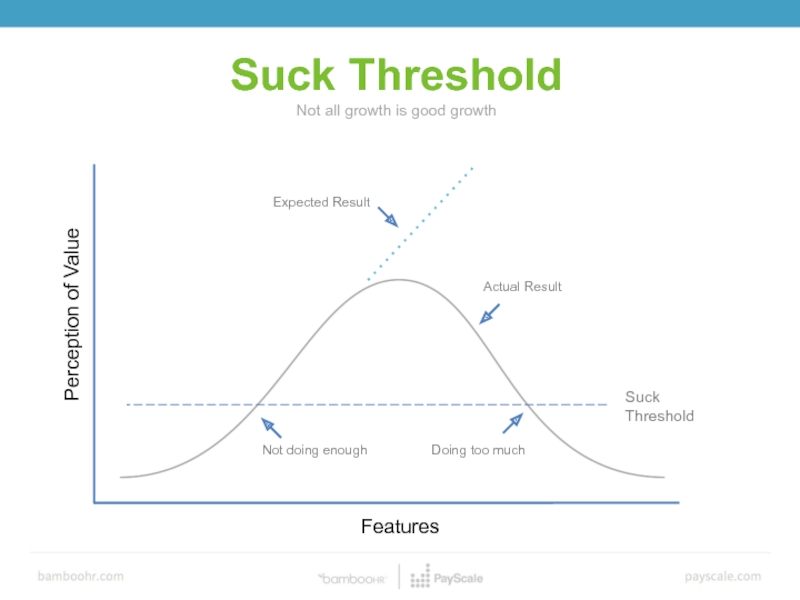
Suck Threshold
Features
Suck Threshold
Not all growth is good growth
Expected Result
Actual Result
Perception of
Not doing enough
Doing too much
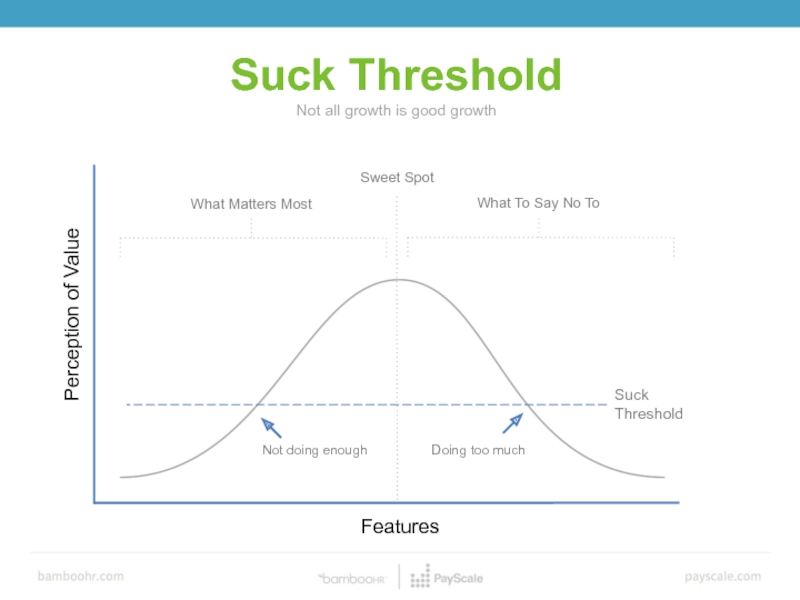
Слайд 17Suck Threshold
What Matters Most
Not doing enough
Doing too much
What To Say No
Sweet Spot
Features
Not all growth is good growth
Perception of Value
Suck Threshold
Слайд 22
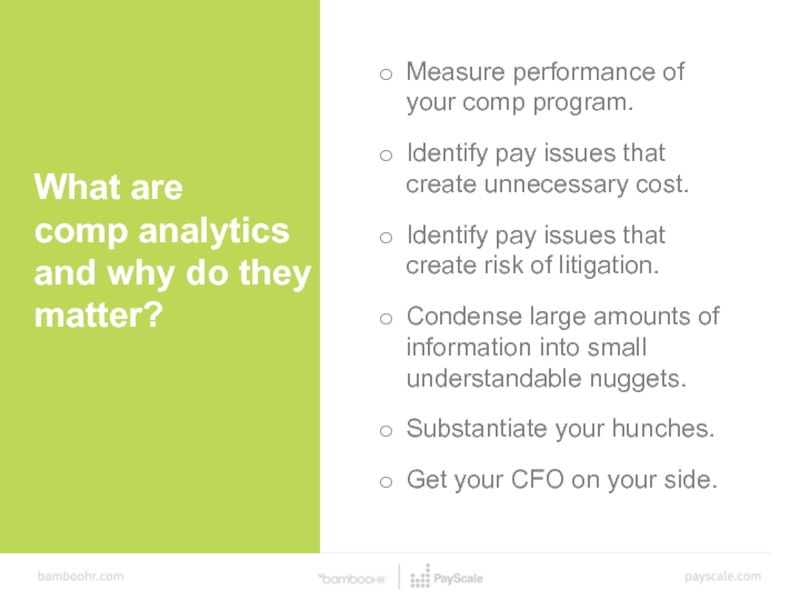
What are
comp analytics
and why do they matter?
Measure performance of
Identify pay issues that create unnecessary cost.
Identify pay issues that create risk of litigation.
Condense large amounts of information into small understandable nuggets.
Substantiate your hunches.
Get your CFO on your side.
Слайд 23
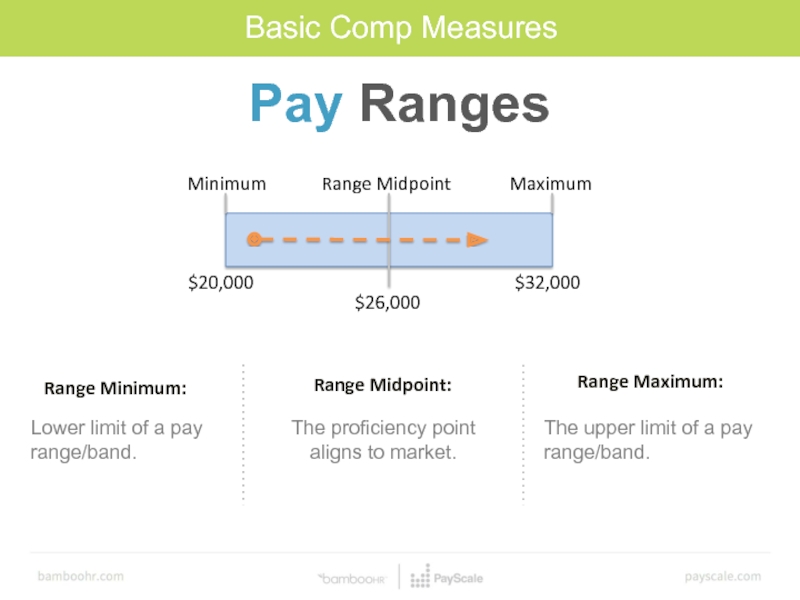
Range Midpoint
Minimum
Maximum
$20,000
$32,000
$26,000
Range Midpoint:
Range Minimum:
Range Maximum:
Lower limit of a pay range/band.
The proficiency
The upper limit of a pay range/band.
Basic Comp Measures
Pay Ranges
Слайд 24
Range Width [=(max-min)/min]
How much flexibility do we give our managers
Midpoint Differential [=(midpoint grade2-midpoint grade1)/midpoint grade1)]
Do we have a more or less hierarchical org structure? Positions with multiple levels?
Understanding Range Math
Слайд 25
Range Penetration [=(EE Pay-min)/(max-min)]
How well are employees moving through their
Green-Circled Employees [Below bottom of range]
We may be untruthful and/or paying un”fair”ly.
Red-Circled Employees [Above top of range]
These are employees we decide to pay more, even though the data doesn’t support it.
Using Ranges
Слайд 26
Compa-Ratio [=EE Pay/Mid]
Are we on track with our pay philosophy?
Market Ratio
How are we doing vs our competitors?
Midpoint to Market Delta [=(Mid-Market)/Market]
Are our ranges current to market?
Measuring Plan Performance
Слайд 28
How are we doing?
What’s the real concern
Comp is something nebulous that
I’m afraid we’re far far away from the market
What’s the response
Educate and update execs regularly on the comp info they need to know
Proof
Market-Ratio – report for the org and by dept*
Compa-Ratio – report for the org and by dept. Provide individual info to managers, as appropriate
Слайд 29Cost to bring Green Outliers to range minimum:
$115,041 or 2.02%
Amount
$115,041 or 2.02%
Sample Compa Ratio Report
How are we doing?
Слайд 30
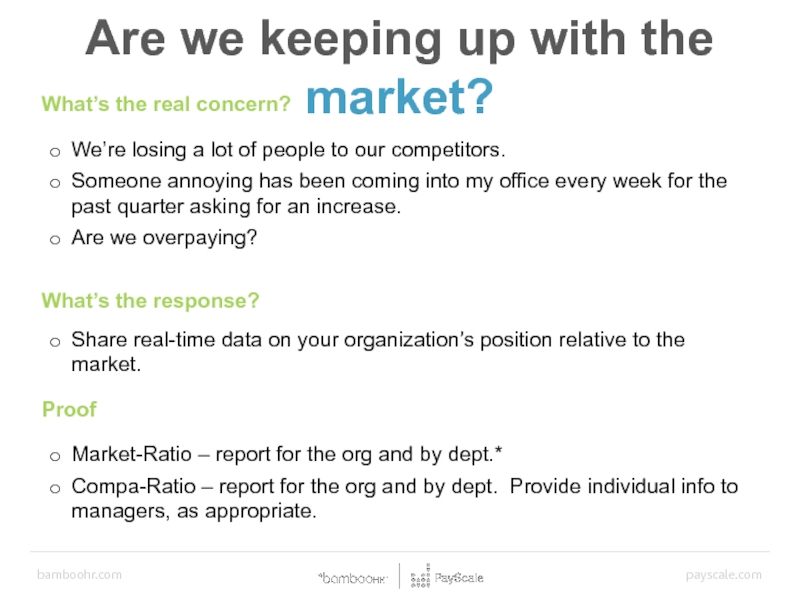
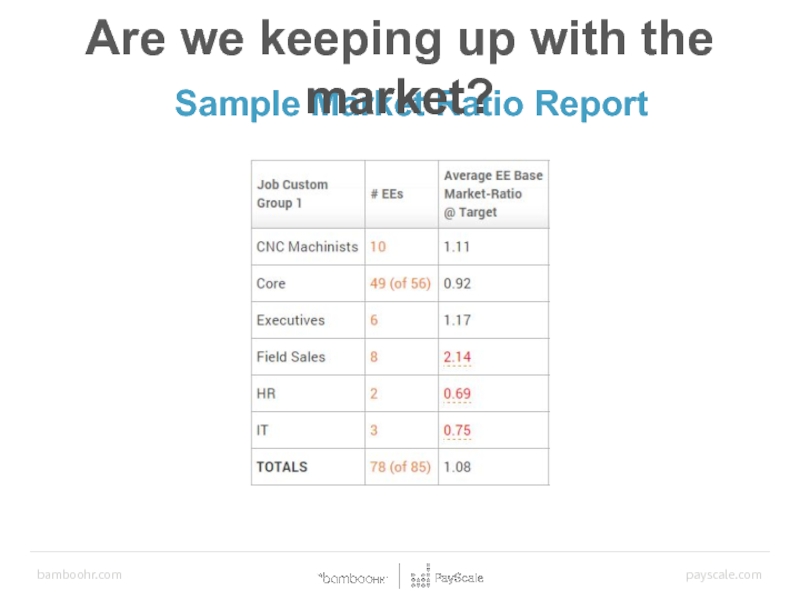
Are we keeping up with the market?
What’s the real concern?
We’re losing
Someone annoying has been coming into my office every week for the past quarter asking for an increase.
Are we overpaying?
What’s the response?
Share real-time data on your organization’s position relative to the market.
Proof
Market-Ratio – report for the org and by dept.*
Compa-Ratio – report for the org and by dept. Provide individual info to managers, as appropriate.
Слайд 32
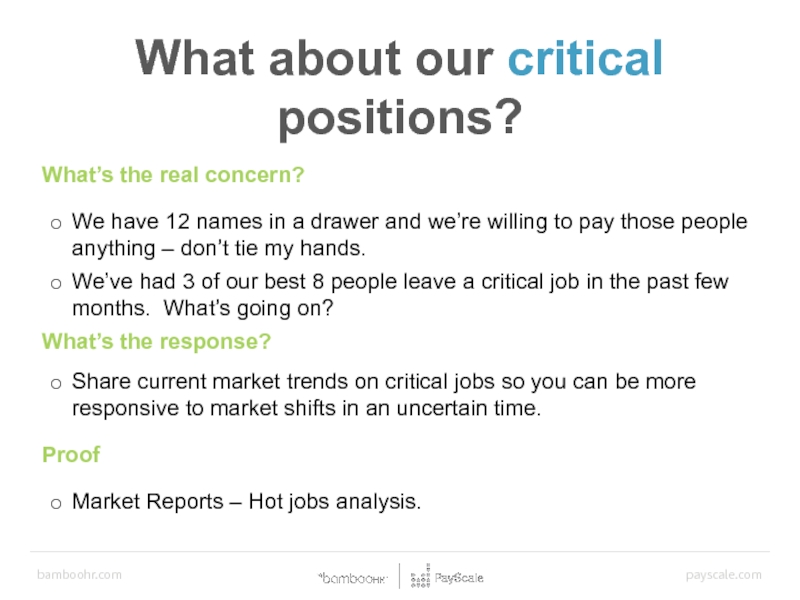
What about our critical positions?
What’s the real concern?
We have 12 names
We’ve had 3 of our best 8 people leave a critical job in the past few months. What’s going on?
What’s the response?
Share current market trends on critical jobs so you can be more responsive to market shifts in an uncertain time.
Proof
Market Reports – Hot jobs analysis.
Слайд 34
How are our top performers doing?
What’s the real concern?
We just lost
What’s the response?
Share info about where your top performers fall in range.
Proof
Flight Risk Report.
Underpaid over-achievers.
Слайд 35How are our top performers doing? Flight Risk Report
How are our
Flight Risk Report
Слайд 36What’s the real concern?
Where are we open to law suits?
We have
What’s the response?
Share info on disparate pay/potential risk areas.
Provide assurance that there are no risk issues.
Proof
Disparate pay report, divided by EEO classes.
What are our potential risks?
Слайд 37Are there any potential risks?
Disparate Pay and Reports by EEO
Gender-based Report
What
Disparate Pay and Reports by EEO
Disparate Pay
Слайд 38What’s the real concern?
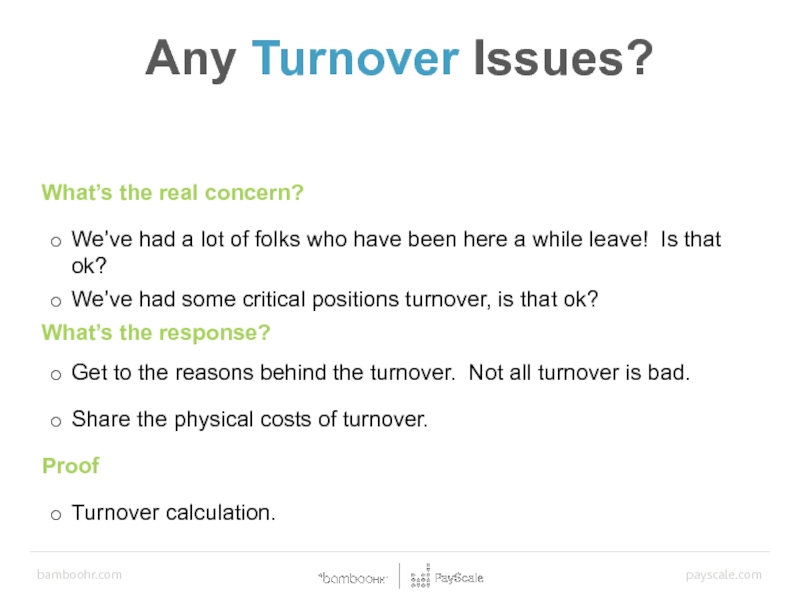
We’ve had a lot of folks who have
We’ve had some critical positions turnover, is that ok?
What’s the response?
Get to the reasons behind the turnover. Not all turnover is bad.
Share the physical costs of turnover.
Proof
Turnover calculation.
Any Turnover Issues?
Слайд 39Any turnover issues?
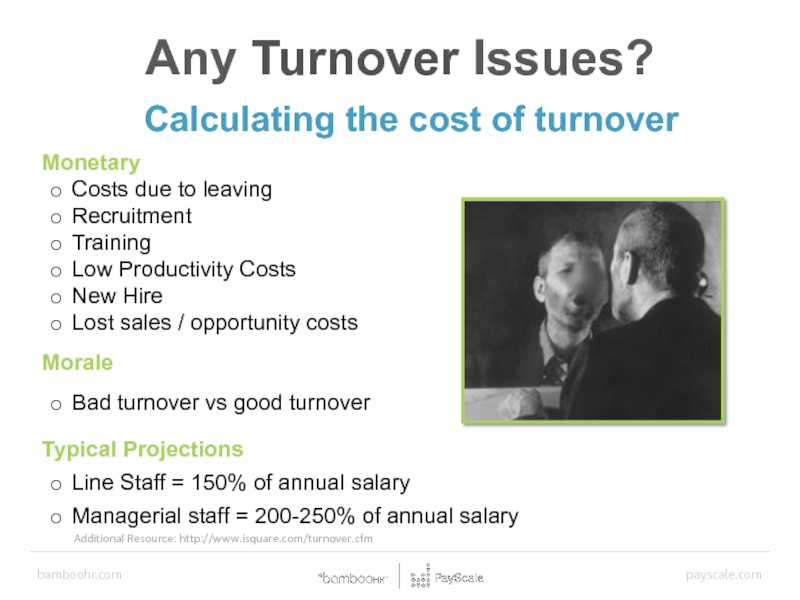
Calculating the Cost of Turnover
Additional Resource: http://www.isquare.com/turnover.cfm
Any Turnover
Calculating the cost of turnover
Monetary
Costs due to leaving
Recruitment
Training
Low Productivity Costs
New Hire
Lost sales / opportunity costs
Morale
Bad turnover vs good turnover
Typical Projections
Line Staff = 150% of annual salary
Managerial staff = 200-250% of annual salary
Слайд 40Examples of Recruitment Measures
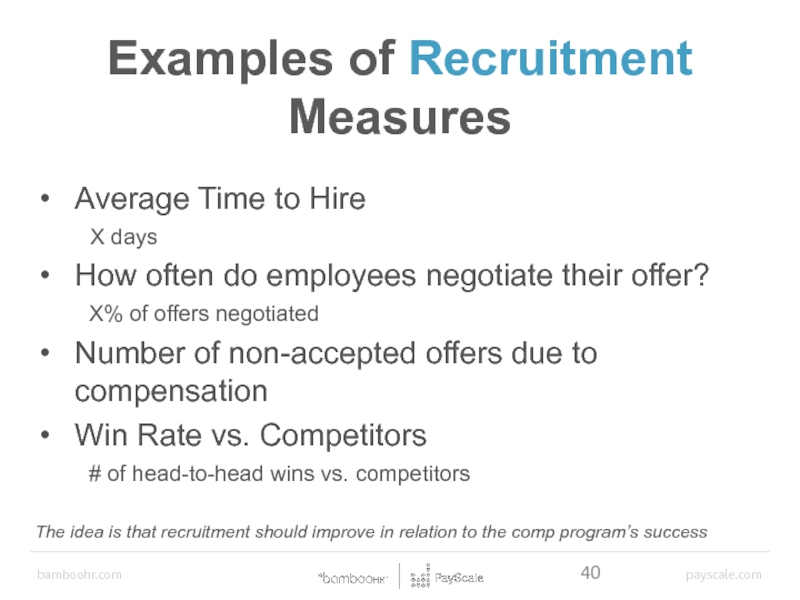
Examples of Recruitment
Measures
Average Time to Hire
How often do employees negotiate their offer?
X% of offers negotiated
Number of non-accepted offers due to compensation
Win Rate vs. Competitors
# of head-to-head wins vs. competitors
The idea is that recruitment should improve in relation to the comp program’s success
Слайд 41
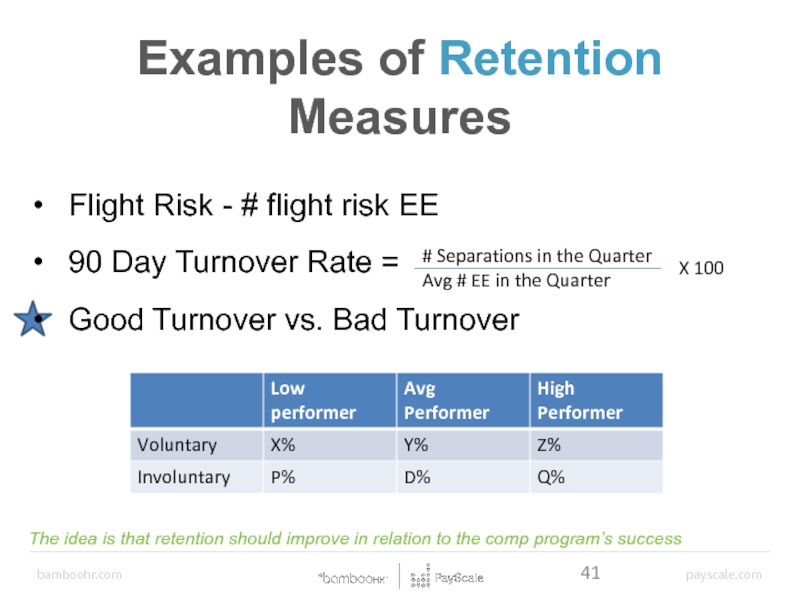
Flight Risk - # flight risk EE
90 Day Turnover Rate =
Good
The idea is that retention should improve in relation to the comp program’s success
Examples of Retention Measures
Examples of Retention
Measures
Слайд 43Examples of Budgetary Impact Measures
Compensation as a % of Revenue or
The idea is that comp $ don’t have to increase to spend comp better
Gut check on over/under payment vs. Actual (Range & Market) relative to performance
The intent is to show that gut checks aren’t always accurate – value in doing comp studies
Examples of Budgetary
Measures
Слайд 44
Examples of Engagement Measures
Engagement Survey Scores
Absenteeism – Average # of unplanned
Exit Interview Responses re: compensation
Examples of Engagement
Measures
Слайд 45
eNPS
(Employee Net Promoter Score)
“On a scale of 1 to 10, how
10
9
8
7
6
5
4
3
2
1
0
Promoters
Passives
Detractors
eNPS = Promoters (%) – Detractors (%)
Слайд 46General Guidelines
Start small (the journey of a thousand miles)
Pick something meaningful
Align your efforts with your business strategy
Build (or hire) competency in your team
Partner with IT
Focus on ROI
Leverage technology
Слайд 47
Companies that excel in talent and HR analytics can be positioned
—Bersin
Слайд 48
Who are our key partners?
Who are our key suppliers?
Which key resources
Which key activities do partners perform?
What key activities do our value propositions require?
Our distribution channels?
Customer relationships?
Revenue Streams?
What value do we deliver to the customer?
Which one of our customer’s problems are we helping to solve?
What bundles of products and services are we offering to each Customer Segment?
Which customer needs are we satisfying?
What type of relationship
does each of our Customer Segments expect us to establish /maintain with them?
Which ones have we established?
How are they integrated with the rest of our business model?
For whom are we creating value?
Who are our most important customers?
Through which Channels do our Customer Segments want to be reached?
How are we reaching them now?
How are our Channels integrated, and which ones work best, or are most cost-efficient?
How are we integrating them with customer routines?
What Key Resources do
our Value Propositions require?
Our Distribution Channels?
Customer Relationships?
Revenue Streams?
What are the most important costs inherent in our business model?
Which Key Resources are most expensive?
Which Key Activities are most expensive?
For what value are our customers really willing to pay?
For what do they currently pay?
How are they currently paying? (How would they prefer to pay?)
How do we report on this “revenue” to the rest of the organization?
Слайд 49Follow BambooHR and PayScale on social media:
bamboohr.com/blog | payscale.com/compensation-today
Thank you!
Слайд 50Questions?
BambooHR
Receive a free job posting on our ATS and full HRIS
We will contact everyone within the next few days to set this up.
Download our free eBook: Communicating Compensation: Your guide to tackling tough conversations about pay
PayScale





![Range Width [=(max-min)/min] How much flexibility do we give our managers in setting pay? Midpoint](/img/tmb/3/275219/87cc7410c2e326b8670bc8de0004a9a1-800x.jpg)
![Range Penetration [=(EE Pay-min)/(max-min)] How well are employees moving through their ranges – do the](/img/tmb/3/275219/bf7ef157694e86792edd9ae8dbd8f494-800x.jpg)
![Compa-Ratio [=EE Pay/Mid]Are we on track with our pay philosophy?Market Ratio [=EE Pay/Market] How are](/img/tmb/3/275219/1e7bd6387678f50b0ff841f2d1ebdefb-800x.jpg)
