- Главная
- Разное
- Дизайн
- Бизнес и предпринимательство
- Аналитика
- Образование
- Развлечения
- Красота и здоровье
- Финансы
- Государство
- Путешествия
- Спорт
- Недвижимость
- Армия
- Графика
- Культурология
- Еда и кулинария
- Лингвистика
- Английский язык
- Астрономия
- Алгебра
- Биология
- География
- Детские презентации
- Информатика
- История
- Литература
- Маркетинг
- Математика
- Медицина
- Менеджмент
- Музыка
- МХК
- Немецкий язык
- ОБЖ
- Обществознание
- Окружающий мир
- Педагогика
- Русский язык
- Технология
- Физика
- Философия
- Химия
- Шаблоны, картинки для презентаций
- Экология
- Экономика
- Юриспруденция
RF Management Software презентация
Содержание
- 1. RF Management Software
- 2. Features & Functionality Monitor & Troubleshooting
- 3. RF Manager v1.0 Feature Set Windows XP
- 4. Planning Predicted Heatmaps for Planning Manual
- 5. Planning User ‘admin’ logins and selects the
- 6. Planning
- 7. Planning
- 8. Planning
- 9. Troubleshooting Functionality 4 – Catagories/Tabs Troubleshooting
- 10. Troubleshooting Functionality 4 – Categories/Tabs - continued
- 11. Software is provided as Windows XP
- 12. Software Installation - Licensing Installation will
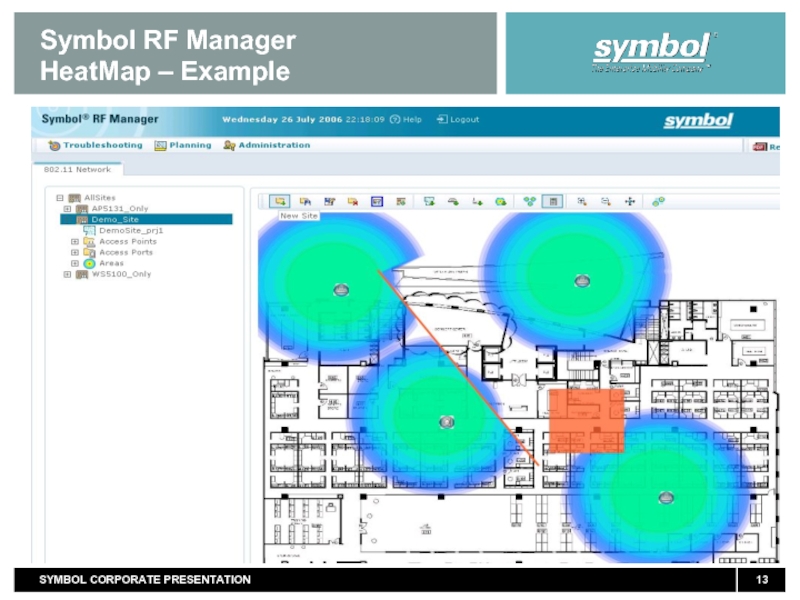
- 13. Symbol RF Manager HeatMap – Example
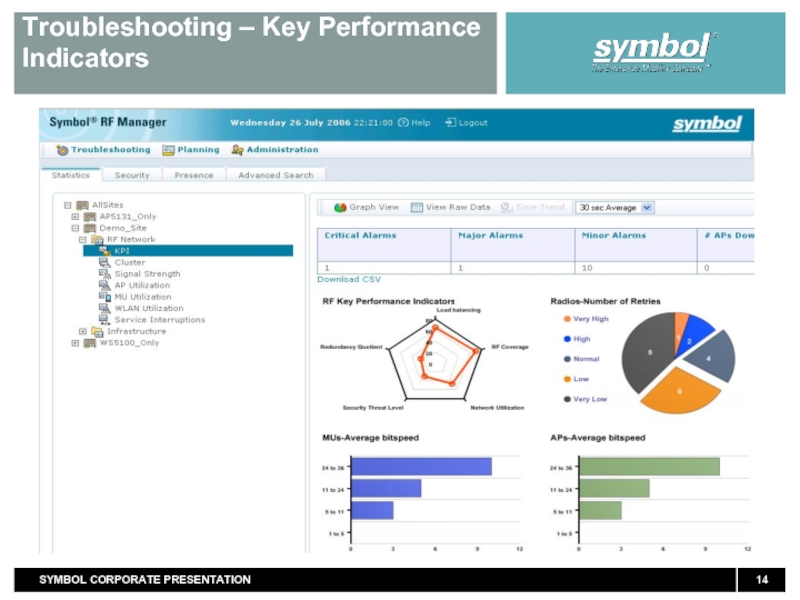
- 14. Troubleshooting – Key Performance Indicators
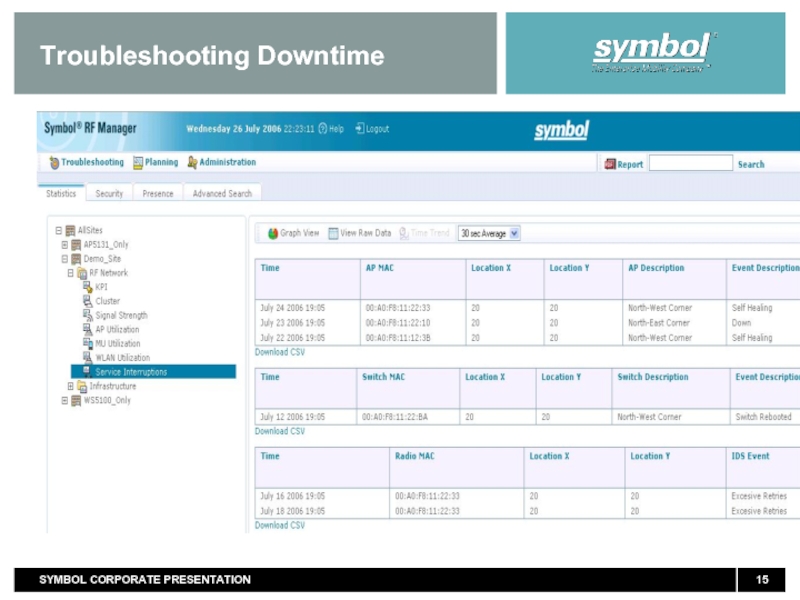
- 15. Troubleshooting Downtime
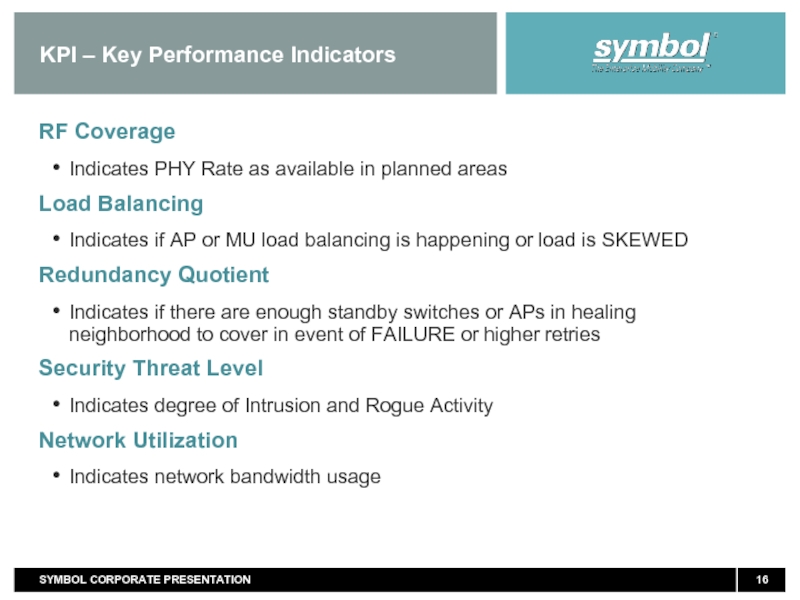
- 16. KPI – Key Performance Indicators RF Coverage
- 17. Common RF Manager Tasks Planning Preparing
- 18. Reactive Troubleshooting- Various Scenarios One of the
- 19. RF Manager v2.0 Planned Features Real-time Heat
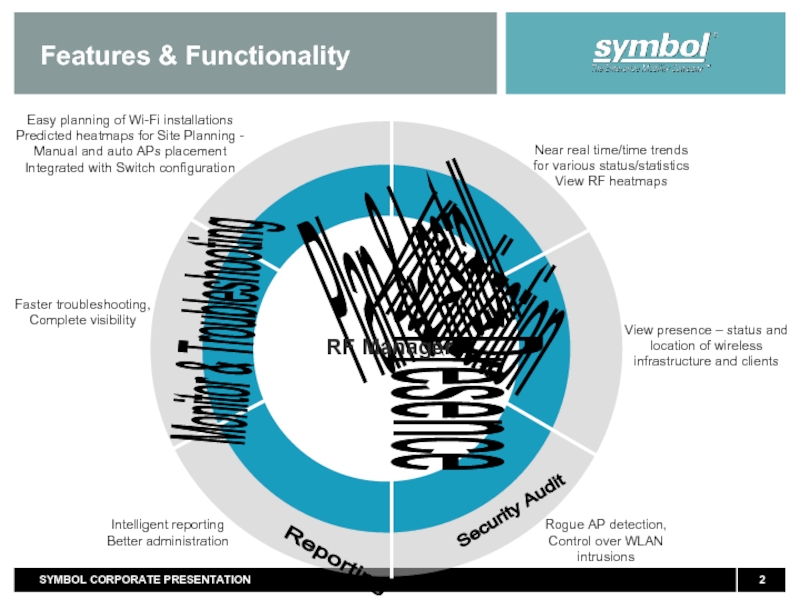
Слайд 2Features & Functionality
Monitor & Troubleshooting
Presence
Visualization
Plan & Install
Reporting
Security Audit
Easy planning of Wi-Fi installations
Predicted heatmaps for Site Planning - Manual and auto APs placement
Integrated with Switch configuration
Intelligent reporting
Better administration
Faster troubleshooting,
Complete visibility
Rogue AP detection, Control over WLAN intrusions
Near real time/time trends for various status/statistics
View RF heatmaps
View presence – status and location of wireless infrastructure and clients
RF Manager
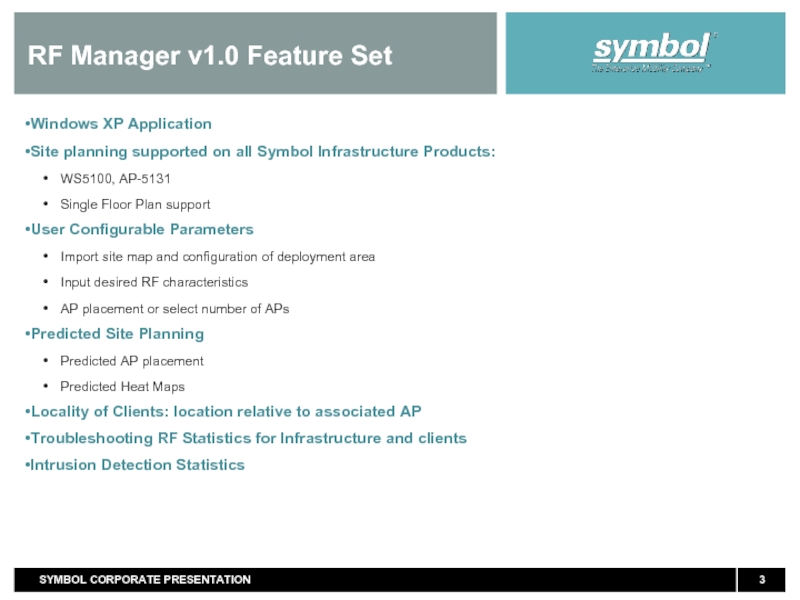
Слайд 3RF Manager v1.0 Feature Set
Windows XP Application
Site planning supported on all
WS5100, AP-5131
Single Floor Plan support
User Configurable Parameters
Import site map and configuration of deployment area
Input desired RF characteristics
AP placement or select number of APs
Predicted Site Planning
Predicted AP placement
Predicted Heat Maps
Locality of Clients: location relative to associated AP
Troubleshooting RF Statistics for Infrastructure and clients
Intrusion Detection Statistics
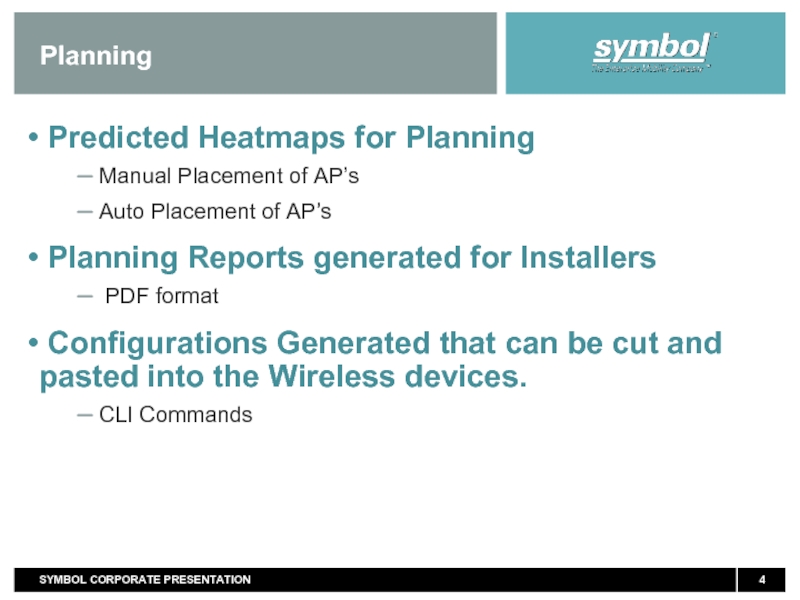
Слайд 4Planning
Predicted Heatmaps for Planning
Manual Placement of AP’s
Auto Placement of AP’s
PDF format
Configurations Generated that can be cut and pasted into the Wireless devices.
CLI Commands
Слайд 5Planning
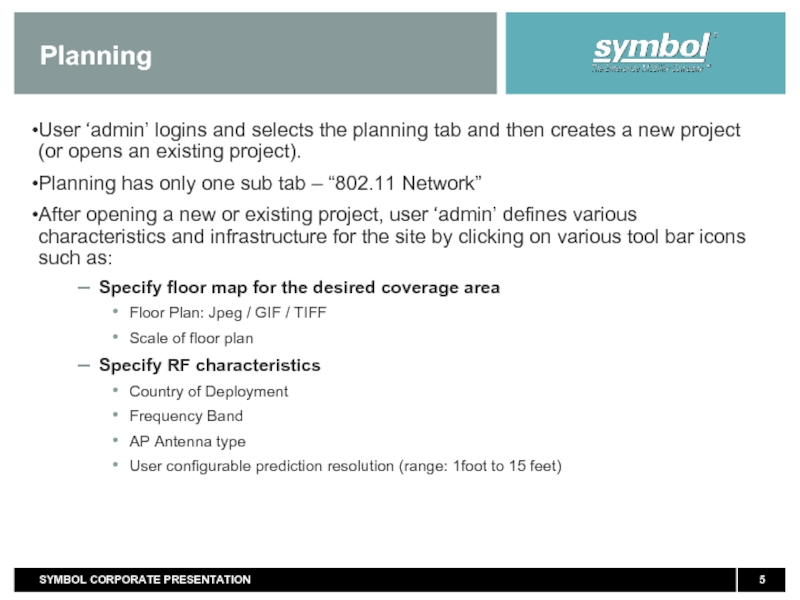
User ‘admin’ logins and selects the planning tab and then creates
Planning has only one sub tab – “802.11 Network”
After opening a new or existing project, user ‘admin’ defines various characteristics and infrastructure for the site by clicking on various tool bar icons such as:
Specify floor map for the desired coverage area
Floor Plan: Jpeg / GIF / TIFF
Scale of floor plan
Specify RF characteristics
Country of Deployment
Frequency Band
AP Antenna type
User configurable prediction resolution (range: 1foot to 15 feet)
Слайд 6Planning
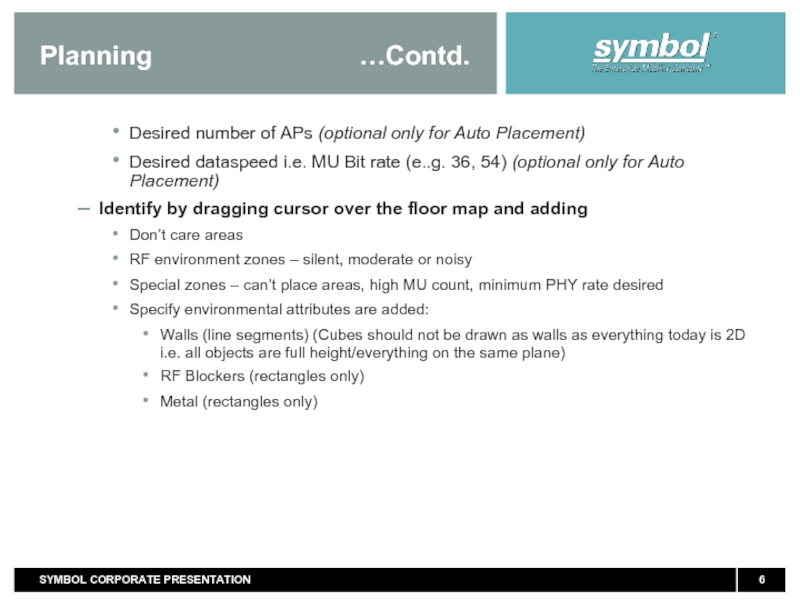
Desired number of APs (optional only for Auto Placement)
Desired dataspeed i.e. MU Bit rate (e..g. 36, 54) (optional only for Auto Placement)
Identify by dragging cursor over the floor map and adding
Don’t care areas
RF environment zones – silent, moderate or noisy
Special zones – can’t place areas, high MU count, minimum PHY rate desired
Specify environmental attributes are added:
Walls (line segments) (Cubes should not be drawn as walls as everything today is 2D i.e. all objects are full height/everything on the same plane)
RF Blockers (rectangles only)
Metal (rectangles only)
Слайд 7Planning
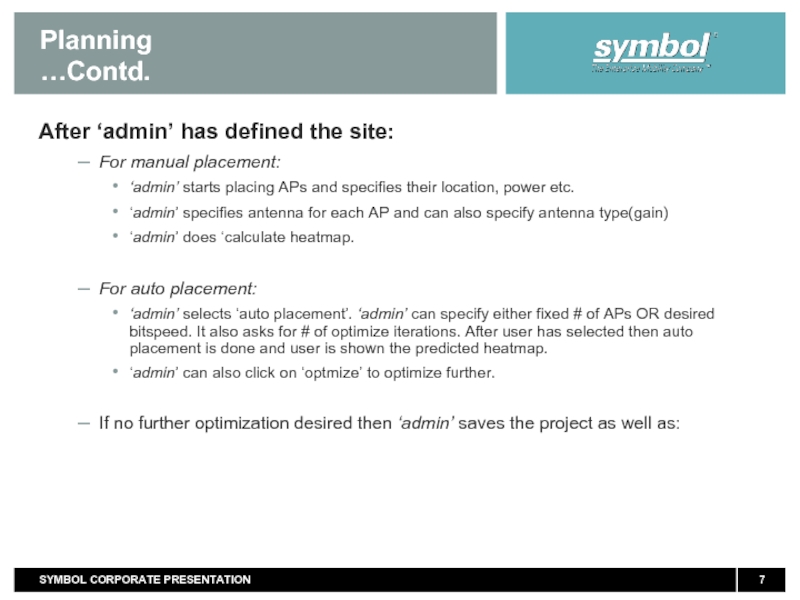
After ‘admin’ has defined the site:
For manual placement:
‘admin’ starts placing APs and specifies their location, power etc.
‘admin’ specifies antenna for each AP and can also specify antenna type(gain)
‘admin’ does ‘calculate heatmap.
For auto placement:
‘admin’ selects ‘auto placement’. ‘admin’ can specify either fixed # of APs OR desired bitspeed. It also asks for # of optimize iterations. After user has selected then auto placement is done and user is shown the predicted heatmap.
‘admin’ can also click on ‘optmize’ to optimize further.
If no further optimization desired then ‘admin’ saves the project as well as:
Слайд 8Planning
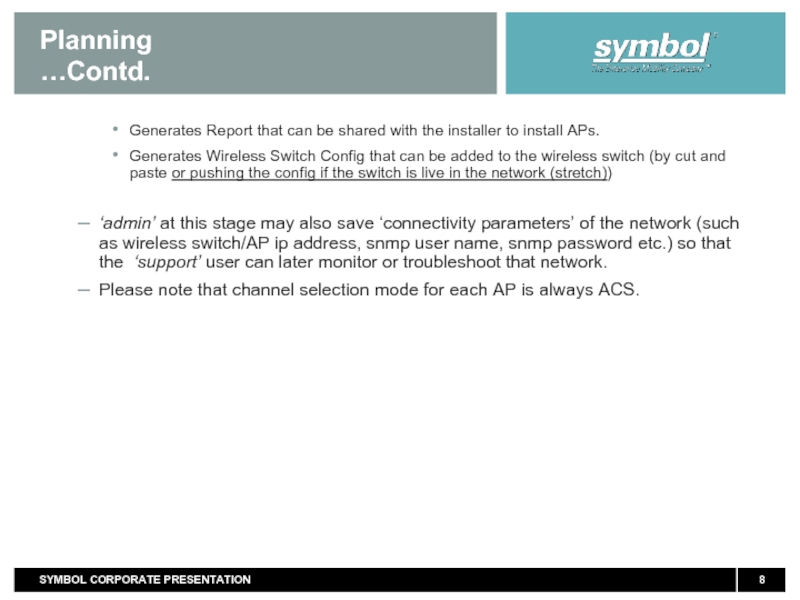
Generates Report that can be shared with the installer to install APs.
Generates Wireless Switch Config that can be added to the wireless switch (by cut and paste or pushing the config if the switch is live in the network (stretch))
‘admin’ at this stage may also save ‘connectivity parameters’ of the network (such as wireless switch/AP ip address, snmp user name, snmp password etc.) so that the ‘support’ user can later monitor or troubleshoot that network.
Please note that channel selection mode for each AP is always ACS.
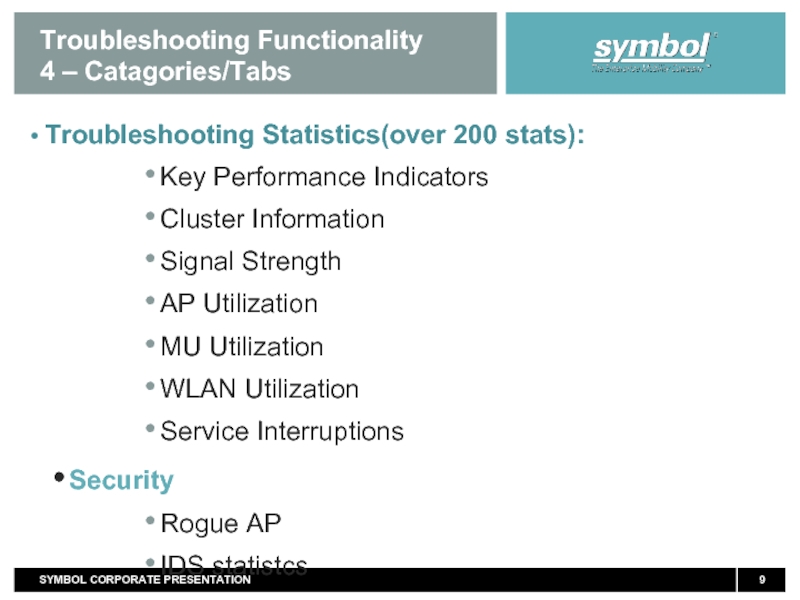
Слайд 9Troubleshooting Functionality
4 – Catagories/Tabs
Troubleshooting Statistics(over 200 stats):
Key Performance Indicators
Cluster
Signal Strength
AP Utilization
MU Utilization
WLAN Utilization
Service Interruptions
Security
Rogue AP
IDS statistcs
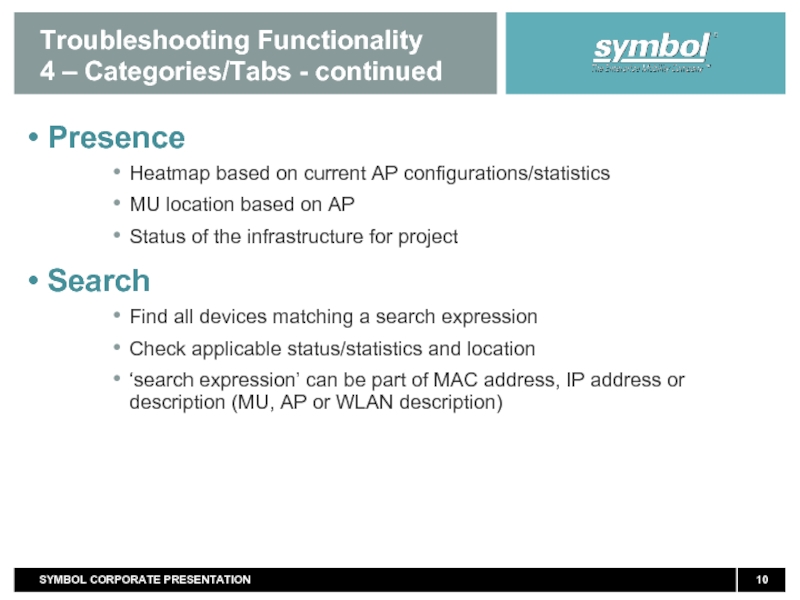
Слайд 10Troubleshooting Functionality
4 – Categories/Tabs - continued
Presence
Heatmap based on current AP
MU location based on AP
Status of the infrastructure for project
Search
Find all devices matching a search expression
Check applicable status/statistics and location
‘search expression’ can be part of MAC address, IP address or description (MU, AP or WLAN description)
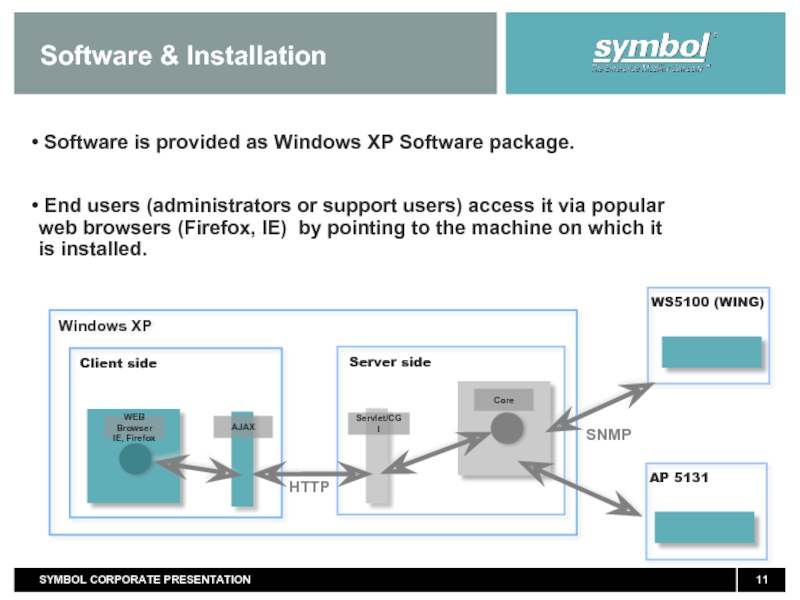
Слайд 11 Software is provided as Windows XP Software package.
End
Software & Installation
SNMP
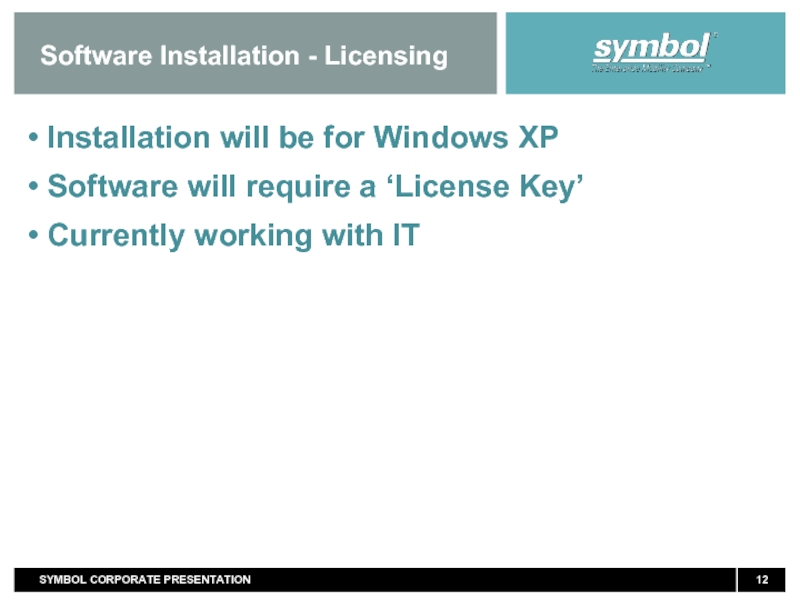
Слайд 12Software Installation - Licensing
Installation will be for Windows XP
Software
Currently working with IT
Слайд 16KPI – Key Performance Indicators
RF Coverage
Indicates PHY Rate as available in
Load Balancing
Indicates if AP or MU load balancing is happening or load is SKEWED
Redundancy Quotient
Indicates if there are enough standby switches or APs in healing neighborhood to cover in event of FAILURE or higher retries
Security Threat Level
Indicates degree of Intrusion and Rogue Activity
Network Utilization
Indicates network bandwidth usage
Слайд 17Common RF Manager Tasks
Planning
Preparing for troubleshooting
Proactive Troubleshooting: How is my network
Reactive Troubleshooting: When a user calls that (s)he is having problems with the Wi-Fi network – its slow !
Reactive Troubleshooting: When a user calls that (s)he is having problems with a specific AP!
Reactive Troubleshooting: What is security threat level of my RF Site?
Reactive Troubleshooting: Poor Coverage
Слайд 18Reactive Troubleshooting- Various Scenarios
One of the following problem is reported by
Unable to associate
Slow Association
Does not get IP address after association
Getting dropped frequently (observing association and disassociation frequently )
Connecting at low rates i.e. slow network
Facing too much roaming
Слайд 19RF Manager v2.0 Planned Features
Real-time Heat maps
MU and AP height definition
AP-AP
Location based on Triangulation
Define multiple floors
WIPS Sensor Coverage
WS 2000 Support
