- Главная
- Разное
- Дизайн
- Бизнес и предпринимательство
- Аналитика
- Образование
- Развлечения
- Красота и здоровье
- Финансы
- Государство
- Путешествия
- Спорт
- Недвижимость
- Армия
- Графика
- Культурология
- Еда и кулинария
- Лингвистика
- Английский язык
- Астрономия
- Алгебра
- Биология
- География
- Детские презентации
- Информатика
- История
- Литература
- Маркетинг
- Математика
- Медицина
- Менеджмент
- Музыка
- МХК
- Немецкий язык
- ОБЖ
- Обществознание
- Окружающий мир
- Педагогика
- Русский язык
- Технология
- Физика
- Философия
- Химия
- Шаблоны, картинки для презентаций
- Экология
- Экономика
- Юриспруденция
Network monitoring & forensics презентация
Содержание
- 1. Network monitoring & forensics
- 2. Network Forensics Usefulness Intro to forensic data
- 3. Introduction Network forensics is the capture, recording,
- 4. Benefits Why do you care If this
- 5. Disclaimer The information and views presented
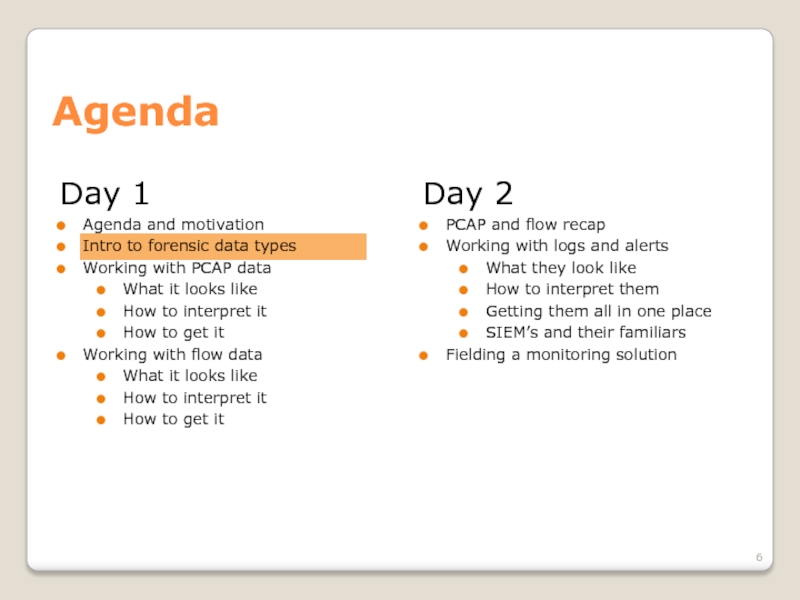
- 6. Day 1 Agenda and motivation Intro
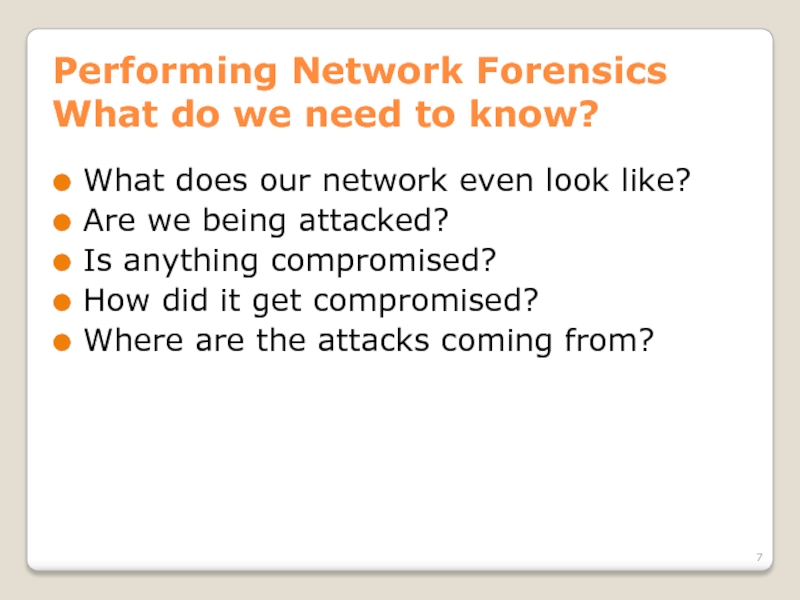
- 7. Performing Network Forensics What do we need
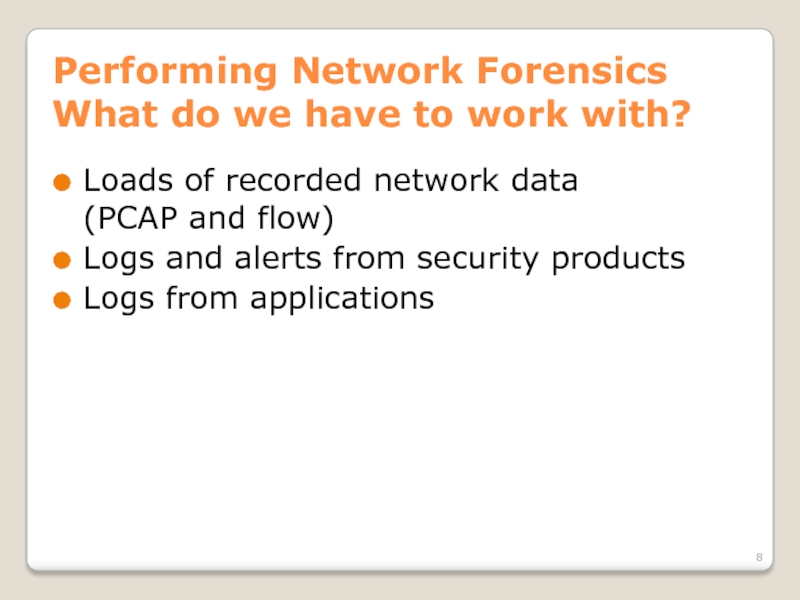
- 8. Performing Network Forensics What do we have
- 9. Main types of forensic data We’ll be
- 10. Forensic Data Type #1 Full Packet Capture
- 11. Forensic Data Type #2 Flow Data Records
- 12. Forensic Data Type #3 Log/Alert data Any
- 13. Forensic Bonus Data People This is when
- 14. Forensic Data Type Comparison How do they differ?
- 15. So what do we capture and when?
- 16. So what do we capture and when?
- 17. So what do we capture and when?
- 18. So what do we capture and when?
- 19. So what do we capture and when?
- 20. How you’ll typically start an investigation
- 21. How you’ll typically start an investigation
- 22. How we’re going to learn this
- 23. Day 1 Agenda and motivation Intro
- 24. PCAP data Things to think about PCAP
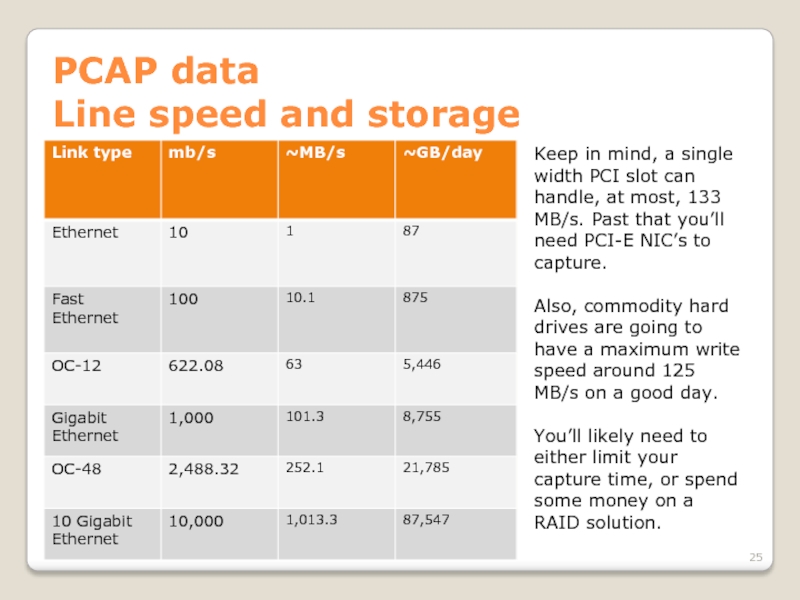
- 25. PCAP data Line speed and storage Keep
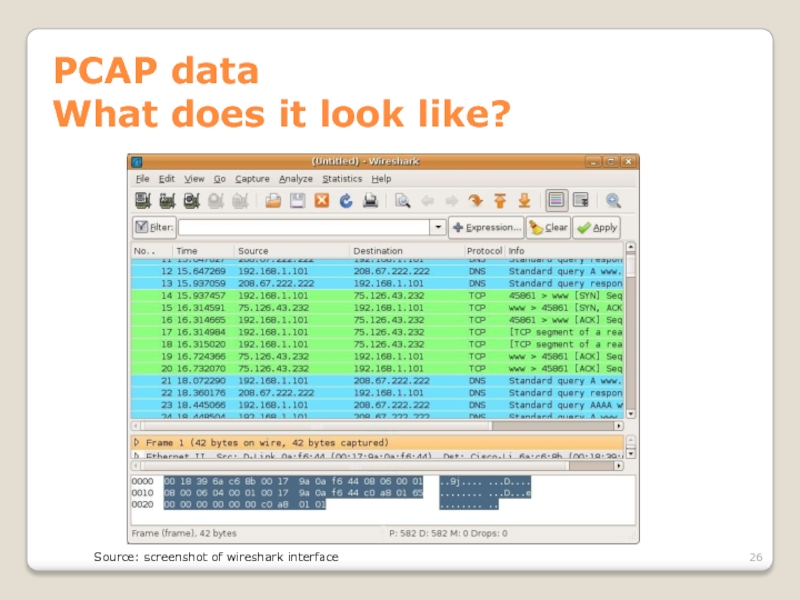
- 26. PCAP data What does it look like? Source: screenshot of wireshark interface
- 27. PCAP data How we get it Network
- 28. PCAP data How we get it Network
- 29. PCAP data How we get it Network
- 30. PCAP data How we get it Network taps Source: netoptics.com, hackaday.com
- 31. PCAP data How we get it Making
- 32. PCAP data How we get it SPAN
- 33. PCAP data How we get it SPAN ports Source: datacomsystems.com
- 34. PCAP data How we get it Direct
- 35. PCAP data How we get it Direct
- 36. Network coverage – an aside Network coverage
- 37. Network coverage – an aside Since different
- 38. Network coverage – an aside Things to
- 39. Network coverage – an aside On the
- 40. Network coverage – an aside In addition
- 41. PCAP data Hands on Now that
- 42. PCAP data Doing analysis - Wireshark
- 43. PCAP data Doing analysis - Wireshark What
- 44. PCAP data Doing analysis - Wireshark Sources
- 45. PCAP data Doing analysis - Wireshark So
- 46. PCAP data Doing analysis - Wireshark But
- 47. PCAP data Doing analysis - Netwitness What
- 48. PCAP data Doing analysis - Netwitness Netwitness
- 49. PCAP data Doing analysis – Other tools
- 50. PCAP data Generating flow and alert data
- 51. PCAP Data Conclusion When you have PCAP
- 52. Day 1 Agenda and motivation Intro
- 53. Flow data Things to keep in mind
- 54. Flow data What is flow data? There’s
- 55. Flow data Netflow v5 protocol Source: caida.org/tools/utilities/flowscan/arch.xml
- 56. Flow data Command line output
- 57. Flow data Directionality Some types of flow
- 58. Flow data Directionality Depending on what you
- 59. Flow data Cutoff and Aging Until conversations
- 60. Flow data Sampling When there’s too much
- 61. Flow data Formats And then there are
- 62. Flow data Formats There isn’t a current
- 63. Flow data Capturing Switches and routers Flow
- 64. Flow data Capturing Machines on the network
- 65. Flow data Analyzing with argus Argus is
- 66. Flow data Capturing with SiLK YAF –
- 67. Flow data Capturing – consolidating in SiLK
- 68. Flow data Analyzing with SiLK SiLK tools
- 69. Flow data SiLK tools - conclusion Free,
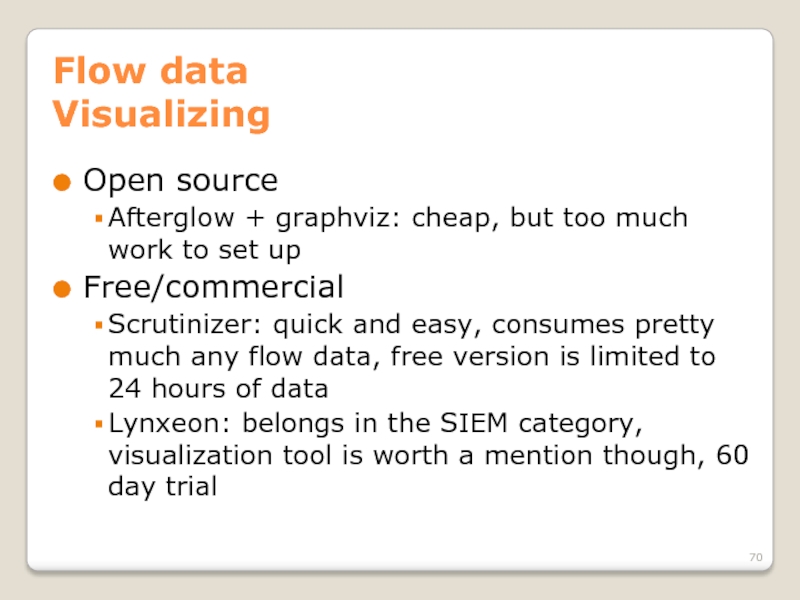
- 70. Flow data Visualizing Open source Afterglow +
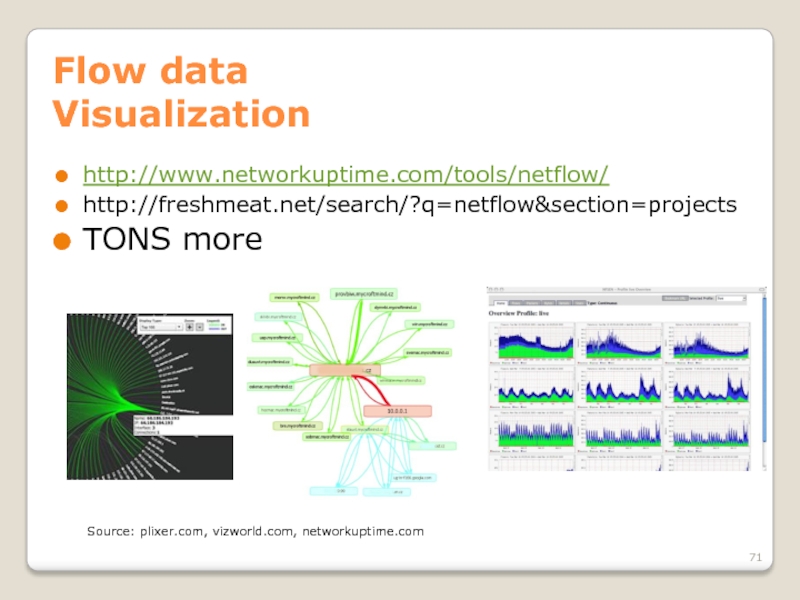
- 71. Flow data Visualization http://www.networkuptime.com/tools/netflow/ http://freshmeat.net/search/?q=netflow§ion=projects TONS more Source: plixer.com, vizworld.com, networkuptime.com
- 72. Flow data Continuing research Flowcon, Centaur Jam,
- 73. Day 1 Agenda and motivation Intro
- 74. PCAP reCAP Most granular data we can
- 75. FLOW reFLOW Info about conversations on the
- 76. Learning styles to use More tool use?
- 77. Questions about anything up to now?
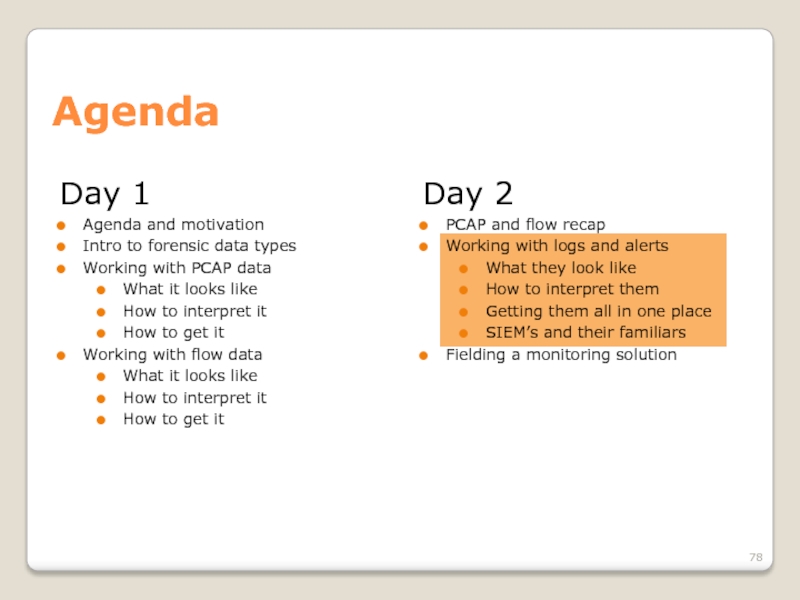
- 78. Day 1 Agenda and motivation Intro
- 79. Log/Alert data What are we dealing with?
- 80. Log data Typical sources Web server
- 81. Alert data Typical sources IDS Firewall
- 82. Alert data Redundant IDS, etc? Extra configuration
- 83. Alert data Let’s go set up some
- 84. Alert data What will we use as
- 85. Alert data How Snort works Reads traffic
- 86. Alert data Writing Snort rules
- 87. Alert data Writing better rules Write to
- 88. Log/Alert data Priority of sources Obviously not
- 89. Log/Alert data What does it look like?
- 90. Alert data Event formats CEE – Common
- 91. Log/Alert data Dealing with disparate data There’s
- 92. Log/Alert data SIM, SEM, SIEM… SIM =
- 93. Log/Alert data SIEMs Perform event correlation, reduce
- 94. Log/Alert data Some common managers/SIEMs Splunk: free
- 95. Log/Alert data Using Splunk Splunk is
- 96. Log/Alert data Some common managers/SIEMs http://www.gartner.com/technology/media-products/reprints/nitrosecurity/article1/article1.html Source: Gartner (May 2010)
- 97. Log/Alert data Arcsight event priority Recalculated by
- 98. Log/Alert data Arcsight event priority Priority =
- 99. Log/Alert data Using SIEMs effectively Understand the
- 100. Deploying a monitoring solution What you need
- 101. Extended topics (if we have time) Privacy/confidentiality
- 102. The End! Please give feedback! Tell your friends!
Слайд 2Network Forensics
Usefulness
Intro to forensic data types
Working with PCAP data
What it looks
How to interpret it
How to get it
Working with flow data
What it looks like
How to interpret it
How to get it
Agenda
Host Forensics
PCAP and flow recap
Working with logs and alerts
What they look like
How to interpret them
Getting them all in one place
SIEM’s and their familiars
Fielding a monitoring solution
Слайд 3Introduction
Network forensics is the capture, recording, and analysis of network events
Course Goal: To give the student a broad understanding of the main types of network forensic data gathering and an introduction to low level concepts necessary for a proper understanding of the task of performing network forensics. After completion, a student should be able to plan and execute a reasonable network monitoring program and use the gathered forensic data to perform a wide range of investigations.
Слайд 4Benefits
Why do you care
If this isn’t in your toolbelt already, you’ll
If you’re already seasoned, you can learn from everyone else here.
Why do I care
The Socratic method works.
Слайд 5Disclaimer
The information and views presented during this course concerning software or
Слайд 6
Day 1
Agenda and motivation
Intro to forensic data types
Working with PCAP data
What
How to interpret it
How to get it
Working with flow data
What it looks like
How to interpret it
How to get it
Agenda
Day 2
PCAP and flow recap
Working with logs and alerts
What they look like
How to interpret them
Getting them all in one place
SIEM’s and their familiars
Fielding a monitoring solution
Слайд 7Performing Network Forensics
What do we need to know?
What does our network
Are we being attacked?
Is anything compromised?
How did it get compromised?
Where are the attacks coming from?
Слайд 8Performing Network Forensics
What do we have to work with?
Loads of recorded
Logs and alerts from security products
Logs from applications
Слайд 9Main types of forensic data
We’ll be grouping forensic data into three
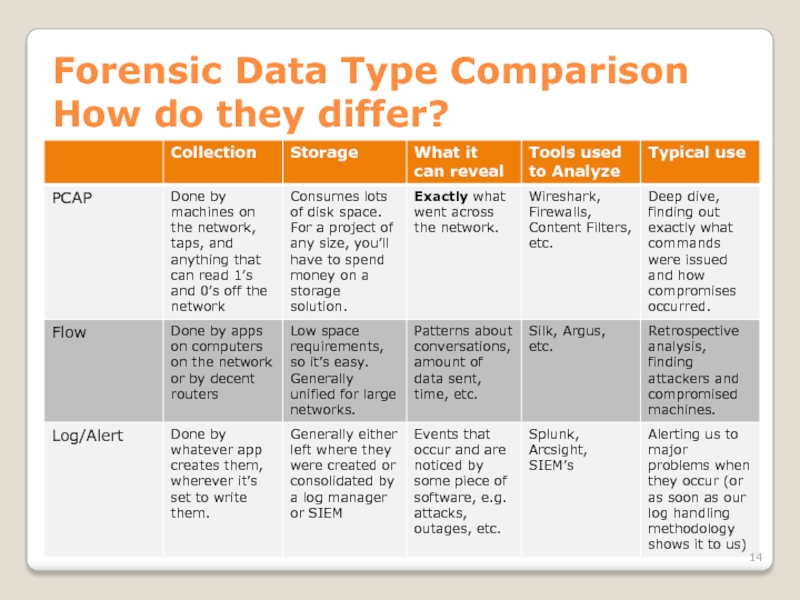
Full packet capture (PCAP)
Flow data (netflow, IPFIX, etc.)
Log / alert data (giant text files)
Слайд 10Forensic Data Type #1
Full Packet Capture (PCAP)
A full copy* of a
The most complete form of monitoring possible
Takes up a lot of space
*it’s possible to do partial captures, too
Слайд 11Forensic Data Type #2
Flow Data
Records of conversations on the network
Stores info
Does not contain any application layer data
Good for understanding how data flows on your network quickly
Слайд 12Forensic Data Type #3
Log/Alert data
Any text that gets written to a
Some of it is very important (firewall alerts, availability alerts, etc.) and some of it is less so
We have to set up things to produce GOOD alerts
There are a lot of log sources, so some sort of management is preferable
Слайд 13Forensic Bonus Data
People
This is when someone comes up to you and
Pretty darned close to real time
Hard to digitize…
Слайд 15So what do we capture and when?
Whatever they’ll let you capture
A
Слайд 16So what do we capture and when?
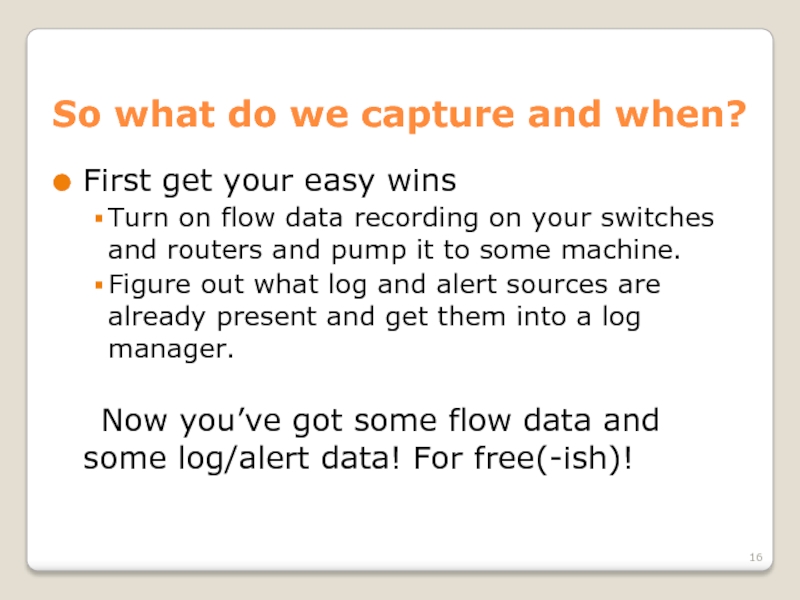
First get your easy wins
Turn
Figure out what log and alert sources are already present and get them into a log manager.
Now you’ve got some flow data and some log/alert data! For free(-ish)!
Слайд 17So what do we capture and when?
Find out what you’re missing
Look
Look at your data and find trouble spots
Find events/hosts of interest by analyzing the flow and log data that you’re getting. (More on how to do this later.)
Слайд 18So what do we capture and when?
Increase monitoring in trouble spots
Grab
Set up IDS/SIEM/etc. products to produce alerts tailored to the problems you see.
Throw host based monitoring apps on suspect machines.
Слайд 19So what do we capture and when?
Breakdown
Log/alert data: Whenever possible, and
Flow data: Whenever possible. It’s easy to capture and easy to work with.
PCAP data: When you need to look closer than flow or log/alert data allows OR when you have tons of resources to blow on disk space.
Слайд 20How you’ll typically start an investigation
SIEM pops up an alert to
You then go look at other logs on host X. Maybe you find something scary. Maybe you can’t see the forest for the trees.
Then you open up your flow data for the time in question. See any patterns? Identify suspicious conversations, capture the packets (if you can) and investigate further. Mount some sort of defense against whatever you find.
OR
Слайд 21How you’ll typically start an investigation
Somebody hands you a big pile
Put it through an app to create flow data or IDS alert data (if you don’t have it already)
Look for patterns using some analysis tool. Focus down to specific data using those patterns or human reports of problems and get as close to the problem as possible.
Figure out what kind of monitoring you need to get the data you truly need to find the problem, catch the bad guy, or get the conviction. Then go deploy it, assuming you can get client buy-in. (or… create ticket, walk away)
Слайд 22How we’re going to learn this
We’ll be exploring the data types
Слайд 23
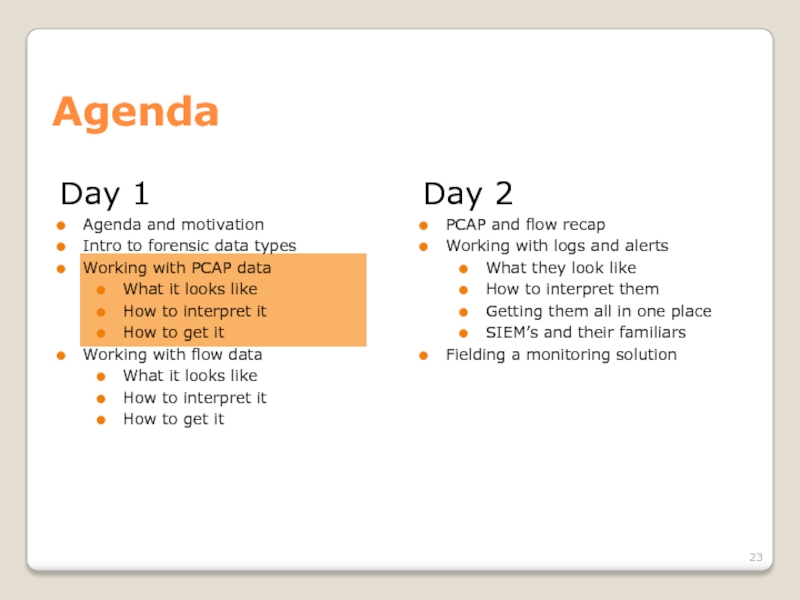
Day 1
Agenda and motivation
Intro to forensic data types
Working with PCAP data
What
How to interpret it
How to get it
Working with flow data
What it looks like
How to interpret it
How to get it
Agenda
Day 2
PCAP and flow recap
Working with logs and alerts
What they look like
How to interpret them
Getting them all in one place
SIEM’s and their familiars
Fielding a monitoring solution
Слайд 24PCAP data
Things to think about
PCAP is a straight copy of ALL*
How long do you need to listen?
Can your NIC capture it fast enough?
Can your hard drive store it fast enough?
How long can you listen before you have to free up space?
Слайд 25PCAP data
Line speed and storage
Keep in mind, a single width PCI
Also, commodity hard drives are going to have a maximum write speed around 125 MB/s on a good day.
You’ll likely need to either limit your capture time, or spend some money on a RAID solution.
Слайд 27PCAP data
How we get it
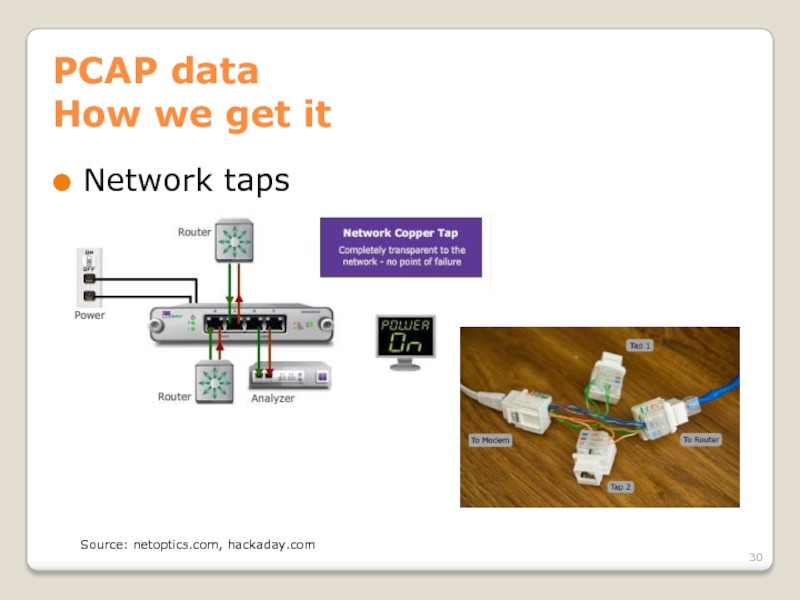
Network taps
Devices that are connected between
Passively monitors traffic, and reproduces it on one or more monitor ports
Available for all media types and speeds
Слайд 28PCAP data
How we get it
Network taps - keywords
Half-duplex: Multiple monitor ports
Regenerating: Incoming data is copied to multiple monitor ports (for multiple receivers)
Aggregating: Receives on multiple ports and combines the data onto a single (full-duplex) monitor port (see problems with oversubscription and timing?)
Fail open/closed: when depowered, open lets traffic through, closed does not
Слайд 29PCAP data
How we get it
Network taps – dealing with fiber
Fiber taps
Слайд 31PCAP data
How we get it
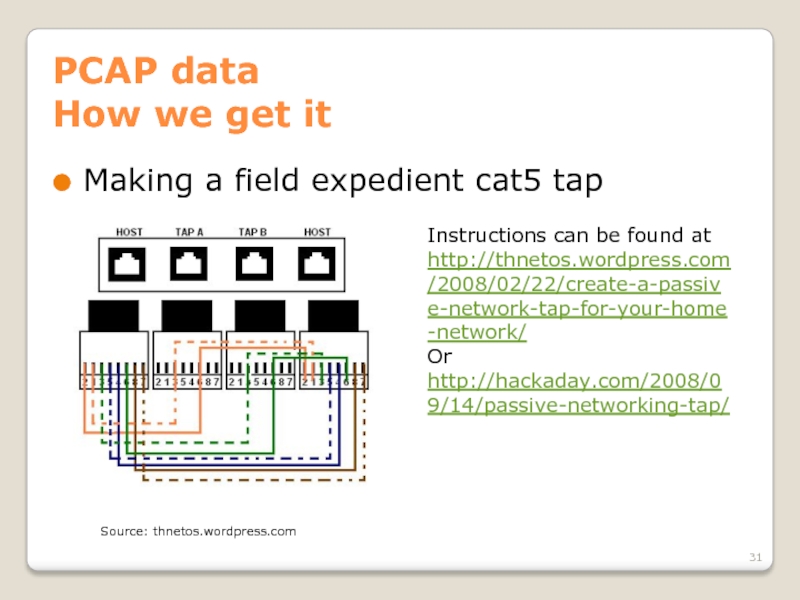
Making a field expedient cat5 tap
Instructions
http://thnetos.wordpress.com/2008/02/22/create-a-passive-network-tap-for-your-home-network/
Or
http://hackaday.com/2008/09/14/passive-networking-tap/
Source: thnetos.wordpress.com
Слайд 32PCAP data
How we get it
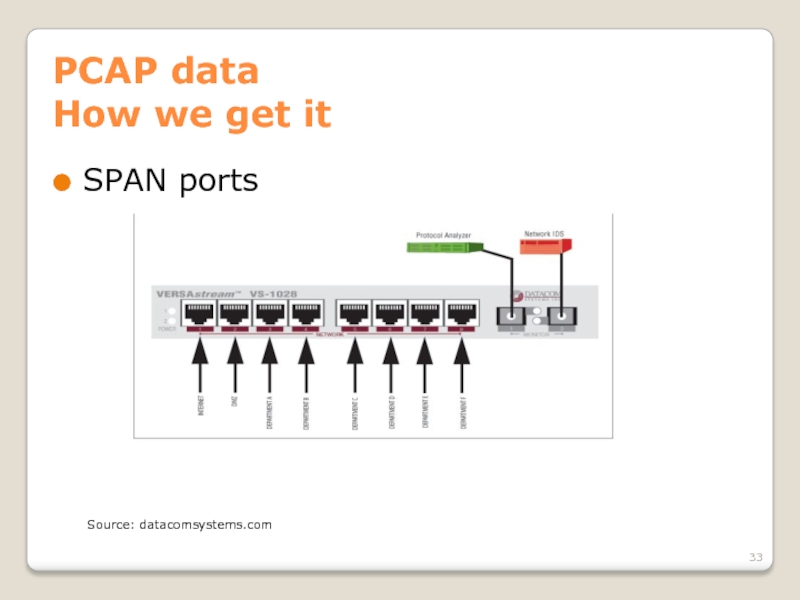
SPAN ports
Ports on most enterprise grade switches/routers
Will drop packets if there’s not enough bandwidth on the port.
You’ll still need a machine connected to it to do the capture.
DON’T FORGET TO DO TX AND RX!
Make your own impromptu SPAN port with the ARP flood trick ☺
Слайд 34PCAP data
How we get it
Direct capture from the NIC on a
You’ll always do this at some point.
Very easy and convenient in low traffic settings. Just start capturing to the hard drive and stop when you feel like it.
Storage becomes an issue when (traffic * time) > hard drive capacity OR (traffic / time) > hard drive write speed
Can only see the traffic going to that host (so use taps or SPAN ports to gain visibility)
Слайд 35PCAP data
How we get it
Direct capture from the NIC on a
tcpdump
wireshark
Netwitness
etc.
Слайд 36Network coverage – an aside
Network coverage is how much of the
Слайд 37Network coverage – an aside
Since different segments of the network carry
What would you see on the outside of the border firewall that you wouldn’t see inside? What kinds of things do you WANT to see?
Слайд 38Network coverage – an aside
Things to think about
NAT – solve with
VPN – solve with placement of sensors or VLAN specific configuration
Multiple border gateways – solve using channel bonding/aggregation
Слайд 39Network coverage – an aside
On the outside of your firewall, you
Слайд 40Network coverage – an aside
In addition to the amount of the
Sometimes you’ll want PCAP data for a couple of hours, but couldn’t handle 24/7. When might that be? Could you perhaps trigger full PCAP for a time based on some event? Absolutely!
Слайд 41PCAP data
Hands on
Now that we know where, why, and how to
Слайд 42PCAP data
Doing analysis - Wireshark
Wireshark is your good old fashioned, run
Слайд 43PCAP data
Doing analysis - Wireshark
What we’ll be doing today
Learning the layout
Capturing PCAP data
Looking at the structure of packets
Filtering packets to find interesting things
Following a TCP session
Carving files
Reading emails
Слайд 44PCAP data
Doing analysis - Wireshark
Sources for pcaps
http://wiki.wireshark.org/SampleCaptures
http://packetlife.net/captures/
http://www.pcapr.net
http://www.icir.org/enterprise-tracing/download.html
Your own machine
Слайд 45PCAP data
Doing analysis - Wireshark
So that’s Wireshark. Pretty nice, huh? When
Also, the functionality of Wireshark can be extended by coding up plugins and decoders, and anything else you want. It’s open source!
Слайд 46PCAP data
Doing analysis - Wireshark
But what if we don’t have time
I thought you’d never ask…
Слайд 47PCAP data
Doing analysis - Netwitness
What we’ll be doing today
Learning the interface
Importing
Doing (almost) everything we just did in Wireshark in less time than it took us before
Catching things that we might have missed before
Слайд 48PCAP data
Doing analysis - Netwitness
Netwitness is a tool for getting a
Currently there’s a freeware version and a paid version. Give it a try next time you get stuck during an investigation. Often you can catch certain clues via the session based view that you wouldn’t simply by digging through PCAPs.
Слайд 49PCAP data
Doing analysis – Other tools
In addition to sitting down and
Depending on the audience, this is where we discuss our organization’s custom tools ☺
Слайд 50PCAP data
Generating flow and alert data
Useful when someone hands you
Can be done when you’ve got data from before you fielded your flow monitoring or alert generating apps (IDS, firewall, etc.)
Makes analysis of large data sets easier since it’s faster to look at coarse grained data.
We’ll cover this when appropriate.
Слайд 51PCAP Data
Conclusion
When you have PCAP you can see pretty much everything.
It’s
It’s the only way you’ll see what’s being said on the network, but it’s not as good as flow or log/alert data for figuring out what’s important to look at.
Слайд 52
Day 1
Agenda and motivation
Intro to forensic data types
Working with PCAP data
What
How to interpret it
How to get it
Working with flow data
What it looks like
How to interpret it
How to get it
Agenda
Day 2
PCAP and flow recap
Working with logs and alerts
What they look like
How to interpret them
Getting them all in one place
SIEM’s and their familiars
Fielding a monitoring solution
Слайд 53Flow data
Things to keep in mind
This is easy data to get,
Better used to figure out where to look, than to figure out exactly what happened.
Even when you’re not on an investigation, you should collect flow data to do baselining.
Visualization helps a lot.
Слайд 54Flow data
What is flow data?
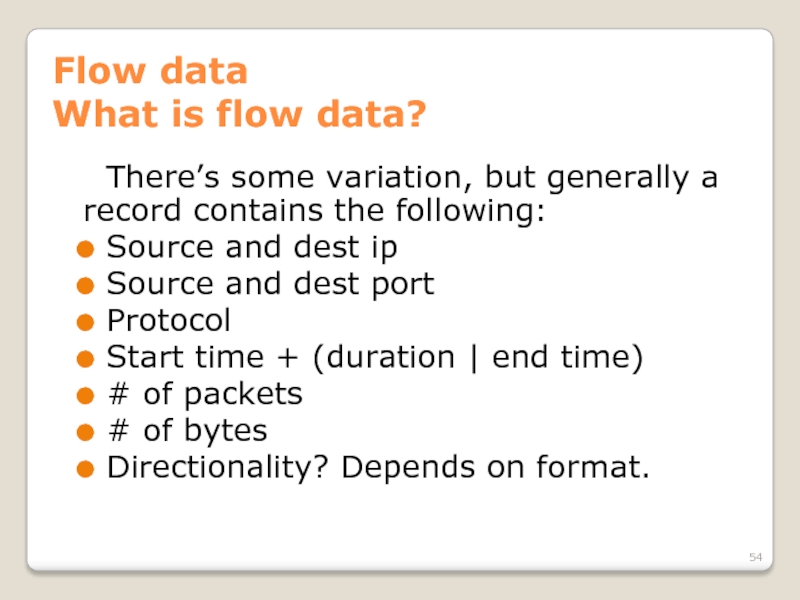
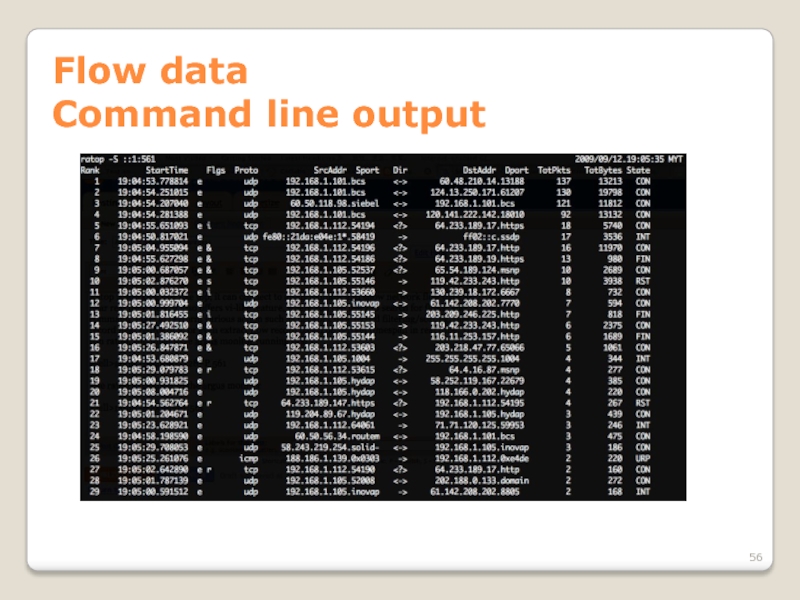
There’s some variation, but generally a record
Source and dest ip
Source and dest port
Protocol
Start time + (duration | end time)
# of packets
# of bytes
Directionality? Depends on format.
Слайд 57Flow data
Directionality
Some types of flow records are unidirectional (SiLK, rw tools),
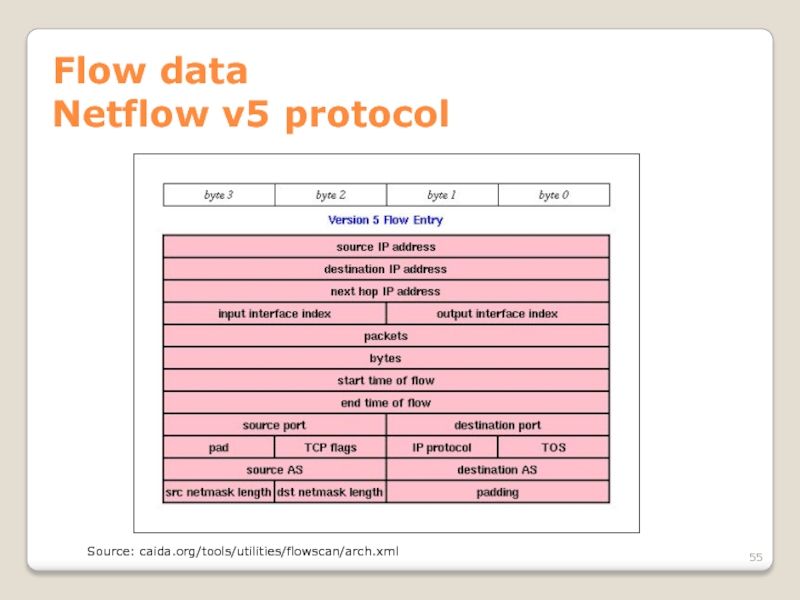
Unidirectional flow data has a separate record for both sides of the conversation. This is how Cisco NetFlow v5, v9, and IPFIX records are specified.
Bidirectional flow data combines both sides into one record, usually having extra fields for “# of sender packets”, “# of destination bytes”, and other things that would get muddled by combining two unidirectional flows.
Слайд 58Flow data
Directionality
Depending on what you need, you can convert between bidirectional
Слайд 59Flow data
Cutoff and Aging
Until conversations end, their flow data sits in
For long flows, we have a configurable time (say 30 minutes) after which we write a record and start a new one. Figuring out how long the flow actually was will require massaging your data.
For broken flows, another cutoff time (maybe 15 seconds?) will clear them out.
Слайд 60Flow data
Sampling
When there’s too much traffic for your switch, NIC, or
Instead of every packet being recorded in a flow (sample rate = 1 out of 1), we take 1 out of N packets, make flow records, and then scale the appropriate values by N.
We will miss flows due to this ☹ but for very large throughputs it’s necessary. Also, N is not always constant over time.
Слайд 61Flow data
Formats
And then there are different formats…
Cisco NetFlow v5 and v9
IPFIX is a lot like v9 plus some interesting fields. Open protocol put out by IETF.
sFlow hardware accelerated, forced sampling, mainly an HP thing.
And there are others, but we’ll focus on v5/v9 and IPFIX.
Слайд 62Flow data
Formats
There isn’t a current standard for how to store flow
Слайд 63Flow data
Capturing
Switches and routers
Flow data is gathered by the network hardware,
To set up collection and forwarding, look up instructions particular to your device and the revision of its OS (typically Cisco IOS).
Remember, this is going over the network, so it can be intercepted, falsified, or blocked by attackers, outages, and misconfigurations!
Слайд 64Flow data
Capturing
Machines on the network
Creates flow data based on what network
Can either generate flow data and forward it to another collector, store it locally, or both.
Also possible to collect flow data from other machines or network hardware.
Eventually your flow data will have to end up somewhere. You want that somewhere to be handy to your analysts.
Слайд 65Flow data
Analyzing with argus
Argus is another popular tool which is much
Become familiar with a few of the tools
Locate a scanning machine
Detect beaconing
Find activities by a compromised machine
Find routing misconfigurations
Слайд 66Flow data
Capturing with SiLK
YAF – yet another flowmeter
Produces IPFIX data from
Can write to disk or push out over network
Lightweight, easy to install
Works well with SiLK tools
Слайд 67Flow data
Capturing – consolidating in SiLK
rwflowpack
Part of the SiLK toolset
Designed to
Just one of the pieces of a full sensor network.
Слайд 68Flow data
Analyzing with SiLK
SiLK tools
Produced by CERT NetSA
Relatively easy to use
We’ve
Слайд 69Flow data
SiLK tools - conclusion
Free, very powerful, extensible, pretty easy to
Command line tools are great for things that we have running as daemons, but for visualizing flow data we can find a better interface. With the right tools, we can add better visualization.
Слайд 70Flow data
Visualizing
Open source
Afterglow + graphviz: cheap, but too much work to
Free/commercial
Scrutinizer: quick and easy, consumes pretty much any flow data, free version is limited to 24 hours of data
Lynxeon: belongs in the SIEM category, visualization tool is worth a mention though, 60 day trial
Слайд 71Flow data
Visualization
http://www.networkuptime.com/tools/netflow/
http://freshmeat.net/search/?q=netflow§ion=projects
TONS more
Source: plixer.com, vizworld.com, networkuptime.com
Слайд 72Flow data
Continuing research
Flowcon, Centaur Jam, etc.
Come join us!
Share your tools!
Statistical anomaly/group
Complicated math
New-ish technology, but worth a look if you’ve got a pile of netflow data that you’re sitting on.
Слайд 73
Day 1
Agenda and motivation
Intro to forensic data types
Working with PCAP data
What
How to interpret it
How to get it
Working with flow data
What it looks like
How to interpret it
How to get it
Agenda
Day 2
PCAP and flow recap
Working with logs and alerts
What they look like
How to interpret them
Getting them all in one place
SIEM’s and their familiars
Fielding a monitoring solution
Слайд 74PCAP reCAP
Most granular data we can collect
Takes a lot of resources
Great for finding out how machines got pwned
Bad for figuring out what’s going on quickly
Can be converted into flow and alert data with the right tools
Слайд 75FLOW reFLOW
Info about conversations on the network
Cheap and easy to collect
Quick
Different analysis suites, formats
Слайд 76Learning styles to use
More tool use?
More theory?
More collaboration!
You’ve got threats. I’ve
Слайд 78
Day 1
Agenda and motivation
Intro to forensic data types
Working with PCAP data
What
How to interpret it
How to get it
Working with flow data
What it looks like
How to interpret it
How to get it
Agenda
Day 2
PCAP and flow recap
Working with logs and alerts
What they look like
How to interpret them
Getting them all in one place
SIEM’s and their familiars
Fielding a monitoring solution
Слайд 79Log/Alert data
What are we dealing with?
Logs are any continual text output
Alerts are specialized logs produced by something when certain conditions occur that we had the foresight to set an alarm for. If a log is created saying that something we’ve set up a trigger for has happened, then we’ll get an alert.
Слайд 80Log data
Typical sources
Web server
Web proxy
DNS
Operating system (/var/log/*)
SMTP
Whatever you’re using to
Building access controls
HVAC/ICS/SCADA/Power
Слайд 81Alert data
Typical sources
IDS
Firewall
Host based IDS
SIEM (Security Information & Event Manager)
Your
What else?
Typically alerts are being produced because triggers that we’ve written are being tripped. If you’re not getting useful alerts, then you’ve configured something wrong!
Слайд 82Alert data
Redundant IDS, etc?
Extra configuration
Add personnel
When one dies- “Multiple TippingPoint IPS
Increased attack surface
More filtration, more rules, etc.
Слайд 83Alert data
Let’s go set up some triggers
Here’s how you go about
Find an incident that you want to be alerted about
Research what went over the network or got written to a log when that incident was occurring
Write a rule in your IDS or whatever to create an alert when that traffic is seen
Test your rule
Continue testing…
Слайд 84Alert data
What will we use as a trigger?
Snort!
Open source, support packages
Basis for Sourcefire appliances
Very popular, good support among SIMs
Very robust community providing rules, extensions, add ons, and anything else you can think of
Rule set subscriptions can be had from Sourcefire, and rules become free 30 days after they’re made available to subscribers
Слайд 85Alert data
How Snort works
Reads traffic from network
Decodes packets
Performs stream reassembly
Applies filters
Upon
Слайд 86Alert data
Writing Snort rules
Fire up your VM’s. Time to go to
We’re going to look at how snort rules are written, what alerts look like, and how to write our own rules.
Слайд 87Alert data
Writing better rules
Write to the vulnerability, not the exploit
Understand the
Inspection chain
Test and tune your alerts
Dumbpig, external checking tools, profiling
Слайд 88Log/Alert data
Priority of sources
Obviously not all data is equal, so here’s
Alerts from security products (e.g. IDS, SIEM)
Netflow data, so you can track what those alerts are related to
OS event logs, so you can see what happened when those alerts were caused
What else?
Слайд 89Log/Alert data
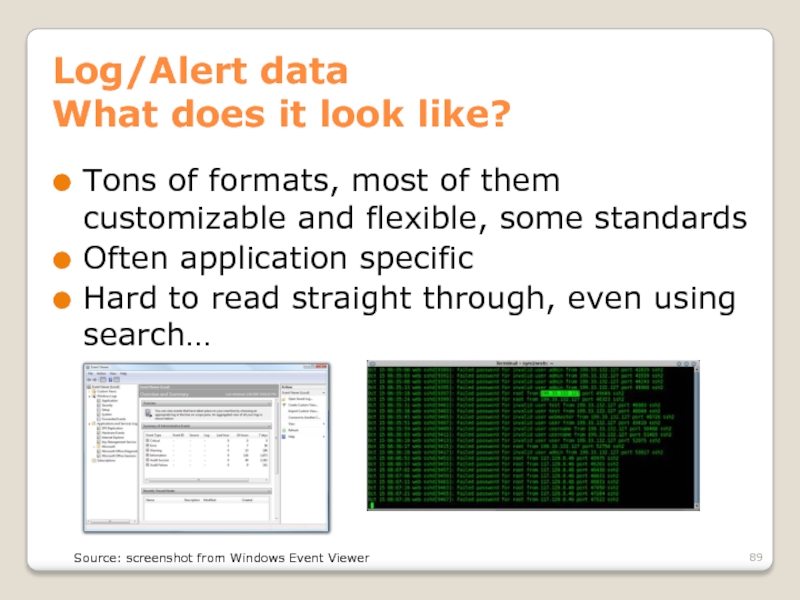
What does it look like?
Tons of formats, most of them
Often application specific
Hard to read straight through, even using search…
Source: screenshot from Windows Event Viewer
Слайд 90Alert data
Event formats
CEE – Common Event Expression
CVE – Vulnerability
CCE – Configuration
CWE
CPE – Platform
CAPEC – Attack Patterns
…
Слайд 91Log/Alert data
Dealing with disparate data
There’s too much text and not enough
That’s why we use log managers and SIEM’s. They import the logs into one place, give us some pretty graphs, and (hopefully) make sure that the important entries catch our attention quickly.
Слайд 92Log/Alert data
SIM, SEM, SIEM…
SIM = Security Information Management
SEM = Security Event
SIEM = Security Information and Event Management
SIM is for bookkeeping, SEM is for correlating data into events, and SIEM is a combo of the two.
Слайд 93Log/Alert data
SIEMs
Perform event correlation, reduce false positives
Help filter logs and alerts
Typically have a method for reading lots of log types
This is what you have running on a dedicated monitor in your lab for a technician to keep an eye on and call you when it turns red
Слайд 94Log/Alert data
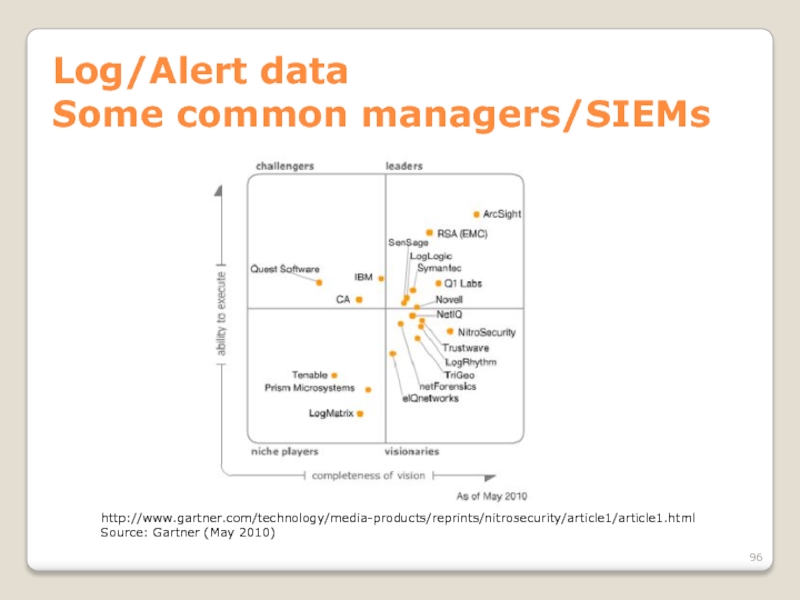
Some common managers/SIEMs
Splunk: free version will read 500MB/day of logs,
ArcSight: popular SIEM suite, has its own log manager, could have a class just on Arcsight alone (and there are). BIG player in government and commercial sector, owing greatly to pushbutton compliance auditing.
RSA enVision: another big player, focused on appliances
Disclaimer: the information expressed here is meant only to be informative and does not imply a recommendation
Слайд 95Log/Alert data
Using Splunk
Splunk is common enough that it’s worth your time
Слайд 96Log/Alert data
Some common managers/SIEMs
http://www.gartner.com/technology/media-products/reprints/nitrosecurity/article1/article1.html
Source: Gartner (May 2010)
Слайд 97Log/Alert data
Arcsight event priority
Recalculated by ESM
Factors in:
Normalized Severity S [0—10]
Model of
Security History H [1—1.3]
Asset Criticality C [0.8—1.3]
Priority = S * MCR * H * C
Слайд 98Log/Alert data
Arcsight event priority
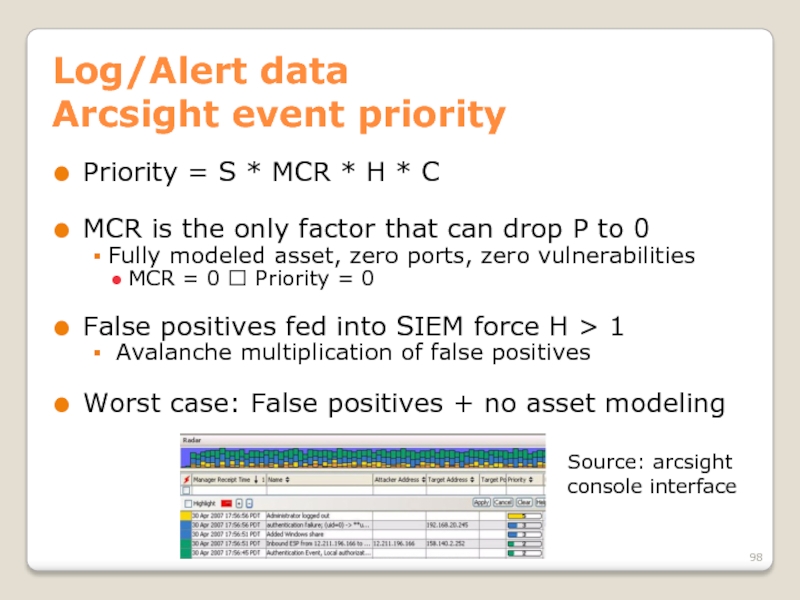
Priority = S * MCR * H *
MCR is the only factor that can drop P to 0
Fully modeled asset, zero ports, zero vulnerabilities
MCR = 0 ? Priority = 0
False positives fed into SIEM force H > 1
Avalanche multiplication of false positives
Worst case: False positives + no asset modeling
Source: arcsight console interface
Слайд 99Log/Alert data
Using SIEMs effectively
Understand the complexity of the tools you are
Standardize what information your organization collects. Prioritize which information you set up collection for.
Regularly look at your flow data. Don’t depend on the SIEM to see everything.
Write new alert rules to handle your own particular threats.
Слайд 100Deploying a monitoring solution
What you need to monitor a network will
Now go to www.ratemynetworkdiagram.com and let’s play pin the sensor on the network.
Слайд 101Extended topics
(if we have time)
Privacy/confidentiality laws
Attacking network monitoring devices
Evading network monitoring
Wireless
What products have you used and which ones did you like?
What else?



![Log/Alert data Arcsight event priorityRecalculated by ESM Factors in:Normalized Severity S [0—10]Model of Confidence MCR [0—1] &](/img/tmb/5/410509/37b896492472522921a42b26cdbeb240-800x.jpg)
