- Главная
- Разное
- Дизайн
- Бизнес и предпринимательство
- Аналитика
- Образование
- Развлечения
- Красота и здоровье
- Финансы
- Государство
- Путешествия
- Спорт
- Недвижимость
- Армия
- Графика
- Культурология
- Еда и кулинария
- Лингвистика
- Английский язык
- Астрономия
- Алгебра
- Биология
- География
- Детские презентации
- Информатика
- История
- Литература
- Маркетинг
- Математика
- Медицина
- Менеджмент
- Музыка
- МХК
- Немецкий язык
- ОБЖ
- Обществознание
- Окружающий мир
- Педагогика
- Русский язык
- Технология
- Физика
- Философия
- Химия
- Шаблоны, картинки для презентаций
- Экология
- Экономика
- Юриспруденция
Modern Learner Webinar - Most recent v2 презентация
Содержание
- 2. strategies for engaging the modern learner Bull City Learning
- 3. Who are these modern learners? How do I engage them?
- 4. Who is this modern learner of which you speak?
- 5. Workforce Circa 1985
- 6. Workforce Circa 1995
- 7. Workforce Circa 2005
- 8. Workforce Circa 2015
- 9. Workforce Circa 2015
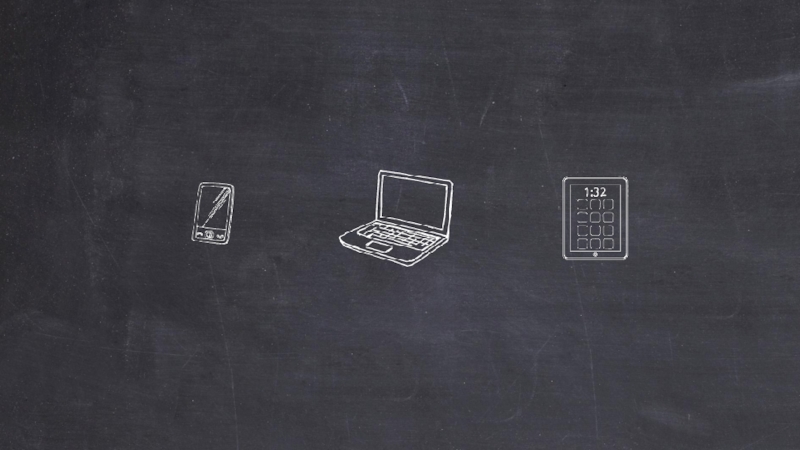
- 10. http://techland.time.com/2013/07/08/a-nation-of-kids-with-gadgets-and-adhd/TIME article asking if devices are to
- 11. The amount of time spent in front
- 12. Workforce Circa 1985
- 13. Number of Twitter users who follow 64
- 14. The point?
- 15. Increase in the past three years in
- 16. According to Google, 90% of people
- 17. OK, but this is really all about
- 18. Uses more systems/devices than ever Rapidly
- 19. Alright, so people are using more media and devices all the time. So what?
- 20. Information consumes “the attention of its recipients.
- 21. 9 SECONDS Attention span of the average
- 22. “The current generation of internet consumers live
- 23. Of pages views last less than four
- 24. 32% of consumers will start abandoning slow
- 25. The length of each individual internet video
- 26. Mobile devices condition their users to
- 27. Is overloaded with information Uses more systems/devices
- 28. What impact is this having on us personally?
- 29. 1. We’re easily distracted “87% of teachers
- 30. 2. We forget things 25% of people
- 31. The frontal lobe is where incoming messages
- 32. Enter the frontal lobe A message enters
- 33. If the brain becomes distracted during this
- 34. “Repeated distractions that trigger rapid shifts in
- 35. 3. We process data faster This surprising
- 36. 4. We’re more visual Another influential study
- 37. 5. We forget things Text formatting, please ☺
- 38. Is overloaded with information Uses more systems/devices
- 39. The new psychology of the modern learner
- 40. “Millennials are visual and kinesthetic learners who
- 41. “Clark Quinn, the e-learning consultant, feels strongly
- 42. This may be the reason attendance and completion rates are low
- 43. Factors Affecting Completion Rates in Asynchronous Online Facilitated
- 44. https://www.insidehighered.com/news/2013/05/10/new-study-low-mooc-completion-rates The average completion rate for massive
- 45. According to a recent report, 70 percent
- 46. So, how do you create training that engages the modern learner?
- 47. In order to keep up and create
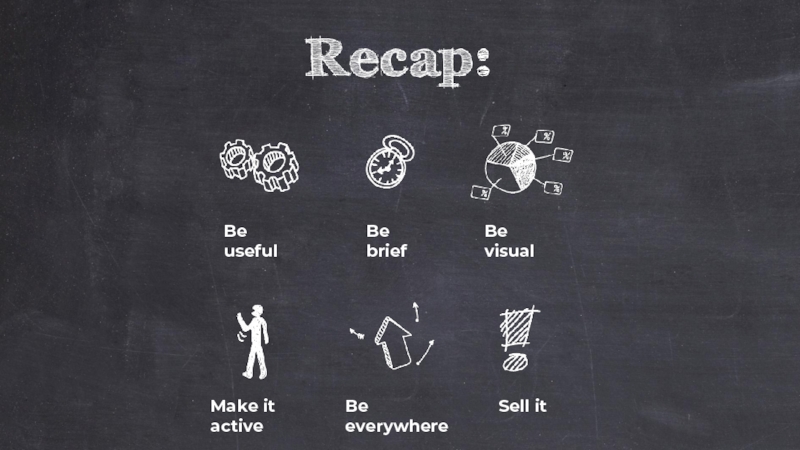
- 48. Be useful Be brief Be visual Make it active Sell it Be everywhere
- 49. Be useful Be brief Be visual Make it active Sell it Be everywhere
- 50. “Modern learners want things that help them
- 51. The grass is really long. It needs
- 52. Ten years of constant A/B testing by
- 53. You want your training to stand out
- 54. Create training around topics useful to the
- 55. A lot of training does not denote
- 56. Organizational goals (what you want to teach)
- 57. How? Think like an online niche
- 58. Keyword research is of no use to
- 59. Finally, you need to give your courses
- 60. Be useful Be brief Be visual Make it active Sell it Be everywhere
- 61. 15 Minutes Upper limit of an training unit – preferably a lot less.
- 62. 2.5 Minutes Maximum time you should
- 63. Be useful Be brief Be visual Make it active Sell it Be everywhere
- 64. People learn less from this …. … than they do this.
- 65. “Showing people meaningful, content-based visuals, as opposed
- 66. Internet content views can jump up 48%
- 67. Cone of Learning (Edgar Dale) Text formatting, please ☺
- 68. Be useful Be brief Be visual Make it active Sell it Be everywhere
- 69. Text formatting, please ☺
- 70. Teach new things within context Gamify
- 71. Be useful Be brief Be visual Make it active Sell it Be everywhere
- 73. Be useful Be brief Be visual Make it active Sell it Be everywhere
- 74. Particularly with big learning initiatives that are
- 75. Workforce Circa 2015
- 77. We’re Bull City Learning blah, blah, blah
- 78. Visit us here, here, and here
- 79. Email Garry O’Grady if you want a copy of the slide deck
- 80. PRESENTATION ENDS HERE – REST OF SLIDES
- 81. Use rewards Motivate Optional topics/items
- 82. Here are our tips for doing this
- 83. Summary of the modern learner: More distracted
- 84. The results of the study indicated that
- 85. “One average users only read 28% of
- 86. http://www.npr.org/templates/story/story.php?storyId=127370598 “All Things Considered” interview with the
- 87. http://www.huffingtonpost.com/2013/10/24/attention-span-book_n_4151059.html Explains how the increase of digital
- 88. http://digitalcommons.unl.edu/cgi/viewcontent.cgi?article=1070&context=journalismfacpub Journal Article: Digital Distractions in the
- 89. The number of students taking online courses


Слайд 10http://techland.time.com/2013/07/08/a-nation-of-kids-with-gadgets-and-adhd/TIME article asking if devices are to blame for the increase
Workforce Circa 2015
Workforce")
Слайд 11The amount of time spent in front of device screens: 7.5hrs/day…
TIME article asking if devices are to blame for the increase in behavioral disorders (ADHD)
http://techland.time.com/2013/07/08/a-nation-of-kids-with-gadgets-and-adhd/


Слайд 13Number of Twitter users who follow 64 or more Twitter accounts
Minutes people spend on Facebook each month
Facebook apps installed everyday, most of which are a distraction


Слайд 15Increase in the past three years in the number of people
Number of times the average person switches devices per hour
Number of times per hour the average office worker checks his email inbox
Evidence

Слайд 16According to Google,
90% of people use multiple screens
to accomplish
Smart phones have the highest number of interactions during the day.

Слайд 17OK, but this is really all about young workers, right? Think
16%
12%
Can you add the text figures on this page?
☺

Слайд 18Uses more systems/devices than ever
Rapidly switches from device to device
Is overloaded
Distributes attention thinly across
many things
Is found in all age brackets:


Слайд 20Information consumes “the attention of its recipients. Hence a wealth of
Nobel-winning economist Herbert Simon

Слайд 219 SECONDS
Attention span of the average gold fish.
12 MINUTES
Attention span of
5 SECONDS
Attention span of the average person in 2013
http://www.statisticbrain.com/attention-span-statistics/

Слайд 22“The current generation of internet consumers live in a world of
2013 NPR article on Mobile devices & short attention span
http://www.theguardian.com/media-network/media-network-blog/2012/mar/19/attention-span-internet-consumer

Слайд 23Of pages views last less than four seconds.
17%
Of words read on
2.7 minutes
Of pages views last less than four seconds (28% on average 583 word web page)
49%
http://www.statisticbrain.com/attention-span-statistics/

Слайд 2432% of consumers will start abandoning slow sites between one and
Bounce rate can be improved by up to 30% with the reduction of page size and resulting speed improvements
A 1-second delay in page load time can result in 11% fewer page views, 16% decreased customer satisfaction and 7% lost conversions.
http://www.theguardian.com/media-network/media-network-blog/2012/mar/19/attention-span-internet-consumer

Слайд 25The length of each individual internet video has reversed its rise

Слайд 26
Mobile devices condition their users to expect content, electronic stimulus
2013 NPR

Слайд 27Is overloaded with information
Uses more systems/devices than ever
Is overloaded with information
Rapidly
Distributes attention thinly across
many things
Is found in all age brackets:


Слайд 291. We’re easily distracted
“87% of teachers felt modern technologies were creating
The Pew Research Centre in America
A common belief among teachers is that although technology has greatly improved students’ research abilities & skills, it has created an easily distracted generation with short attention spans and has done more to distract students than to help them academically.
Journal Article: Digital Distractions in the Classroom: Student Classroom Use of Digital Devices for Non-Class Related Purposes
Millennials will have five careers – not five jobs – in their lives
Today, 1 in 10 children are diagnosed with ADHD. In the last decade, diagnoses of ADHD has increased by over 50%.

Слайд 302. We forget things
25% of people forget names and personal details
7% of people forget their own birthdays from time to time.
Can you format the text here?

Слайд 31The frontal lobe is where incoming messages are processed and working
The Hippocampus (the region of brain deep within the temporal lobe) weaves new and old memories together, signaling a consolidation process, where the brain’s attention is required to pass new information from short-term working memory into long-term memories.

Слайд 32Enter the frontal lobe
A message enters the frontal lobe
It enters the
The message joins with other messages already in the hippocampus.

Слайд 33If the brain becomes distracted during this cognitive process, there’s an
Enter the frontal lobe
A message enters the frontal lobe
It enters the hippocampus
The message joins with other messages already in the hippocampus.

Слайд 34“Repeated distractions that trigger rapid shifts in attention take a toll
http://link.highedweb.org/2013/12/are-your-digital-devices-rewiring-your-brain/
Text formatting, please ☺

Слайд 353. We process data faster
This surprising result led the scientists to
Nicholas Carr, NY Times book review of “The Shallows: What the Internet Is Doing to Our Brains”
Digital interaction has improved our hand-eye coordination and reflexes are quicker and more reactive.
Article describing how our brains are being rewired due to our digital device activities. http://link.highedweb.org/2013/12/are-your-digital-devices-rewiring-your-brain/
.
Text formatting, please ☺

Слайд 364. We’re more visual
Another influential study demonstrated that after just 10
Nicholas Carr
Our ability to envision 3D graphics and visual animation is enhanced.
LINK Journal
“One average users only read 28% of words on a web page per visit”
Nielson, J. (2008). How Little Do Users Read?
Text formatting, please ☺


Слайд 38Is overloaded with information
Uses more systems/devices than ever
Is overloaded with information
Rapidly
Distributes attention thinly across
many things
Is found in all age brackets:

Слайд 39The new psychology of the modern learner is creating a mismatch

Слайд 40“Millennials are visual and kinesthetic learners who prefer to experience the
Oblinger, 2005 - http://www.aabri.com/manuscripts/111063.pdf

Слайд 41“Clark Quinn, the e-learning consultant, feels strongly it’s time for a
A.J. O’Conell
http://www.skilledup.com/insights/in-depth-look-why-workforce-e-learning-slow-to-change/


Слайд 43Factors Affecting Completion Rates in Asynchronous Online Facilitated Faculty Professional Development Courses
One corporate university noticed a large disparity in completion rates after introducing online facilitated courses to its faculty professional development program. After several offerings of these online facilitated staff development courses, it became apparent that many participants who started courses did not complete them. Analysis of initial results indicated a huge disparity in completion rates between classroom and online facilitated courses (44% online vs. 98% classroom).
98% completion
44% completion

Слайд 44https://www.insidehighered.com/news/2013/05/10/new-study-low-mooc-completion-rates
The average completion rate for massive open online courses is less
Katy Jordan, whose Ph.D. research focuses on online academic social networks, took time out from her doctorate to gather information on the number of people completing a range of free web-based courses. So far, she has tracked down information on the percentage of students completing 29 MOOCs.
98% completion
44% completion
7% completion

Слайд 45According to a recent report, 70 percent of corporate learners do
HRD Learning Participation: An Empirical Study of E-learning Completion Greg G. Wang, Diane Foucar-Szocki, and Oris Griffin James Madison University
http://files.eric.ed.gov/fulltext/ED492830.pdf


Слайд 47In order to keep up and create good instruction, you have


Слайд 50“Modern learners want things that help them advance their own personal
Nathan Pienkowski, Bull City Learning, April 9, 2015
Text formatting, please ☺

Слайд 51The grass is really long. It needs to be mowed –
Years of psychological research (including my own) have demonstrated that when people have a goal or set of goals, it trains their minds to notice things that will advance those goals (and that confirm their biases) and ignore or even fail to notice other things.

Слайд 52Ten years of constant A/B testing by the marketing community using
Include screen shot of Google search results showing alignment between search terms, ad phrases, and web page titles.
Can you help me with the screen shot? I’m not sure what to put here.

Слайд 53You want your training to stand out like a good Google
Include screen shot of Google search results showing alignment between search terms, ad phrases, and web page titles.

Слайд 54Create training around topics useful to the audience
Give the training titles

Слайд 55A lot of training does not denote value – top down
This is the equivalent of paying for a Google ad that reads “Boston terriers for sale” when someone searches for “Tickets to the Durham Bulls”
Someone up in “corporate”
Someone up in “corporate”
Here’s some training I want you to take
Here’s some training I want to take
Text formatting, please ☺

Слайд 56Organizational goals
(what you want to teach)
Learner goals
(what they want to learn)
Sweet
Where you want to be
Text formatting, please ☺
Learner goals(what they want to learn)Sweet SpotWhere you want to")
Слайд 57How?
Think like an online niche marketer
Niche marketers do keyword research

Слайд 58Keyword research is of no use to you – however, similar

Слайд 59Finally, you need to give your courses titles that pull –
Ethical behavior for
sales reps
5 easy ways to avoid
a billion dollar fine


Слайд 622.5
Minutes
Maximum time you should present new info before stopping, summarizing,
Text formatting, please ☺


Слайд 65“Showing people meaningful, content-based visuals, as opposed to text, lessens their
Chabris and Kosslyn (2005)

Слайд 66Internet content views can jump up 48% if it contains both
Hubspot
“One average users only read 28% of words on a web page per visit”
Nielson, J. (2008). How Little Do Users Read? and Helen McInnes (6 SlideShares) , Corporate Communications Specialist EMEA at NEC
It takes a person 1/10 of a second to interpret an image…text takes time.
Semetko, H. & Scammell, M. (2012). The SAGE Handbook of Political Communication, SAGE Publications and Helen McInnes (6 SlideShares) , Corporate Communications Specialist EMEA at NEC
The brain processes visual information 60,000x faster than text
Hubspot
Recall increases from 20% to 80% be adding images to text. Lester, PM (2006) Syntactic Theory of Visual Communication and Helen McInnes (6 SlideShares) , Corporate Communications Specialist EMEA at NEC
“One study showed that illustrated text was 9 percent more effective than text alone when comprehension was tested right away, but that it was 83 percent more effective when the test was delayed, thus implying the reader’s ability to remember the information better later, because of the illustration (Rusted and Coltheart, 1979).” Windows
“Levie and Lentz (1982) looked at 46 experiments comparing pictures included with text, or text used alone, and found that 45 of the studies—all but one—showed that including pictures improved memory or comprehension. In one case, a group following directions in text illustrated with diagrams did an amazing 323% better than a group following the same directions without the illustrations.”

Text formatting, please ☺")


Слайд 74Particularly with big learning initiatives that are important to the success
8x
Minimum number of message repetitions it usually takes for a message/idea/behavior to be embraced.
Text formatting, please ☺


Слайд 82Here are our tips for doing this
http://www.msmdesignzblog.com/are-mobile-devices-destroying-our-attention-spans/
http://www.educause.edu/ero/article/distraction-engagement-wireless-devices-classroom, Example studies
Example studies

Слайд 83Summary of the modern learner:
More distracted
Spend less time on things
Good visual
Process information quickly
Need just-in-time knowledge to aid memory
Rely on external aids to help with memory

Слайд 84The results of the study indicated that combinations of animation, narration,
http://www.cisco.com/web/strategy/docs/education/Multimodal-Learning-Through-Media.pdf (2008)
https://getd.libs.uga.edu/pdfs/dousay_tonia_a_201305_phd.pdf EFFECT OF MULTIMEDIA DESIGN PRINCIPLES ON SITUATIONAL INTEREST OF ADULT LEARNERS
The results of the study indicated that combinations of animation, narration, and text do influence the situational interest of learners.
http://www.cisco.com/web/strategy/docs/education/Multimodal-Learning-Through-Media.pdf (2008)

Слайд 85“One average users only read 28% of words on a web
It takes a person 1/10 of a second to interpret an image…text takes time. Semetko, H. & Scammell, M. (2012). The SAGE Handbook of Political Communication, SAGE Publications and Helen McInnes (6 SlideShares) , Corporate Communications Specialist EMEA at NEC
The brain processes visual information 60,000x faster than text Hubspot
“Human beings are highly visual and can absorb visual information faster and more easily than other kinds of information.” Forbes
Recall increases from 20% to 80% be adding images to text. Lester, PM (2006) Syntactic Theory of Visual Communication and Helen McInnes (6 SlideShares) , Corporate Communications Specialist EMEA at NEC
“Most people forget a large amount of what they’ve read, but they do remember what they’ve seen.” Forbes
“Showing people meaningful, content-based visuals, as opposed to text, lessens their cognitive exertion and improves overall experience. Chabris and Kosslyn (2005)Chabris and Kosslyn (2005)” and Windows
“The result of picture-based visual communication is improved learning and recall. Levie and Lentz (1982) looked at 46 experiments comparing pictures included with text, or text used alone, and found that 45 of the studies—all but one—showed that including pictures improved memory or comprehension. In one case, a group following directions in text illustrated with diagrams did an amazing 323% better than a group following the same directions without the illustrations.” Windows
“Some researchers contend that including off-topic or irrelevant pictures and video clips in educational materials actually can have negative effects on learning. See Tversky and Morrison (2001), Mayer, Heiser, and Lonn (2001) and Mayer (2003).” Windows
“One study showed that illustrated text was 9 percent more effective than text alone when comprehension was tested right away, but that it was 83 percent more effective when the test was delayed, thus implying the reader’s ability to remember the information better later, because of the illustration (Rusted and Coltheart, 1979).” Windows
Internet content views can jump up 48% if it contains both photos and video Hubspot
85% of internet users in the US watch online video Hubspot

Слайд 86http://www.npr.org/templates/story/story.php?storyId=127370598
“All Things Considered” interview with the Author of “The Shallows”
He believes
It changes the way we read and alters the way we acquire wisdom, deep read, and concentrate
The “skimming the surface” of internet surfing affects human concentration outside of the computer and into the real world.
The brain is skilled at adaptation to its environment. The more adjusted it becomes to dealing with interruptions, the more adept it becomes to that mode of thinking, but lose the capability to concentrate and be introspective.
As people optimize their online skills, they lose creative & completive thinking.

Слайд 87http://www.huffingtonpost.com/2013/10/24/attention-span-book_n_4151059.html
Explains how the increase of digital information is contributing to the
http://techland.time.com/2013/07/08/a-nation-of-kids-with-gadgets-and-adhd/
TIME article asking if devices are to blame for the increase in behavioral disorders (ADHD)
Today, 1 in 10 children are diagnosed with ADHD. In the last decade, diagnoses of ADHD has increased by over 50%.
This coincides with the amount of time spent in front of device screens: 7.5hrs/day… an increase of 20% from 5years ago.
When children are buried in their devices, what appears to be ‘concentration’ is actually not. Their focus on TV & video games is different than the attention needed to thrive in school and life. “It’s not sustained attention in the absence of rewards, its sustained attention with frequent intermittent rewards.” (sustain attention in the absence of rewards = book reading, sustained attention with intermittent rewards = video games with badges and level ups, etc..)
Millenials are the trophy generation and they expect rewards just for showing up

Слайд 88http://digitalcommons.unl.edu/cgi/viewcontent.cgi?article=1070&context=journalismfacpub
Journal Article: Digital Distractions in the Classroom: Student Classroom Use of
A common belief among teachers is that although technology has greatly improved students’ research abilities & skills, it has created an easily distracted generation with short attention spans and has done more to distract students than to help them academically.
Learner perspectives on their own attrition - A widely distributed online survey reported that eLearners identified four primary factors affecting their decision to drop the course:
personal motivation
instructional design of the course/program
conflicts between study, and work and family
the feeling they had learned what they needed or wanted
A 2001 article concerning dropout rates in corporate eLearning courses, states that learners most frequently reported the following for the reasons of attrition:
lack of time
lack of motivation,
poorly designed courses
incompetent instructors

Слайд 89The number of students taking online courses are greater than face-to-face
1997 = 50k college-level students enrolled in online courses
2012 = 5.5M that are enrolled in at least 1 online course (2.6M taking a full-load of online courses) - SOURCE
BUT attrition rates are 10%-20% higher in those taking online courses
http://www.thejeo.com/Volume4Number2/Angelino%20Final.pdf
2007 Clemson University literature review: “Strategies to Engage Online Students and Reduce Attrition Rates”
Carr (2000) reported dropout rates as high as 80% in online classes and suggested a rule of thumb that course completion rates are often 10 to 20% higher in traditional courses.