Theme 10
1. Creative Vision 10
2. Mock Up 10
Overview
Use this document to communicate the content and visual theme ideas for your project blueprint infographic to the design and production team. Examples of Info-Tech infographics can be viewed at http://www.infotech.com/infographics. Examples of McLean & Co infographics can be found at http://hr.mcleanco.com/infographics. Optimal size is 1220px width (fixed) and 2500px length (though there is some latitude to vary this length depending on detail).
Info-Tech project blueprint infographics are intended to promote the Info-Tech brand to clients and potential clients, encouraging greater engagement with Info-Tech through guided implementations and onsite workshops. They are intended for wide use and distribution - through social media, client emails (distribution), on our website, and in other sales and analyst engagements with clients and prospects.
As these artifacts are being used in a variety of situations, it is important that your infographic have standalone value. This is to say that the reader should learn something from reading the infographic. The infographics should highlight Info-Tech’s insights. Please avoid making this a glorified table of contents for your project blueprint (though project steps should be included.)
Suggested content sources: project outline, insight map, introduction/make the case section of your project deck.
Our designers have demonstrated that they can create compelling visuals for the infographics however analyst input on the overall look of the infographic is critical. In addition to the necessary content below, you need to provide your ideas of how you think the infographic should look. Is there a visual metaphor, for example, that will help illustrate your main insight? Your thematic ideas will provide a starting point for the designers.
Next Steps: Place this scope document in your SharePoint project folder along with other project deliverables (metadata, slides, etc.). It will be proofed by production and then assigned to a designer to create the infographic. We may circle back to you any questions or design ideas.
Content
For the designer, the analyst will enter the following elements:
The Infographic Title
This is the main title of the infographic. It can be the title of the blueprint, but doesn’t have to be. Ensure the project title is unique enough to identify the specific blueprint.
Modernize the Performance Appraisal
Project Tagline
Insert the tagline of your Blueprint project or create a custom tagline for the infographic. This should be slightly longer then the Project Title, but no longer than 20 words.
Use the Modern Performance Appraisal Framework to engage your employees and managers in performance management all year round.
Member Understanding/Client Pain
This statement is used to identify the target audience and the challenge they are trying to overcome. Specifically identify the member/role. It should be adapted from our initial member understanding document. Max length at the analyst’s discretion. It could be a simple statement or it could incorporate survey data or direct quotes from the trenches.
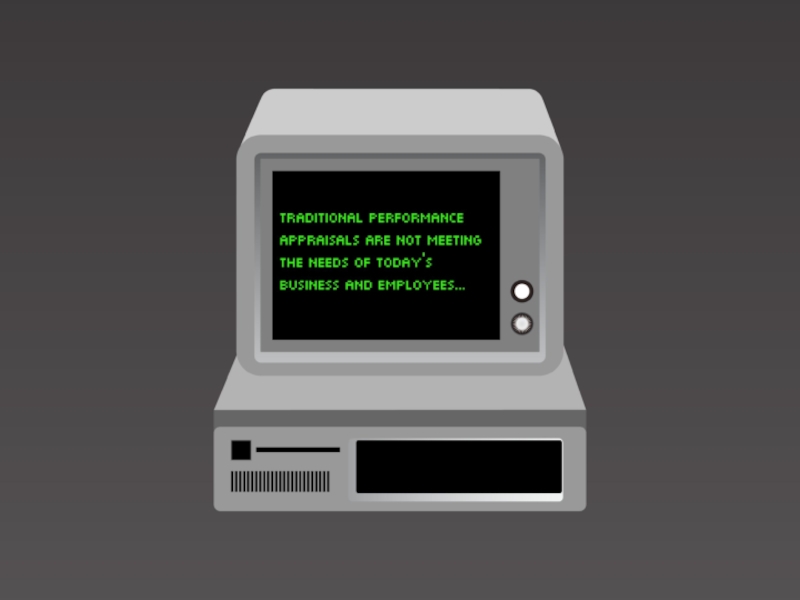
Traditional performance appraisals are not meeting the needs of today’s business and employees.
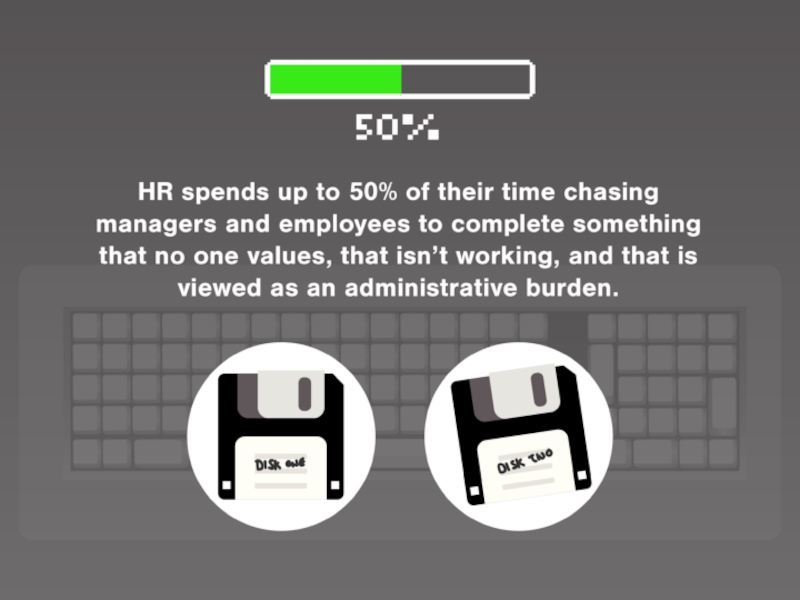
HR spends up to 50% of their time chasing managers and employees to complete something that no one values, that isn’t working, and that is viewed as an administrative burden.
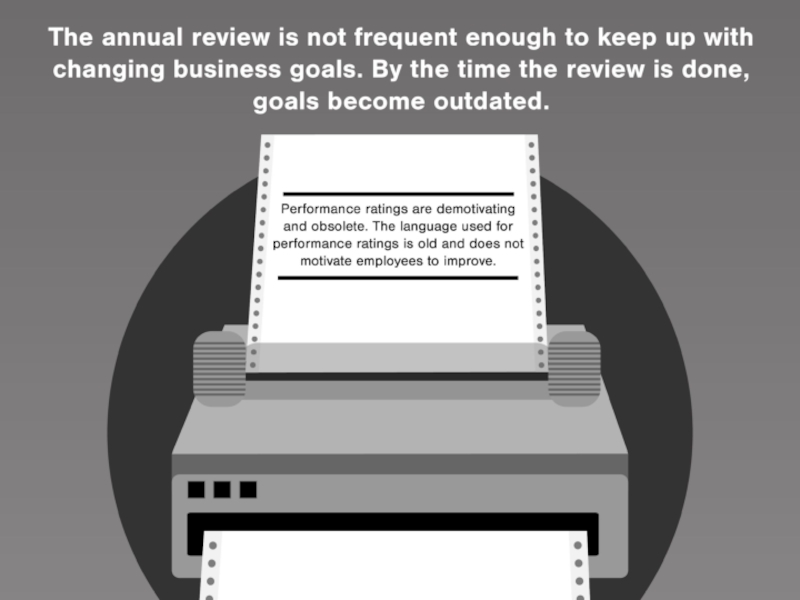
The annual review is not frequent enough to keep up with changing business goals. By the time the review is done, goals become outdated.
Performance ratings are demotivating and obsolete. The language used for performance ratings is old, and does not motivate employees to improve.
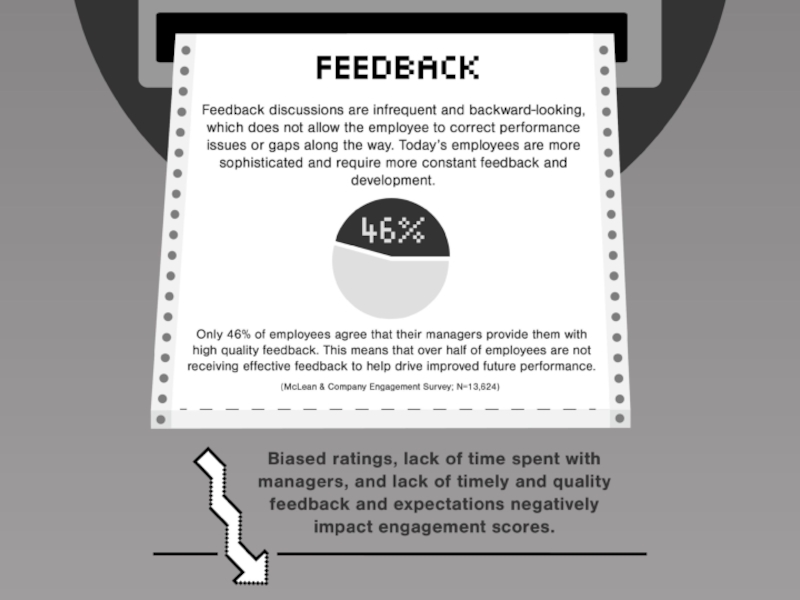
Feedback discussions are infrequent and backward-looking, which does not allow the employee to correct performance issues or gaps along the way. Today’s employees are more sophisticated and require more constant feedback and development. Only 46% of employees agree that their managers provide them with high quality feedback. This means that over half of employees are not receiving effective feedback to help drive improved future performance (McLean & Company Engagement Survey; N=13,624).
Biased ratings, lack of time spent with managers, and lack of timely and quality feedback and expectations negatively impact engagement scores.
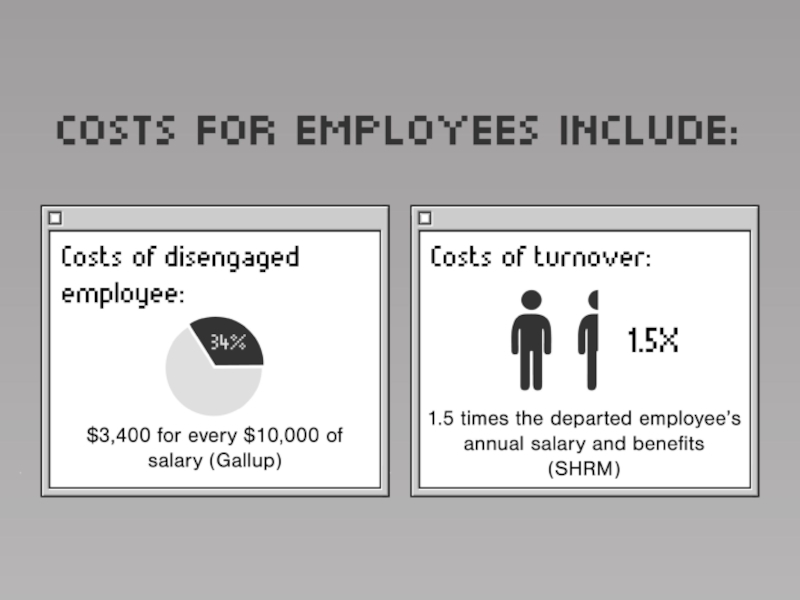
Costs for employers include:
Costs of disengaged employee:
$3,400 for every $10,000 of salary (Gallup)
Costs of turnover:
1.5 times the departed employee’s annual salary and benefits (SHRM)
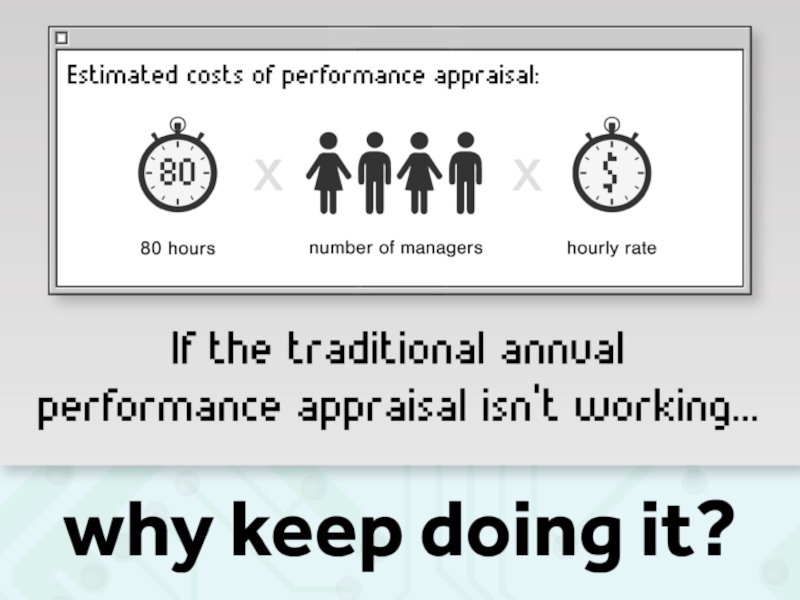
Estimated costs of performance appraisal:
80 hours x number of managers x hourly rate
Overall Insight
This overall insight is the central idea of the Blueprint. The overall insight should also drive the overall creative vision of the document. A well-crafted insight statement is key here. Try to make this statement short and sweet.
If the traditional annual performance appraisal isn’t working, why keep doing it?
Sub-Insights
Include insights relating schools of thoughts, drivers/trends/change, value creation, etc. Be sure to include data points, complications, unique approaches, etc. that enhance or support the overall insight.
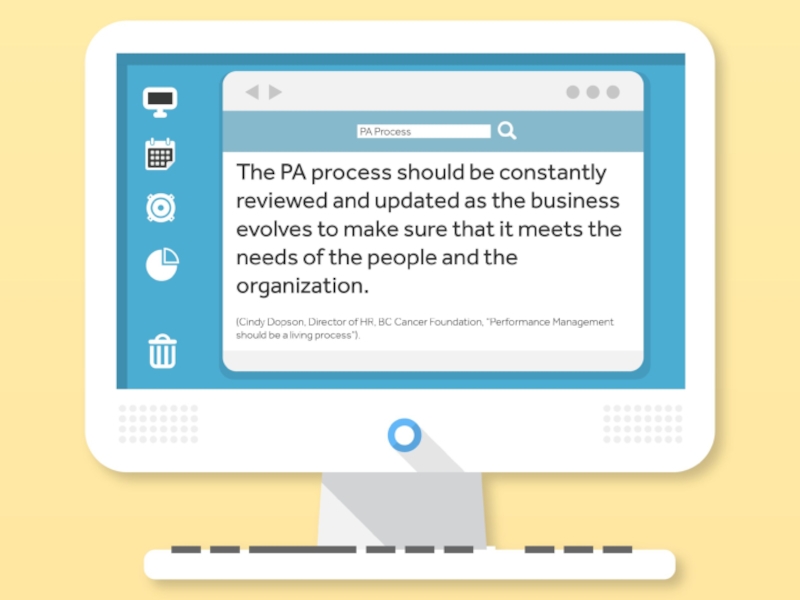
The PA process should be constantly reviewed and updated as the business evolves to make sure that it meets the needs of the people and the organization (Cindy Dopson, Director of HR, BC Cancer Foundation, “Performance Management should be a living process”).
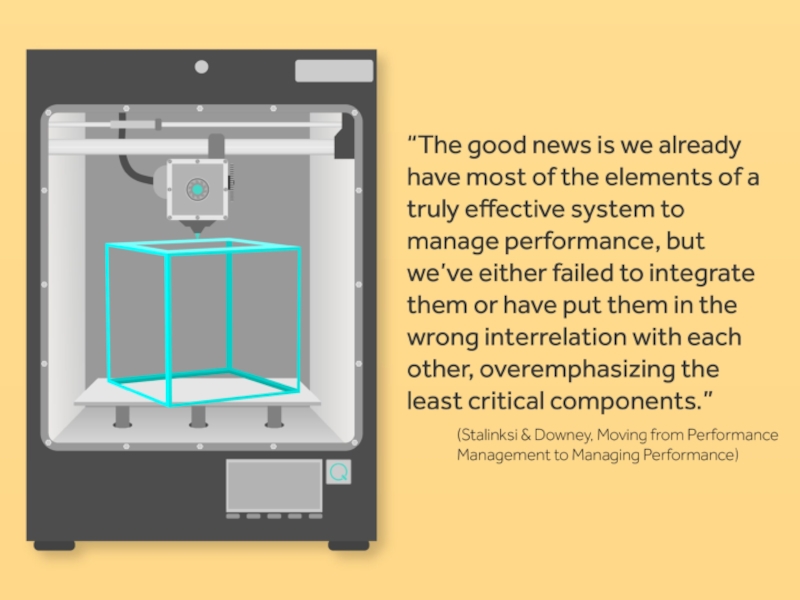
“The good news is we already have most of the elements of a truly effective system to manage performance, but we’ve either failed to integrate them, or have put them in the wrong interrelation with each other, overemphasizing the least critical components.” - Stalinksi & Downey, Moving from Performance Management to Managing Performance
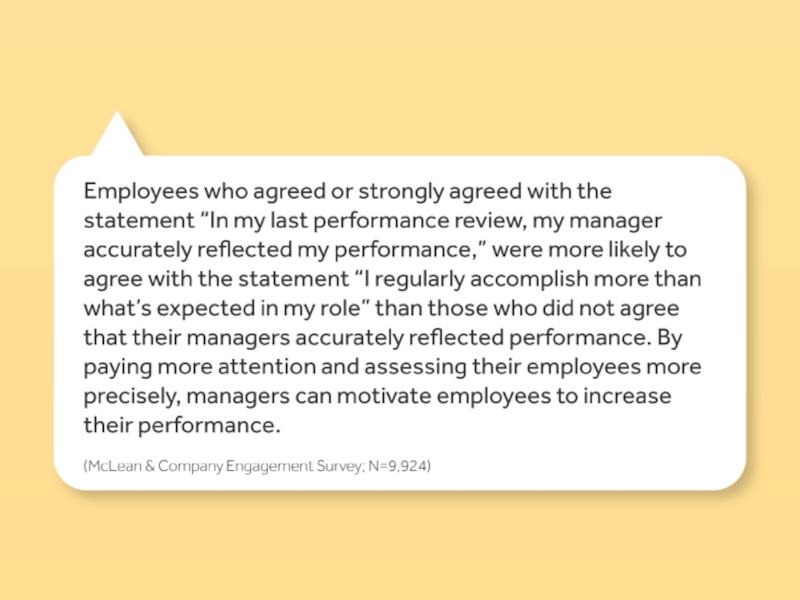
Employees who agreed or strongly agreed with the statement “In my last performance review, my manager accurately reflected my performance,” were more likely to agree with the statement “I regularly accomplish more than what’s expected in my role” than those who did not agree that their managers accurately reflected performance. By paying more attention and assessing their employees more precisely, managers can motivate employees to increase their performance (McLean & Company Engagement Survey; N=9,924).
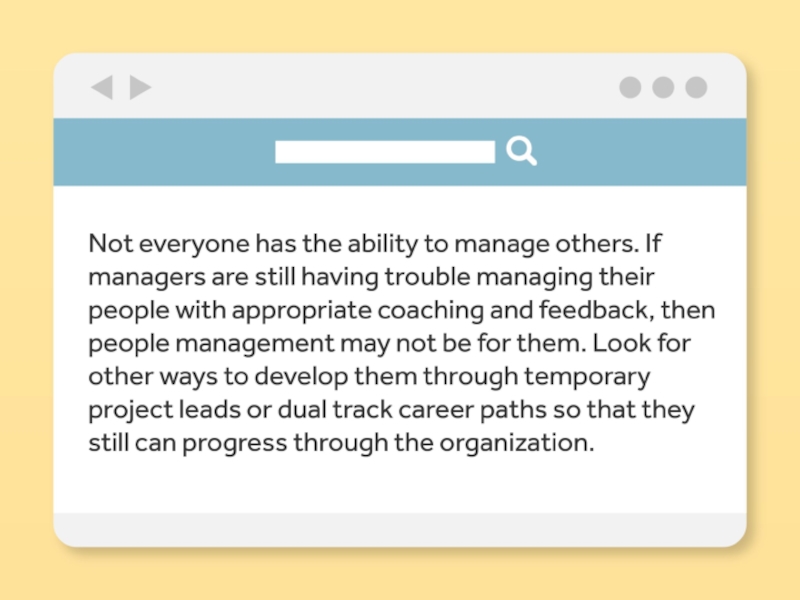
Not everyone has the ability to manage others. If managers are still having trouble managing their people with appropriate coaching and feedback, then people management may not be for them. Look for other ways to develop them through temporary project leads, or dual track career paths so that they still can progress through the organization.
Project Steps
A set of steps used to solve the member challenge. Our solution to the clients’ problem. These steps should align with the respective project steps and guided implementations. Here again the amount of detail is up to analyst discretion. It could just be a name of the step with a brief (one or two sentence) description or it could be the name of the step with additional insight/info on why that step is important.
Step Name
Step Insight (or Description if no insight is present)
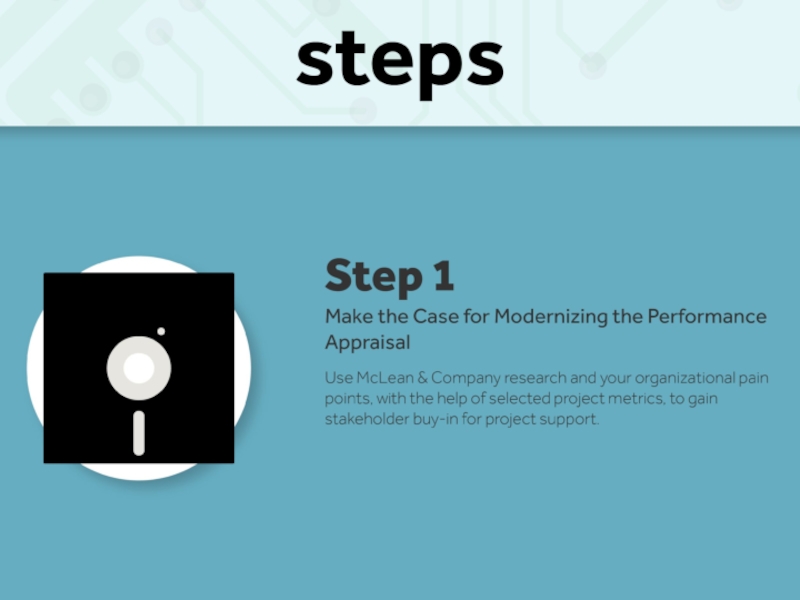
Step 1
Make the Case for Modernizing the Performance Appraisal
Use McLean & Company research and your organizational pain points, with the help of selected project metrics, to gain stakeholder buy-in for project support.
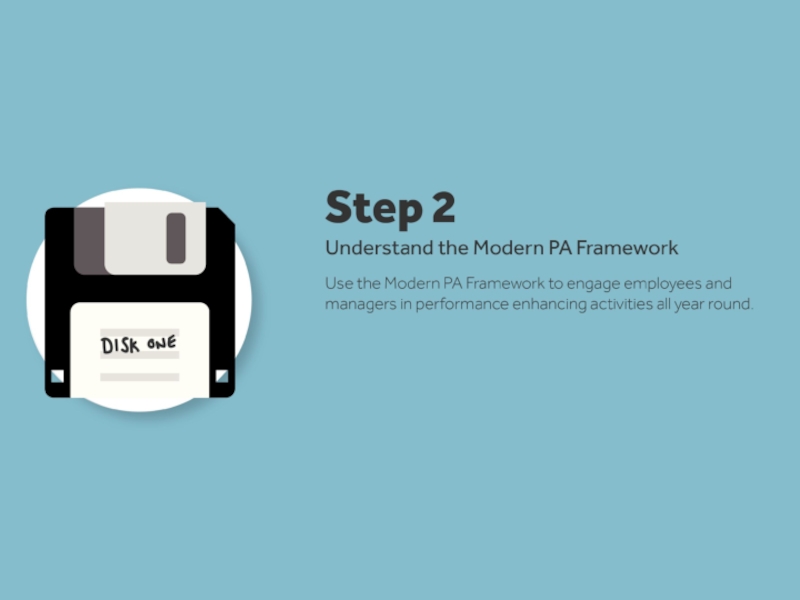
Step 2
Understand the Modern PA Framework
Use the Modern PA Framework to engage employees and managers in performance enhancing activities all year round.
Step 3
Design a Modern PA Framework
Customize the Modern PA Framework to the organization’s unique characteristics by setting core competencies, updating the performance rating, and defining a standard goal setting model.
Step 4
Put the Framework in Action
Review the steps of the framework in action.
Step 5
Communicate and Train to Manage Change
Manage the change process of modernizing the performance appraisal with a structured communication plan. Follow up the communication with training for both employees and managers to equip them to manage the performance appraisal effectively.
Step 6
Follow Up and Measure Success
Regularly check-in with employees and managers, and solicit their feedback to measure the effect of the change toward positively impacting the organization.
Step 7
Footer Data
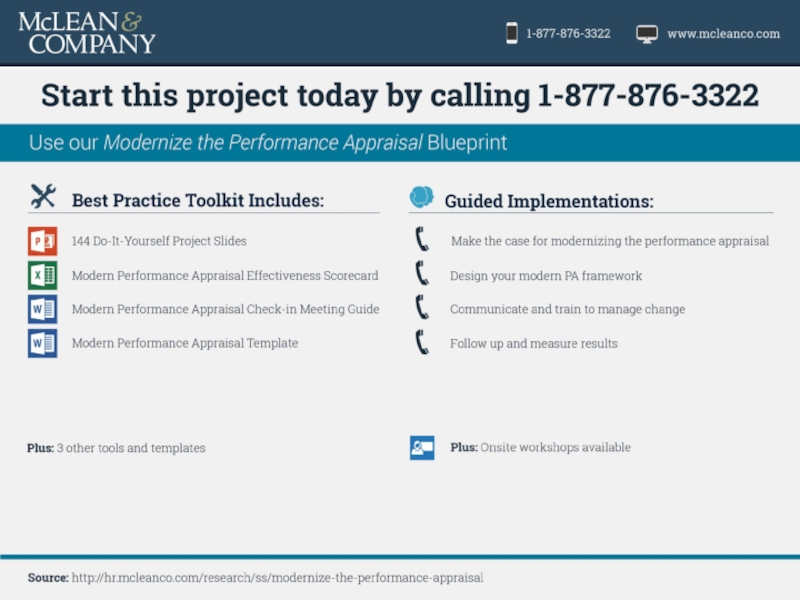
As a standing element all infographics have in their footer a listing of all the deliverables of your project blueprint (tools, templates, powerpoint) and a listing of Guided Implementation calls that are associated with this project.
Footer Metadata – Tools
(For use in the footer only)
Modern PA Effectiveness Scorecard (Excel)
Modern PA Check-in Meeting Guide (Word)
Training Deck: Modernize the PA
144 Do-It-Yourself Project Slides
Please insert the name and type for each tool in your blueprint.
I.E. Process Assessment – Excel Tool
Footer Metadata – Guided Implementations
(For use in the footer only)
Make the case for modernizing the performance appraisal
Design your modern PA framework
Communicate and train to manage change
Follow up and measure results
Please insert the name of each guided implementation as they appear in the blueprint.
Name of Blueprint
(For use in the footer only)
Modernize the Performance Appraisal
Please insert the name of the blueprint as it will appear on the title slide.
Visual Theme
Creative Vision
Describe your vision for what the infographic should look like. Infographics look best in a gallery or thumbnail view if they have a few dominant images. Give the designer a place to start. They will further develop the theme, or they may come up with something different, but the conversation needs to start somewhere.
The blueprint is about bringing something traditional into more modern, so maybe have images that look somewhat old fashioned, early 19th century area in black and white or sepia tones, contrasting against colored more modern day images (not too futuristic though).
Mock Up
Insert a mock-up of the infographic here. This should be a relatively simple drawing that blocks out how you see the infographic being laid out. You can use a PowerPoint slide if you are more comfortable with that or you can just draw something out and scan it. It should be “rough” – it’s the designer’s job is to make it look good. This is just a sketch. A starting point.
- Главная
- Разное
- Дизайн
- Бизнес и предпринимательство
- Аналитика
- Образование
- Развлечения
- Красота и здоровье
- Финансы
- Государство
- Путешествия
- Спорт
- Недвижимость
- Армия
- Графика
- Культурология
- Еда и кулинария
- Лингвистика
- Английский язык
- Астрономия
- Алгебра
- Биология
- География
- Детские презентации
- Информатика
- История
- Литература
- Маркетинг
- Математика
- Медицина
- Менеджмент
- Музыка
- МХК
- Немецкий язык
- ОБЖ
- Обществознание
- Окружающий мир
- Педагогика
- Русский язык
- Технология
- Физика
- Философия
- Химия
- Шаблоны, картинки для презентаций
- Экология
- Экономика
- Юриспруденция
Infographic Scope Document Contents Overview 2 Content 3 1. The Infographic Title 3 2. Project Tagline 3 3. Member Understanding/Client Pain 3 4. Overall Insight 5 5. Sub-Insights 5 6. Project Steps 6 7. Footer Data 9 Visual Theme 10 1. Creative Vision 10 презентация
Слайд 1Infographic Scope Document
Contents
Overview 2
Content 3
1. The Infographic Title 3
2. Project Tagline 3
3. Member Understanding/Client Pain 3
4. Overall Insight 5
5. Sub-Insights 5
6. Project Steps 6
7. Footer Data 9
Visual