- Главная
- Разное
- Дизайн
- Бизнес и предпринимательство
- Аналитика
- Образование
- Развлечения
- Красота и здоровье
- Финансы
- Государство
- Путешествия
- Спорт
- Недвижимость
- Армия
- Графика
- Культурология
- Еда и кулинария
- Лингвистика
- Английский язык
- Астрономия
- Алгебра
- Биология
- География
- Детские презентации
- Информатика
- История
- Литература
- Маркетинг
- Математика
- Медицина
- Менеджмент
- Музыка
- МХК
- Немецкий язык
- ОБЖ
- Обществознание
- Окружающий мир
- Педагогика
- Русский язык
- Технология
- Физика
- Философия
- Химия
- Шаблоны, картинки для презентаций
- Экология
- Экономика
- Юриспруденция
Demographic statistics презентация
Содержание
- 1. Demographic statistics
- 3. Topics 1. Objectives of demographic statistics 2.
- 4. Demographic statistics Among the
- 5. 1. Objectives of demographic statistics
- 6. 1. Objectives of demographic statistics
- 7. The population statistics solves the
- 8. 2. Sources of demographic
- 9. 2.1. Population censuses Population
- 10. 2.1. Population censuses
- 11. 2.1. Population censuses A population census is
- 12. 2.1. Population censuses The census is an
- 13. Basic features of a population and housing
- 14. Basic features of a population and housing
- 15. Uses of census results - Censuses provide
- 16. Census results - Population censuses have been
- 17. One of the first states
- 18. 2.1. Russian censuses In our
- 19. 2.1.2. Census of 2010 The All-Russia population
- 20. The Emblem of the 2010 All-Russia population census
- 21. 2.1.2. Census of 2010 We shall look
- 22. 2.2. Administrative records of vital events
- 23. 2.2. Administrative records of migration
- 24. Administrative records Many types of social statistics
- 25. Administrative records While administrative records can be
- 26. For most countries, information from administrative records
- 27. In many developing countries, while administrative records
- 28. 2.3. The population register More than 70
- 29. A population register maintains life databases
- 30. Household surveys
- 31. Household surveys
- 32. There are different types of household surveys
- 33. Specialized surveys cover single subjects or issues
- 34. In multi- subject survey different subjects
- 35. While household surveys are not as
- 36. Some advantages of household surveys compared to
- 37. Some advantages of household surveys compared to
- 38. Information of a more specialized type may
- 39. Complementarities of the three data sources The
- 40. Complementarities of the three data sources Censuses
- 41. On the other hand the census, among
- 42. In many countries, sampling frames for household
- 43. Small area estimation, which has received a
- 44. In countries with well-developed civil registration systems,
- 45. In conclusion, censuses, household surveys and administrative
- 46. During intervals between censuses a
- 47. 2.2. The Russian population number The population
- 48. 2.2. The Russian population number In
- 49. Number of births
- 50. Number of deaths
- 51. 3. Population categories Number of inhabitants of
- 52. 3. Population categories Constant (resident) population RP
- 53. 3. Population categories
- 54. 3. Population categories There is no essential
- 55. 4. The population analysis Population
- 56. Changes in population are characterized by means
- 57. 4. The population analysis 4.1. An
- 58. 4.1. An average number of population
- 59. 4.1. An average number of population
- 60. 4.1. An average number of population 3.
- 61. 4.1. An average number of population or
- 62. 5. Studying structure of the population
- 63. 5.1. Territorial distribution
- 64. 5.1. Territorial distribution
- 65. 5.1. Territorial distribution For January,
- 66. 5.1. Territorial distribution Geographic distribution
- 67. Crowd in HK
- 68. 5.1. Global population density The world population is
- 69. 5.1. Human population density Several of
- 70. 5.1. Human population density City population
- 71. 5.1. Other methods of density measurement
- 72. 5.1. Urban and rural population
- 73. Greater Tokyo Area
- 74. Sign in a rural area in Dalarna , Sweden
- 75. 5.2. Sex and age structure The grouping
- 76. 5.2. Age structure Following
- 77. 5.2.Sex ratio The ratio of males to
- 78. 5.2. Sexual and age structure A useful
- 79. 5.2. Sexual and age structure Bar graphs
- 80. Canada males in 2009
- 81. Canada females in 2009
- 82. Population pyramid If we were to display
- 83. Population pyramid
- 84. Canadian population pyramid This population pyramid shows
- 85. Population pyramid Analyzing population pyramids and identifying
- 86. Age - sexual structure of the population of the Russian Federation for January, 1st, 2009
- 87. Population pyramids A population pyramid, also called
- 88. 5.2. Sexual and age structure In separate
- 89. 5.3. Marriage structure To draw marriage structure
- 90. Number of marriages and divorces
- 91. 5.3. Marriage structure The general ratios of
- 92. 5.3. Marital ratios 1. Marriage ratio, showing
- 93. 5.3. Marriage and divorce Ratio of marriage
- 94. 5. Рopulation structure The structure of the
- 95. 6. Population reproduction Population reproduction is
- 96. 6.1. Studying the natural movement of the
- 97. 6.1. Natural movement Natural movement is characterized
- 98. 6.1. Natural movement Data across Russia for
- 99. 6.1. Natural movement Relative indicators are
- 100. The relative indicators of natural movement comprise
- 101. 6.1.1.Birth rate shows the number of live
- 102. 6.1.2.Death (mortality) rate shows the
- 103. 6.1.2. Death rate
- 104. 6.1.3.Natural increase rate shows the size of
- 105. Data on Russia for 2008:
- 106. 6.1.4. Viability rate by V.
- 107. The Viability rate shows the coordination of
- 108. 6.1.4. Viability rate If the viability rate
- 109. 6.2. Partial and special rates In
- 110. 1. Age fertility rate indicates the number
- 111. 6.2.Special fertility rate
- 112. 6.2.Special fertility rate There is connection between
- 113. The share of women at the age
- 114. 4. Total fertility rate depends on the
- 115. 6.2.1.Повозрастной коэффициент смертности рассчитывается делением числа умерших
- 116. 6.2.Частные коэффициенты Любой общий коэффициент можно представить
- 117. 6.2.Частные коэффициенты Таким образом, общий коэффициент зависит
- 118. 6.2.2.Коэффициент младенческой смертности Младенец – это ребенок
- 119. 3. Коэффициент младенческой смертности, который вычисляется как
- 120. 6.2.2.Коэффициент младенческой смертности Коэффициент младенческой смертности вычисляется
- 121. 6.2.2.Коэффициент младенческой смертности где N0- число родившихся
- 122. 6.2.2.Коэффициент младенческой смертности Две другие формулы:
- 123. 6.2.2.Коэффициент младенческой смертности Данные по
- 124. 6.2.Специальные коэффициенты - Коэффициент брачности, показывающий, сколько
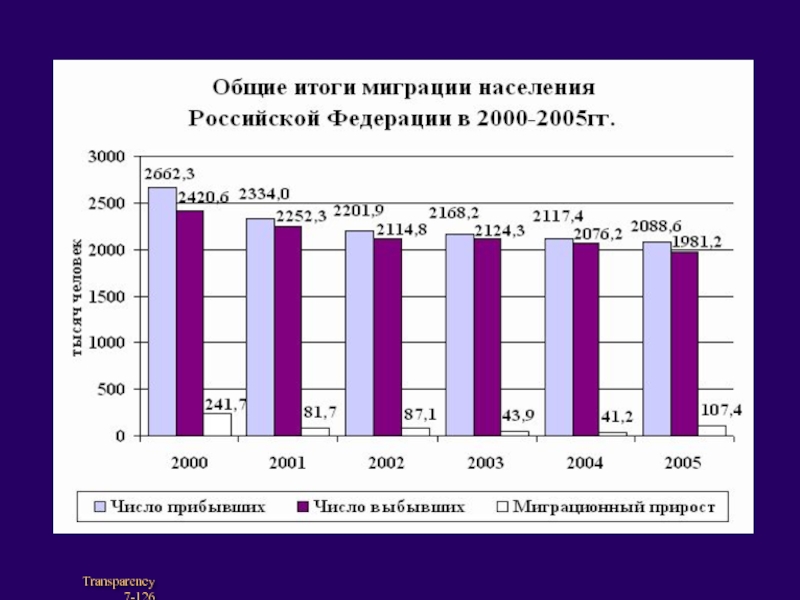
- 125. 7. Изучение миграции населения Перемещение населения
- 127. Анализ данных о миграции показывает, куда, откуда
- 128. Миграция населения изучается с помощью абсолютных и
- 129. Абсолютные показатели по России за 2008 г.
- 130. К относительным показателям относятся коэффициент прибытия, коэффициент
- 131. Коэффициент прибытия показывает, сколько человек прибывает в
- 132. 7.Таблицы смертности Another summary is called the life
- 133. Ожидаемая продолжительность жизни при рождении – один
- 134. 8. Расчет перспективной численности населения В
- 135. Для планирования многих народно-хозяйственных показателей очень важно
- 136. Данные по России за 2007 год –
- 137. Перспективная численность населения рассчитывается на основе данных
- 138. Коэффициент общего прироста населения (КО.П) рассчитывается следующим
- 139. где Нn – численность населения на начало
- 140. Также возможен расчет перспективной численности населения с
- 141. Возможны более сложные расчеты перспективной численности населения


Слайд 3Topics
1. Objectives of demographic statistics
2. Sources of demographic data
3. Population categories
4.
5. Population structure
6. Demographic reproduction
7. Life tables
8. Migration statistics
9. Demographic forecasting

Слайд 4Demographic statistics
Among the kinds of data that national

Слайд 5
1. Objectives of demographic statistics
While domestic product formation is studied

Слайд 6
1. Objectives of demographic statistics
The statistics studies the population
as
as an economic category, i.e. the participants of production process.
The information is necessary for state regulation, management and manufacture (to estimate the sizes of manufacture of various kinds of products, public health services development, etc.)

Слайд 7
The population statistics solves the following primary tasks:
1. Counts population and
2. Characterizes population structure
3. Investigates reproduction processes – natural movement of the population
4. Considers mechanic movement (migration) of the population
5. Estimates a future number of population
6. Develops methods of statistical survey and analysis of demographic processes
Objectives of demographic statistics

Слайд 8
2. Sources of demographic data
There are three main
administrative records of births, deaths, marriages, immigration and emigration ; it is called the current counting in Russia
population and housing censuses
population and household registers.
These three sources, if well planned and executed, can be complementary in an integrated program of data collection and compilation.
Social and demographic statistics are essential for planning and monitoring socio-economic development programs. Population composition by age and sex including geographical distribution are among the most basic data necessary to describe a population or/and a sub-group of a population. These basic characteristics provide the context within which other important information on social phenomena, such as education, disability, labour, health, nutrition, crime, fertility, mortality and migration, can be studied

Слайд 9
2.1. Population censuses
Population is an instant indicator characterizing number of persons,
Demographic data characterizes a population at a certain date. The full and exact instant characteristic of number, structure and population distribution are gathered during population censuses. A regular census of population provides information that is key to making sound decisions about national policy

Слайд 102.1. Population censuses
Census is a single statistical
Population censuses supply the fullest and most exact information on number and structure of population.
To ensure complete and accurate counting of population, it is necessary to provide some moment of time - usually on the 1st of January, on the 1st of July (mid-year estimation), and also at the critical moment of census

Слайд 112.1. Population censuses
A population census is the total process of collecting,

Слайд 122.1. Population censuses
The census is an ideal method for providing information

Слайд 13Basic features of a population and housing census
- Individuals in the
- Universality within a defined geographic area/territory. The population census potentially covers the whole population in a clearly defined territory. It should include every person present and/or usual residents depending on whether the type of population count is de facto or de jure. In the absence of comprehensive population or
administrative registers, censuses are the only source that can provide small area statistics

Слайд 14Basic features of a population and housing census
The enumeration has to
Censuses are usually conducted at defined intervals. Most countries conduct censuses every 10 years while others every five years. This facilitates the availability of comparable information at fixed intervals

Слайд 15Uses of census results
- Censuses provide information on size, composition and
population together with demographic and social characteristics
- They are also used as sources of sampling frames with some auxiliary information, which can be useful for sample selection and estimation in household survey
- Censuses are a source of small area statistics

Слайд 16Census results
- Population censuses have been carried out in many countries

Слайд 17
One of the first states which have begun general and regular
Census is a very expensive action. In Russia it costs about 350 million dollars (10 bln rubles for the 2010 census) or 2,5 USD per person. Russian census is cheap enough: in Europe it costs from 12-15 to 20 dollars per person
2.1. Population censuses

Слайд 182.1. Russian censuses
In our country population census were
Next population census should had been in the Russian Federation in 1999г., but in connection with difficult financial and economic situation it has been postponed for October 2002. The critical moment of census – 0.00 hours of the 9th of October, 2002.
Registration took place from October, 9th till October, 16th. During the census all population of the Russian Federation was counted

Слайд 192.1.2. Census of 2010
The All-Russia population census of 2010 will be


Слайд 212.1.2. Census of 2010
We shall look thru the presentation concerning this

Слайд 222.2. Administrative records of vital events
During intervals between censuses the
In Russia natural movement of the population is considered through departments of the REGISTRY OFFICE (civil registrations). Each fact of death or birth, marriage and divorce is registered there.
In each primary document it is fixed not only the fact of approach of event, but also data on the registered person

Слайд 232.2. Administrative records of migration
Mechanical movement is considered in militia
The registration role the Federal Migration Agency increased substantially during last years. Thanks to its efforts the number of immigrants registered and as a result counted by the Rosstat grew significantly, and the official number of present Russian population became more stable

Слайд 24Administrative records
Many types of social statistics are compiled from various administrative
The reliability of statistics from administrative records depends on the completeness of the administrative records and the consistency of definitions and concepts. It is therefore necessary to continuously improve and update the systems of recording, compiling and analysing such data. Wherever possible, it is advisable to use the same definitions and concepts used for other data sources. This would facilitate the comparability of data

Слайд 25Administrative records
While administrative records can be very cost-effective sources of data,

Слайд 26For most countries, information from administrative records is often limited in
Administrative records

Слайд 27In many developing countries, while administrative records for various social programmes

Слайд 282.3. The population register
More than 70 countries of the world use
What information does usually contain in the register? There is the data of medical insurance, given to the car inspection, the pension fund, the police. A key parameter is used – a code, appropriated to each person (like the INN in Russia), and this parameter is presented at all records

Слайд 29 A population register maintains life databases for every person and
Population register

Слайд 30Household surveys
Household sample surveys are key
In sample surveys, part of the population is selected from which observations are made or data are collected and then inferences are made to the whole population. Because in sample surveys there are smaller workloads for interviewers and a longer time period assigned to data collection, there are possibilities of covering most subject matters in greater detail than in censuses

Слайд 31Household surveys
In addition, there is scope
mechanism for meeting the additional and emerging needs on a continuous basis. The flexibility of household surveys, therefore, makes them excellent choices for meeting data users’ needs for statistical information which otherwise would not be available and insufficient.
Many countries have in place household survey programs, which include periodic and ad-hoc surveys. It is advisable that the household survey program should be part of an integrated statistical data collection system of a country. In the area of social and demographic statistics inter-censal household surveys can constitute part of this system

Слайд 32There are different types of household surveys that can be conducted
Household surveys

Слайд 33Specialized surveys cover single subjects or issues such as time-use or
Multi-phase surveys entail collecting statistical information in succeeding phases with one phase serving as a precursor to the next. The initial phase usually constitutes a larger sample than subsequent phases. It is used to screen sample units based on certain characteristics to ascertain the eligibility of such units to be used in the subsequent phases. These surveys are a cost-effective way of reaching the target population in the latter phases to collect detailed information on a subject of interest. Demographic and Health surveys are among those suited to
this approach
Household surveys

Слайд 34 In multi- subject survey different subjects are covered in a
In longitudinal surveys, data is collected from the same sample units over a period of time. The interval can be monthly, quarterly or annually. The purpose for conducting such surveys is to measure changes in some characteristics over a period of time. The major problem with this type of surveys is the high attrition (отсев) rate of respondents. There is also the problem of conditioning effect
Household surveys

Слайд 35 While household surveys are not as expensive as censuses they
Household surveys

Слайд 36Some advantages of household surveys compared to censuses:
The overall cost of
Household surveys

Слайд 37Some advantages of household surveys compared to censuses:
b. In general, sample
c. There is a greater scope and flexibility in a sample survey than in a census with respect to the depth of investigation and number of items in the questionnaire
Household surveys

Слайд 38Information of a more specialized type may not be collected in
An example is the weighing (взвешивания) of food and other measurements in a nutrition study. It is likewise, not feasible to subject every person in the population to a medical examination to collect data necessary for estimating HIV/AIDS infection. On the
other hand, it is possible to add items in a household sample survey that would be relatively complex for the census
Household surveys

Слайд 39Complementarities of the three data sources
The subject of combining information from
Because censuses cannot be repeated frequently, household surveys provide a basis for updating some census information especially at national and other large domain levels. In most cases only relatively simple topics are investigated in a census and the number of questions is usually limited. Census information can therefore be complemented by detailed information on complex topics from the household surveys, taking advantage of their small size and potential flexibility

Слайд 40Complementarities of the three data sources
Censuses and household surveys have, in
Collecting information on additional topics from a sample of the population, or households during the census is a cost-effective way to broaden the scope of the census to meet the expanding demands of social statistics. The use of sampling methods and techniques makes it
feasible to produce urgently needed data with acceptable precision when time and cost constraints would make it impractical to obtain such data through complete enumeration.
Sample enumeration carried out within the census operation is able to collect data on additional topics and ask more detailed information

Слайд 41On the other hand the census, among other things, provides a
Censuses support household surveys by providing frames and some auxiliary information for use in efficient design of surveys. Apart from provision of sampling frames, census information can be used to construct master samples. Further more auxiliary information from censuses can be used improve sample estimates through regression and ratio estimates, thereby improving the precision of survey estimates
Complementarities of the three data sources

Слайд 42In many countries, sampling frames for household surveys are based on
In order to achieve integration of data sources there is need to clearly identify units of enumeration and adopt consistent geographic units in collecting and reporting statistics through the various sources. In addition, it is essential to adopt common definitions, concepts and classifications across different sources of data.
Data from household surveys can also be used to check, for instance census coverage and content. The aim is to determine the size and direction of such errors. Census data can be used to evaluate some survey results
Complementarities of the three data sources

Слайд 43Small area estimation, which has received a lot of attention due
Complementarities of the three data sources

Слайд 44In countries with well-developed civil registration systems, census and survey data
Data from administrative records can be used to check and evaluate results from surveys and censuses. For instance in countries with complete vital registration systems, data on fertility and mortality from censuses can be crosschecked with that from the registration system
Complementarities of the three data sources

Слайд 45In conclusion, censuses, household surveys and administrative sources should be viewed
The household survey program should be part of an integrated statistical data collection system within a country, including censuses and administrative records so that the overall needs for socio-demographic statistics can be adequately met
Complementarities of the three data sources

Слайд 46
During intervals between censuses a population estimation on the beginning of
St+1 = St + Nt – Mt + Imt – Emt,
where St+1 и St - population in the years t+1 and t consiquently;
Nt - number of born during this year;
Mt - number of died during this year;
Imt - number of arrived (immigrated);
Emt – number of left (emigrated)
2.2. The balance of population

Слайд 472.2. The Russian population number
The population of the Russian Federation
at

Слайд 482.2. The Russian population number
In Russia live about 142 million people.
For
Our country suffers depopulation – reduction of population number as a result of excess of death rate over birth rate which today is observed. The factors of depopulation: social and economic conditions; a high urban concentration


Слайд 513. Population categories
Number of inhabitants of the given settlement changes under
Within the limits of the population account in the given settlement we should distinguish four categories of the population: resident (constant, de jure) and present (available, de facto), two supplementing categories – temporary absent and temporary present population

Слайд 523. Population categories
Constant (resident) population RP - is a set of
Present population PP - is a set of population who are actually being in the given settlement or on the given territory for the critical moment of census, irrespective of a place of their constant residing. In some cases PP is called de jure population
 population RP - is a set of population which constantly live")
Слайд 533. Population categories
Temporary present TP –
Temporary absent TA – resident persons which were absent in at the moment of the account (no longer than 6 months).
Between these categories of the population there is an interrelation which is called balance of categories of the population:
RP = PP – TP + TA
or
PP = RP – TA + TP

Слайд 543. Population categories
There is no essential difference between present and resident
Data about number of the present population is necessary for the organization of work of municipal transportation, trade, water supply and so forth. The Resident population data is to be known for planning of building of habitation and establishments of social sphere. The Rosstat counts both present, and resident population

Слайд 554. The population analysis
Population is characterized by means of absolute
An absolute indicator of population S is an instant indicator (for certain date), i.e. on January, 1st, on June, 1st, etc.
The general change of a population:
ΔS= St+1 – St.

Слайд 56Changes in population are characterized by means of analytical and dynamic

Слайд 574. The population analysis
4.1. An average number of population
The

Слайд 584.1. An average number of population
There can be some situations
1. There is data on the beginning and the end of period.
For calculation the formula of average arithmetic mean is used:

Слайд 594.1. An average number of population
2. If we have population

Слайд 604.1. An average number of population
3. Intervals between dates are not


Слайд 62 5. Studying structure of the population
Having defined population,

Слайд 635.1. Territorial distribution
The indicators which characterize the distribution
- population density;
- population on a separate territory;
- the average size of the city settlements etc.

Слайд 645.1. Territorial distribution
In the Russian statistics the population
The Russian Federation consists of 21 republics, 9 regions, 46 provinces, 2 federal cities, 1 autonomous region, 4 autonomous provinces, 1867 areas, 1099 cities (including federal cities), 327 city areas and districts, 1318 settlements of city type, 20127 rural administrations and 24,2 thousand municipal unions

Слайд 655.1. Territorial distribution
For January, 1st, 2009 the Russian Federation had

Слайд 665.1. Territorial distribution
Geographic distribution on territory of population is characterised
Population density is the number of people per unit of area usually per square kilometer or mile (which may include or exclude cultivated or potentially productive area). Commonly this may be calculated for county, city, country, another territory, or the entire world


Слайд 685.1. Global population density
The world population is 6.8 billion, and Earth's total area
")
Слайд 695.1. Human population density
Several of the most densely-populated territories in
Cities with high population densities are, by some, considered to be overpopulated, though the extent to which this is the case depends on factors like quality of housing and infrastructure and access to resources. Most of the most densely-populated cities are in southern and eastern Asia, though Cairo and Lagos in Africa also fall into this category

Слайд 705.1. Human population density
City population is, however, heavily dependent on

Слайд 715.1. Other methods of density measurement
While arithmetic density is the most
Arithmetic (physical) density: The total number of people / area of land (measured in km² or sq miles)
The economic density: The water area and uninhabited lands are excluded.
Physiological density: The total population / area of arable land
Agricultural density: The total rural population / area of agricultural land
Residential density : The number of people living in an urban area / area of residential land
Urban density : The number of people inhabiting an urban area / total area of urban land
Ecological optimum: The density of population which can be supported by the natural resources

Слайд 725.1. Urban and rural population
Division of the population is closely connected
Division of the population on agricultural and not agricultural is much more interesting. Here character of employment is occupied/unoccupied in agriculture and members of their families is considered.
Share of not agricultural population in Russia is 86 %


Слайд 755.2. Sex and age structure
The grouping on a sexual and age
Basis for all age groupings is the population grouping on one-year age groups, is frequent for more compact representation use five years' age groups.
Following age groups are used:
- babies at the age up to 1 year
- children of preschool age from a 1 year till 3 years; from 3 till 7 years
- children of school age from 7 till 13 years (pre-teenager); from 13 to 15; from 15 to 17

Слайд 765.2. Age structure
Following age groups are used:
The population
men in age 16-59 years
women in age 16-54 years
international classification – both sexes in age 15-72 y.
Education age: 7-23 years
Fertility age: women at 15-49 years
Pension age:
women at 55 years and older
men at 60 years and older

Слайд 775.2.Sex ratio
The ratio of males to females by age indicates the

Слайд 785.2. Sexual and age structure
A useful summary of such data is

Слайд 795.2. Sexual and age structure
Bar graphs are a handy way to


Слайд 82Population pyramid
If we were to display these graphs horizontally, make a


Слайд 84Canadian population pyramid
This population pyramid shows at a glance the distribution
You can see that the pyramid narrows toward the top. This is because the death rate is higher among older people than among younger people

Слайд 85Population pyramid
Analyzing population pyramids and identifying trends, we can learn a


Слайд 87Population pyramids
A population pyramid, also called "age pyramid", is a horizontal
Population pyramids

Слайд 885.2. Sexual and age structure
In separate group the able-bodied population –
The population grouping on age helps to solve various problems at definition of a contingent of preschool children, schoolboys, number of able-bodied population and the population is more senior able-bodied age.

Слайд 895.3. Marriage structure
To draw marriage structure we apply the following data:
Middle
In Russia: men – 29, women – 27 years;
Age of marrieds;
Total number of marriages/divorces


Слайд 915.3. Marriage structure
The general ratios of marriage and divorce are the

Слайд 925.3. Marital ratios
1. Marriage ratio, showing the number of marriages per
2. Divorce ratio, showing the number of divorces per 1000 persons within a calendar year. For example, in 2008 in Russia had 8,3 marriages and 5,0 divorces per each 1000 persons of the population

Слайд 935.3. Marriage and divorce
Ratio of marriage instability:
For 2008
number of divorces
number of marriages

Слайд 945. Рopulation structure
The structure of the population according the ethnic nationality
Population distribution on social groups, sources of means of existence is given in the subsequent lectures

Слайд 956. Population reproduction
Population reproduction is a change of one generations by

Слайд 966.1. Studying the natural movement of the population
Change of a population
We study natural movement of the population by means of absolute and relative indicators

Слайд 976.1. Natural movement
Natural movement is characterized by the following absolute indicators:
Number
Number deaths M,
Natural increase or decrease in population: ΔSnat=N - M
These are interval indicators, usually they are calculated for a year

Слайд 986.1. Natural movement
Data across Russia for 2008 (thousand people):
Number of births
Number of deaths 2081,0
Natural decrease -363,5
:Number of births 1717,5Number of deaths 2081,0Natural")
Слайд 996.1. Natural movement
Relative indicators are used estimate the reproduction intensity,
General ratios of population change is the degree of change of average annual population under the influence of separate factors of change, they are calculated as the relation of a corresponding absolute indicator of population change to the average annual population number

Слайд 100The relative indicators of natural movement comprise the following indicators: birth
All ratios, except the viability rate, are expressed in per mil, i.e. per 1000 persons of the population, and the viability rate is defined in percentage (i.e. on 100 persons of the dead population)

Слайд 1016.1.1.Birth rate
shows the number of live births during a year on

Слайд 1026.1.2.Death (mortality) rate
shows the number of deaths during a
 rate shows the number of deaths during a year on average per 1000")
Слайд 1036.1.2. Death rate
First of all, the
10-14 years – 0,5 ‰ и 0,3 ‰
35-39 years – 8,5 ‰ и 2,6 ‰
60-64 years – 39,1 ‰ и 13,7 ‰
70 years and more – 98,6 ‰ и 73,8 ‰

Слайд 1046.1.3.Natural increase rate
shows the size of natural increase (decrease) during a
 during a year on average per")

Слайд 1066.1.4. Viability rate
by V. N. Pokrovsky is the ratio
The Viability rate characterizes population reproduction

Слайд 107The Viability rate shows the coordination of birth and mortality rates,
или

Слайд 1086.1.4. Viability rate
If the viability rate is less than 100%, the
In 2008 for the Russian Federation (in 2005 it was 63,3%, in 2007 – 77,4%):

Слайд 1096.2. Partial and special rates
In addition to general reproduction rates

Слайд 1101. Age fertility rate indicates the number of live births (total,
2. Special fertility rate shows the number of live births on average per 1000 women aged 15 to 49 years
 on")
Слайд 1116.2.Special fertility rate
where:
women at the fertility age, i.e. from 15 to 49 years

Слайд 1126.2.Special fertility rate
There is connection between the general and the special
where – the share of women at the age from 15 to 49 years


Слайд 1144. Total fertility rate depends on the age composition of the
3. Age-specific mortality rate shows the average number of deaths per 1000 population in a given age group.

Слайд 1156.2.1.Повозрастной коэффициент смертности рассчитывается делением числа умерших за соответствующий год в
где
Х – возраст или возрастной интервал, профессия или др.;
Мх – количество умерших в возрасте х;
Sx – средняя численность населения в возрасте х.

Слайд 1166.2.Частные коэффициенты
Любой общий коэффициент можно представить как среднее арифметическое из частных

Слайд 1176.2.Частные коэффициенты
Таким образом, общий коэффициент зависит от частных коэффициентов и структуры

Слайд 1186.2.2.Коэффициент младенческой смертности
Младенец – это ребенок в возрасте до 1 года.

Слайд 1193. Коэффициент младенческой смертности, который вычисляется как сумма двух составляющих (в
– первая – отношение числа умерших в возрасте до одного года из поколения, родившегося в этом году, для которого вычисляется коэффициент, к общему числу родившихся в этом же году;
– вторая – отношение числа умерших в возрасте до одного года из поколения, родившегося в предшествующем году, к общему числу родившихся в предыдущем году.
В 2007 г. этот показатель составлял в нашей стране 9,25‰
:– первая – отношение")
Слайд 1206.2.2.Коэффициент младенческой смертности
Коэффициент младенческой смертности вычисляется как сумма двух составляющих (в
– первая представляет собой отношение числа умерших в возрасте до одного года из поколения, родившегося в этом году, для которого вычисляется коэффициент, к общему числу родившихся в этом же году;
– вторая выражена отношением числа умерших в возрасте до одного года из поколения, родившегося в предшествующем году, к общему числу родившихся в предыдущем году.
:– первая представляет собой")
Слайд 1216.2.2.Коэффициент младенческой смертности
где
N0- число родившихся в прошлом году;
N1- число родившихся в
М0 - число умерших в возрасте до 1 года в данном году из числа родившихся в предыдущем году;
М1 - число умерших в возрасте до 1 года из числа родившихся в данном году.


Слайд 1236.2.2.Коэффициент младенческой смертности
Данные по России за 2008 год:
Умершие в возрасте до
Число детей, умерших в возрасте до одного года, на 1000 родившихся живыми – 8,5

Слайд 1246.2.Специальные коэффициенты
- Коэффициент брачности, показывающий, сколько браков приходится на 1000 человек
- Коэффициент разводимости, показывающий, сколько разводов приходится на каждую тысячу населения в течение календарного года
- Возрастной коэффициент рождаемости показывает число родившихся в среднем на 1000 женщин каждой возрастной группы

Слайд 1257. Изучение миграции населения
Перемещение населения по территории называется механическим движением населения
миграция
внутренняя
(внутри страны)
внешняя
(за пределы страны)

Слайд 127Анализ данных о миграции показывает, куда, откуда и в каком количестве

Слайд 128Миграция населения изучается с помощью абсолютных и относительных показателей.
К абсолютным показателям
1. Число прибывших в данный населенный пункт (П).
2. Число выбывших из данного населенного пункта (В).
3. Механический прирост населения (МП = П – В)

Слайд 129Абсолютные показатели по России за 2008 г.
1. Число прибывших 281614 чел.
2.
3. Механический прирост 242109

Слайд 130К относительным показателям относятся коэффициент прибытия, коэффициент выбытия и коэффициент механического
Приведенные ниже коэффициенты вычисляются в промилле,
т. е. на 1000 человек населения

Слайд 131Коэффициент прибытия показывает, сколько человек прибывает в данный регион в среднем

Слайд 1327.Таблицы смертности
Another summary is called the life table. For a cohort of persons born
Подробное изучение процессов воспроизводства осуществляется с помощью таблиц смертности [1]. Они строятся для одного условного поколения (родившихся в одном году) на основе повозрастных коэффициентов смертности и показывают, как постепенно с увеличением возраста оно выбывает под влиянием смертности, т.е. показывает порядок вымирания этого поколения.
В таблице смертности показывается изменение численности условного поколения при переходе от возраста к возрасту только под влиянием смертности. Расчет показателей таблицы смертности основан на том, что на всем протяжении жизни изучаемого поколения уровень смертности в отдельных возрастных группах будет соответствовать реальному уровню смертности на момент составления таблицы.
[1] В зарубежной статистике они также называются таблицами продолжительности жизни и таблицами жизни (франц.-tableaux de mortalité, англ.-life tables).

Слайд 133Ожидаемая продолжительность жизни при рождении – один из важнейших показателей, рассчитываемых

Слайд 1348. Расчет перспективной численности населения
В промежутках между переписями численность населения отдельных
Численность населения на начало года + Число родившихся за год + Число прибывших за год – Число умерших за год – Число выехавших за год = Численность населения на конец года

Слайд 135Для планирования многих народно-хозяйственных показателей очень важно знать численность населения на
Ожидаемая продолжительность жизни россиянина в 2010 году должна составить 68,5 лет


Слайд 137Перспективная численность населения рассчитывается на основе данных о естественном и механическом

Слайд 138Коэффициент общего прироста населения (КО.П) рассчитывается следующим образом:
КО.П = Крожд –
 рассчитывается следующим образом:КО.П = Крожд – Ксм + Кпр –")
Слайд 139где Нn – численность населения на начало планируемого периода;
t – число
КО.П – коэффициент общего прироста населения
Перспективная численность населения определяется по формуле
,

Слайд 140Также возможен расчет перспективной численности населения с помощью среднегодового абсолютного прироста
или

Слайд 141Возможны более сложные расчеты перспективной численности населения – методом экстраполяции по