- Главная
- Разное
- Дизайн
- Бизнес и предпринимательство
- Аналитика
- Образование
- Развлечения
- Красота и здоровье
- Финансы
- Государство
- Путешествия
- Спорт
- Недвижимость
- Армия
- Графика
- Культурология
- Еда и кулинария
- Лингвистика
- Английский язык
- Астрономия
- Алгебра
- Биология
- География
- Детские презентации
- Информатика
- История
- Литература
- Маркетинг
- Математика
- Медицина
- Менеджмент
- Музыка
- МХК
- Немецкий язык
- ОБЖ
- Обществознание
- Окружающий мир
- Педагогика
- Русский язык
- Технология
- Физика
- Философия
- Химия
- Шаблоны, картинки для презентаций
- Экология
- Экономика
- Юриспруденция
Wildfire hazard презентация
Содержание
- 1. Wildfire hazard
- 2. Assessing the wildfire hazard in Canada
- 3. Drought Code (fuel flamma-bility)
- 4. Buildup Index = Fuel availability August normals
- 5. Fire Weather Index
- 6. Fire Weather Index August normals
- 7. Rate of spread (fuel, wind, topo-graphy) August normals
- 8. Head Fire Intensity = energy output (how hard is it to suppress?)
- 9. Critical factors in wildfire hazard in coniferous
- 10. Critical factors in wildfire hazard in coniferous
- 11. BC fire history (1996-2006) Data: http://www.bcwildfire.ca/History/average.htm
- 12. Lightning fires 2003 British Columbia: 2003 fire season Fire Danger: 25 Aug. 2003
- 13. Fires in BC and adjacent areas, Aug.
- 14. OK Mountain Park Fire Discovered: August 16
- 15. Direct damage: homes ablaze in Kelowna suburbs
- 16. Recent major fires in BC Lonesome Lake
- 17. Fire management in BC Risk assessment: >200
- 18. Fire bombers: water vs. retardant Okanagan
- 19. Southern California wildfires (October, 2003) Causes: Persistent
- 20. Wildfire hazards: Sydney, December 2001
- 21. Wildfire hazards (all photos taken from
- 22. Homes in fire-prone areas building a fire-resistant
- 23. A defensible site Slope: Flames traveling
- 24. A defensible house Roofs may be ignited
- 25. Fire and slope stability
- 26. Other weather-related hazards Frost hollows Fog Hail Cold spells Blizzards Freezing rain
- 27. Frost and fog hollows outgoing LW
- 28. Frost hollows as crop hazards: Okanogan County, WA. fan in orchard
- 29. Braking distances increase by a factor of
- 30. Advection fog ocean
- 31. Advection fog bank, southern Oregon
- 32. Fog formation by advection, Pacific Northwest coast
- 33. Fog incidence
- 34. Fog and road accidents Feb. 12,
- 35. Fog and aircraft safety Fog can cause
- 36. Hail incidence (days/year) Note differences between this
- 37. Hail formation Feeder clouds Supercell anvil -10°C
- 38. Hail formation: feeder clouds and double-vortex
- 39. Hailstorms, west Texas Flooding as a result of hailstorms e.g. “Isaac’s Storm”
- 40. Hailstones and hail damage
- 41. Hail damage Severe incidents Denver, COL --
- 42. Hail suppression Based on the concept that
- 43. Hail suppression logistics Seeding locations --
- 44. Results of hail suppression N. Dakota: 45%
- 45. Winter hazards Thermal: human discomfort and
- 46. Frost hazards 180 d >6 months w/ frost
- 47. Hypothermia Cold exposure results in vascorestriction of
- 48. Wind chill factor Until 2001, the Siple-Passel
- 49. New wind chill equation In 2001 Environment
- 52. Winter hazards: property damage e.g. State Farm
- 53. Orographic Orographic Frontal
- 54. “Snow belts”
- 55. Blizzard hazards e.g. 1997 blizzard in southern
- 56. Costs of snow - Surrey, BC
- 57. Snow-clearing costs I City
- 58. Snow-clearing costs II Montreal has 72 ploughs,
- 59. Insurance costs In January 1993, a relatively
- 60. Freezing rain Major ice storms in recent
- 61. The geography of the 1998 ice storm Up to 40mm in Maritimes
- 62. The 1998 ice storm: >1300 hydro towers and 40,000 hydro poles damaged
- 63. Ice storm climatology mT
- 64. The 1998 ice storm # of customers
- 65. Ice storm tally (Canada only) Insurance claims
Слайд 1
Wildfire hazard
Climatic regime:
seasonal drought
Current weather:
rainfall, lightning,
atmospheric humidity
Vegetation


")


August normals")
")
Слайд 9Critical factors in wildfire hazard in coniferous forests:
1. antecedent precipitation
dry
< 1.5 mm
canopy interception
wet fuel
>> 1.5 mm
canopy
drip
evaporates

Слайд 10Critical factors in wildfire hazard in coniferous forests: 2. humidity of
fuel dries out
RH < 60%
fuel absorbs moisture
RH > 60%

Data: http://www.bcwildfire.ca/History/average.htm")


Слайд 14OK Mountain Park Fire
Discovered: August 16
August 25: 19,400 hectares
Notes:

Слайд 15Direct damage: homes ablaze in Kelowna suburbs
Indirect damage: particulates and human
Smoke in Okanagan valley, Aug. 2003

Слайд 16Recent major fires in BC
Lonesome Lake fire (S. Tweedsmuir Park) (2004):
20,900
Salmon Arm fire (1998):
6000 ha burned; 7000 people evacuated; 40 buildings destroyed; $10M to extinguish
Penticton fire (1994):
5500 ha burned; 3500 people evacuated; 18 buildings destroyed
Eg fire (1982):
Near Liard R., Alaska Highway - 180,000 ha burned
 (2004):20,900 ha burnedSalmon Arm fire")
Слайд 17Fire management in BC
Risk assessment:
>200 weather stations reporting on fire hazard;
Entire
Prevention:
e.g. education, thinning, prescribed fires
Control:
e.g. rap-attack crews; air tankers; fire retardants
Budget: $55M (exceeded in 2003 by mid-August)

Слайд 18Fire bombers:
water vs. retardant
Okanagan Mtn. Fire (Aug. 22, 2003)
Retardants (a
Retardants (a mix of salt, fertilizer")
Слайд 19Southern California wildfires (October, 2003)
Causes:
Persistent drought
Santa Ana winds
Volative native and exotic
Damages:
~300 000 ha. burnt
22 deaths
3570 homes destroyed
Causes:Persistent droughtSanta Ana windsVolative native and exotic vegetationDamages:~300 000 ha. burnt22")

Слайд 21Wildfire hazards
(all photos taken from Sydney Morning Herald, Dec. 2001)
1.
2. Damage to property
3. Damage to
health
1. Damage to forest economies")
Слайд 22Homes in fire-prone areas
building a fire-resistant home, and
developing “defensible space” around
There is increasing residential sprawl into the “wildland-urban interface” and federal, provincial and state forest services in affected areas are reconsidering forest fire-fighting tactics in these WUI areas.
Homeowners in these areas are urged to adopt “firesmart” practices. These include:

Слайд 23A defensible site
Slope: Flames traveling up a 30% slope are
Aspect: S and SW-facing slopes are drier, and therefore more fire-prone than N and NE slopes (in N. hemisphere).
Forest type: Tall forest with dense underbrush and thick fuel accumulations on the forest floor are more hazardous than open forest with grassland.
Ease of access and egress: roads and fire-proof bridges.

Слайд 24A defensible house
Roofs may be ignited by firebrands; use fire-resistant materials
Walls may be ignited by heat from flames; use fire-resistant siding and deck supports; keep windows and vents small, and block in event of forest fire.
Clear trees and shrubs from 10m zone around house. Create a fire break by irrigating this area.
Build pond for emergency water supply.

Слайд 25Fire and slope stability
El Niño
(1997-8) (1998-9) (summer 1999*) (winter ‘99)
* in the summer of 1999 x2 average acreage burned in S. California
slides and mudflows
hydrophobic layer
S. California
What would be the pattern in the eucalypt
forests of New South Wales?


Слайд 27Frost and fog hollows
outgoing LW on calm, clear nights in late
cold air drains
into valleys
T° below freezing? T° below dewpoint?
= frost /glare ice = ‘radiation’ fog


Слайд 29Braking distances increase by a factor of ~10 on black (glare)
Frost hollows
as traffic hazards
 ice data from California")


Слайд 34Fog and road accidents
Feb. 12, 1996: 12 killed, 100 injured in
Feb. 12, 1998: 4 killed, “dozens injured” in a 250-vehicle crash in dense fog on freeway near Padua.
Nov. 25, 1995: 1 killed, “dozens injured” in two pile-ups involving 130 vehicles in dense fog on I-5 freeway near San Diego.
Visibility <10m.

Слайд 35Fog and aircraft safety
Fog can cause flight delays, cancellations, and accidents.
New technology (“Fog Buster”) allows pilots to takeoff in <100m visibility, and land in <200m visibility.
")
Слайд 36Hail incidence (days/year)
Note differences between this map and that of thunderstorm
Note differences between this map and that of thunderstorm distribution (severe storms lecture)")
Слайд 37Hail formation
Feeder clouds
Supercell
anvil
-10°C
embryo
ice pellets
form
-50°C
all droplets
are solid ice

Слайд 38
Hail formation: feeder clouds and double-vortex thunderstorm
-50°C
-10°C
0°C
supercooled water
droplets
embryo
hail
rain
hail
strong
updraft


Слайд 41Hail damage
Severe incidents
Denver, COL -- US$625M insurance costs for damage from
Calgary, AL --US$400M (Sept., 7, 1991)
Annual costs of hail damage (mainly to crops) in Alberta in early 1980’s ~US$100M. Urban damage now commonly exceeds agricultural damage.

Слайд 42Hail suppression
Based on the concept that there are insufficient ice nuclei

Слайд 43
Hail suppression logistics
Seeding locations -- in vicinity of strongest updrafts; either

Слайд 44Results of hail suppression
N. Dakota: 45% reduction in hail insurance claims
Alberta (1980-85): 20% reduction in crop losses - some of the reduction due to climate change? Program cancelled, but new project now underway (1999-2004).
Greece (1984-88): 52% reduction in number of hailstones, 34% reduction in maximum hail size, and 74% reduction in hail impact energy. Insurance losses in suppression area declined by 18-59%.
 compared to a")
Слайд 45Winter hazards
Thermal:
human discomfort and disease
heating costs (10% of Swedish GNP!)
damage
Precipitation: blizzards, freezing rain
 damage to")

Слайд 47Hypothermia
Cold exposure results in vascorestriction of blood vessels, restricting flow of
When deep body temperature falls below 35°C thermal control is lost. Death occurs when deep body temperature falls below 26°C

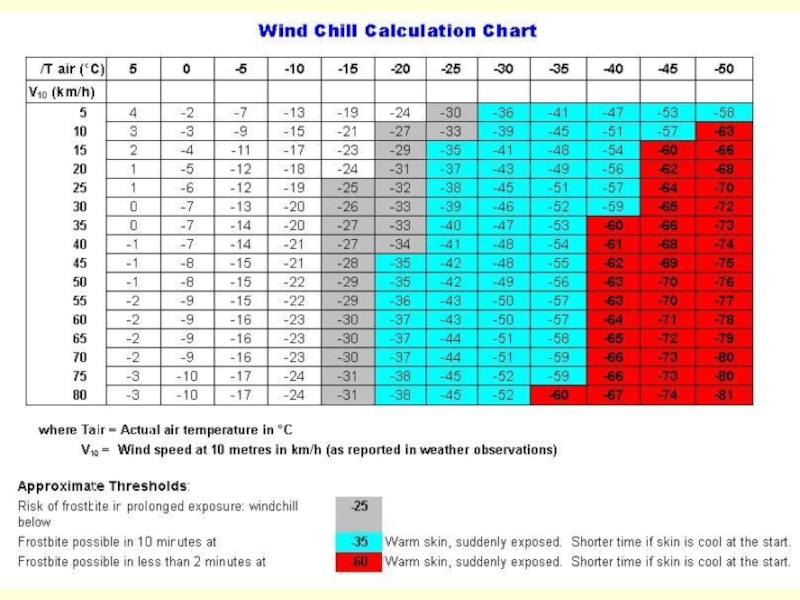
Слайд 48Wind chill factor
Until 2001, the Siple-Passel formula was used in North
H = (SQRT [100V] +10.45-V) x (33-Ta)
where H is the rate of heat loss (W/m2/min); V is the wind speed in m/s, and Ta is the air temperature.
H ranges from 50-2500.
H>1400 frostbite on exposed skin surfaces.
H>2300 frostbite within 30 seconds.

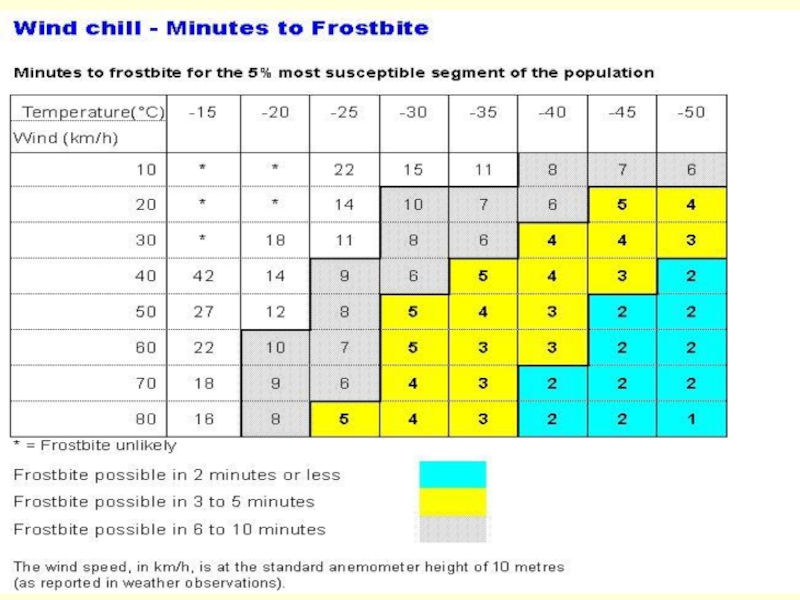
Слайд 49New wind chill equation
In 2001 Environment Canada and the US National
W = 13.12 + 0.6215 x T- 11.37 x V0.16+ 0.3956T x V0.16
where
W is the wind chill index (intended to represent temperature sensation, not a ‘real’ temperature);
T is the air temperature in degrees Celsius (°C), and
V is the wind speed at 10 metres (standard anemometer height), in kilometres per hour (km/h).

Слайд 52Winter hazards:
property damage
e.g. State Farm Insurance paid out $4M in house
Freeze-thaw damage to roads, bridges,
buildings*, etc.
Salt damage to vehicles/ environment


Слайд 55Blizzard hazards
e.g. 1997 blizzard in southern BC (~60 cm of snow
Traffic accidents
Road closures
Airport closures
Power blackouts
Lost productivity
Maclean’s (January 13, 1997)


Слайд 57Snow-clearing costs I
City Snowfall
(cm) (km) (km) 1993
*costs $300K/cm of snow!
*
")
Слайд 58Snow-clearing costs II
Montreal has 72 ploughs, 47 loaders. 68 blowers (@$250K
Winnipeg (like all Canadian cities) has a snow-clearing strategy to reduce costs: ≤3 cm - clear major roads only; ~5 cm - city core cleared; ≥15 cm - residential streets cleared
, 100 sanding trucks,")
Слайд 59Insurance costs
In January 1993, a relatively snow-free month, 5200 auto insurance
In January 1994, heavy snowfalls resulted in 7600 claims and payouts of $19M.

Слайд 60Freezing rain
Major ice storms in recent Canadian history:
Montréal (1942) -- 39
Montréal (1961) -- 30 mm in 2 days
St. John’s, Nfld (1984) -- 150 mm in four days
Ottawa (1986) -- 30 mm in 2 days
Montréal (1998) -- 80 mm in 6 days
Newfoundland (2002) -- 12 mm in 1 day
 -- 39 mm in 2 daysMontréal")


Слайд 64The 1998 ice storm
# of customers without power
CANADA
Qué: 1.4M
Ont: 230K
New
Nova Scotia: 20K
USA
Maine: 315K
New Hamp: 68K
New York: 130K
Vermont: 33K
Grand total = 2.22M;
Many people in Québec without power for >4 weeks

Слайд 65Ice storm tally (Canada only)
Insurance claims - $500M
Repair and construction:
Hydro-Québec -
Lost economic output - $1.6B
16,000 Canadian troops mobilized; 440 shelters opened
Deaths: 25
Insurance claims - $500MRepair and construction: Hydro-Québec - $500M Ontario Hydro")