- Главная
- Разное
- Дизайн
- Бизнес и предпринимательство
- Аналитика
- Образование
- Развлечения
- Красота и здоровье
- Финансы
- Государство
- Путешествия
- Спорт
- Недвижимость
- Армия
- Графика
- Культурология
- Еда и кулинария
- Лингвистика
- Английский язык
- Астрономия
- Алгебра
- Биология
- География
- Детские презентации
- Информатика
- История
- Литература
- Маркетинг
- Математика
- Медицина
- Менеджмент
- Музыка
- МХК
- Немецкий язык
- ОБЖ
- Обществознание
- Окружающий мир
- Педагогика
- Русский язык
- Технология
- Физика
- Философия
- Химия
- Шаблоны, картинки для презентаций
- Экология
- Экономика
- Юриспруденция
THE STATE OF SOCIAL VIDEO презентация
Содержание
- 1. THE STATE OF SOCIAL VIDEO
- 2. THE RISE OF FACEBOOK VIDEO The
- 3. TIMELINE OF VIDEO PLATFORMS FOR BRANDS On
- 4. FACEBOOK VS. YOUTUBE - INTERACTIONS Native
- 5. SHARE OF INTERACTIONS ON VIDEO POSTS
- 6. MEDIA / PUBLISHER VIDEO POSTS Media
- 7. MEDIA / PUBLISHER TOTAL INTERACTIONS Media &
- 8. YOUTUBE TOP PERFORMERS YouTube is still a
- 9. YOUTUBE TOP PERFORMERS Nike Football nearly doubled
- 10. YOUTUBE – OVERALL UPLOADS AND VIEWS Interactions
- 11. 71 % 14 % 6 % 5
- 12. FACEBOOK VIDEO – PROMOTED POSTS In January
- 13. INTERACTIONS ON VIDEO POSTS Facebook videos
- 14. ORGANIC REACH BY POST TYPE ON FACEBOOK
- 15. BRANDS ARE ADJUSTING GoPro was posting videos
- 16. PUBLISHERS ARE ADJUSTING BuzzFeed adopted native
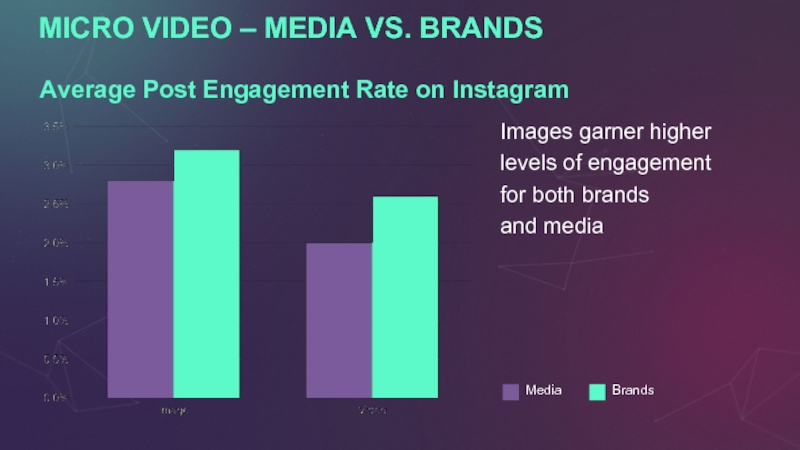
- 17. MICRO VIDEO – MEDIA VS. BRANDS Instagram
- 18. MICRO VIDEO – MEDIA VS. BRANDS Images
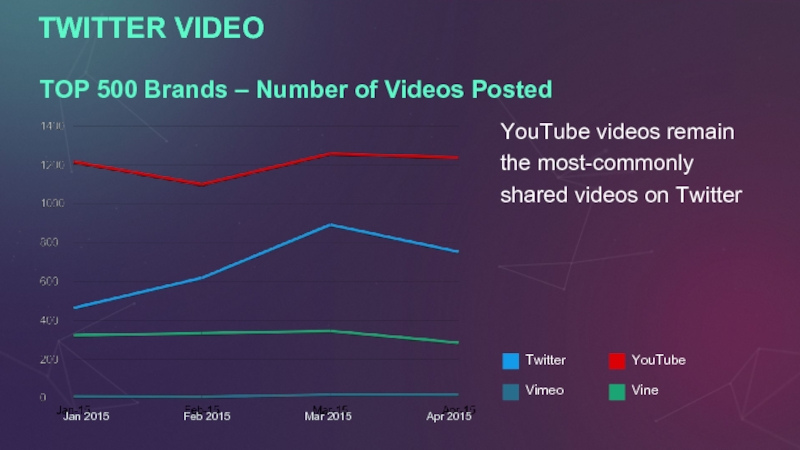
- 19. TWITTER VIDEO YouTube videos remain the most-commonly
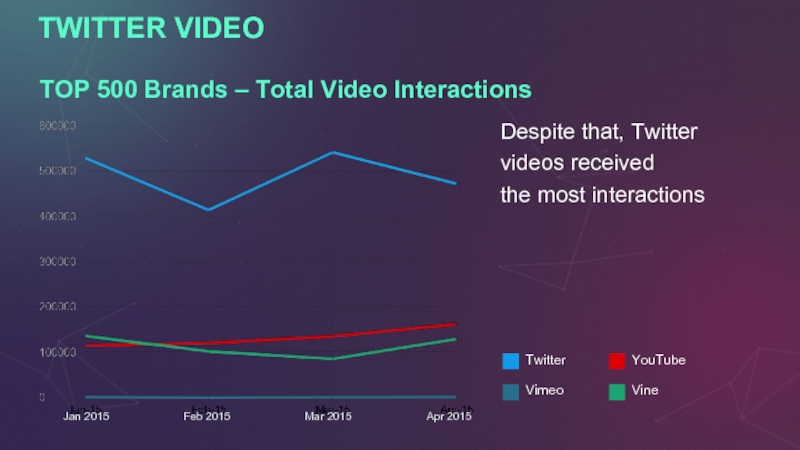
- 20. TWITTER VIDEO Despite that, Twitter videos received
- 21. THANK YOU! #Engage2015
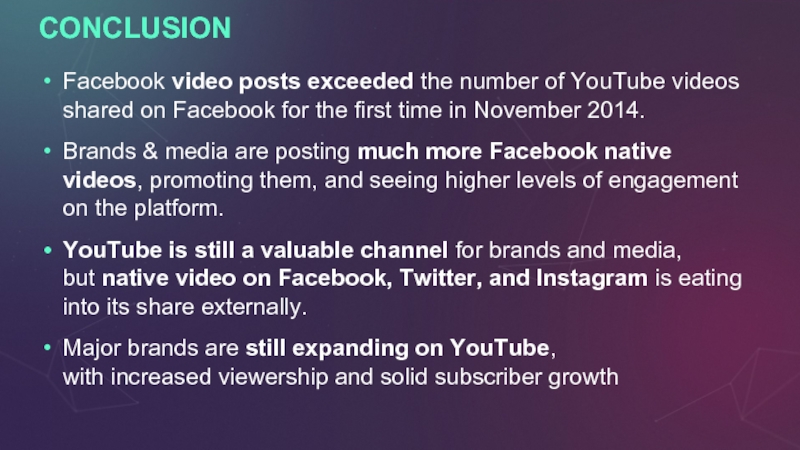
- 22. CONCLUSION Facebook video posts exceeded the number
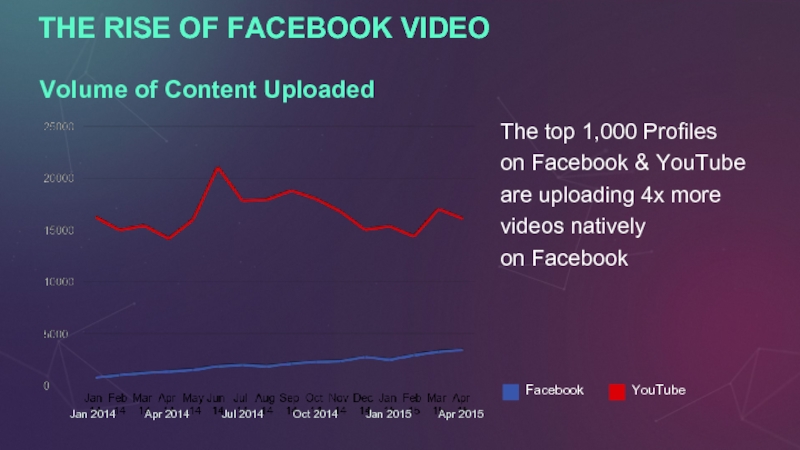
Слайд 2THE RISE OF FACEBOOK VIDEO
The top 1,000 Profiles
on Facebook
Volume of Content Uploaded
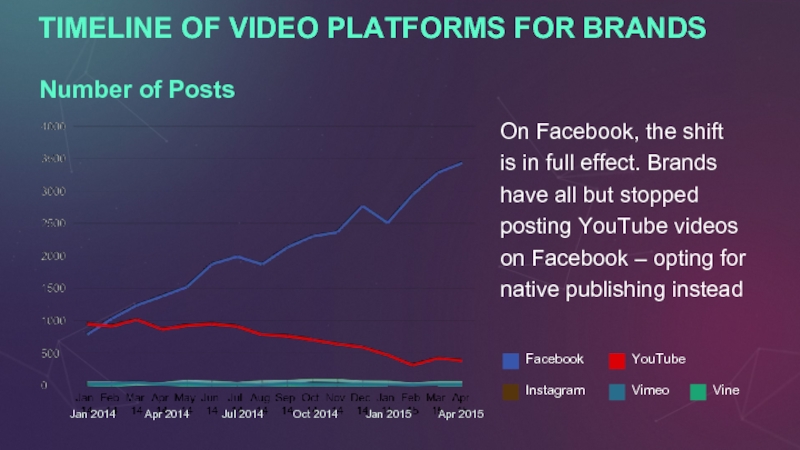
Слайд 3TIMELINE OF VIDEO PLATFORMS FOR BRANDS
On Facebook, the shift
is in
Number of Posts
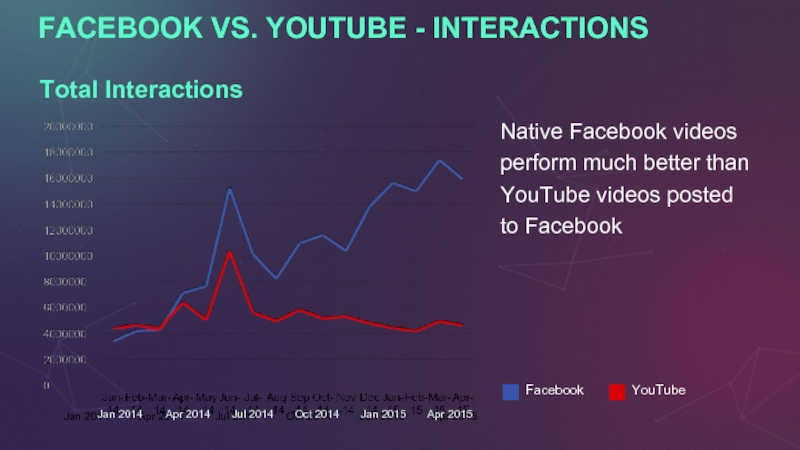
Слайд 4FACEBOOK VS. YOUTUBE - INTERACTIONS
Native Facebook videos perform much better
Total Interactions
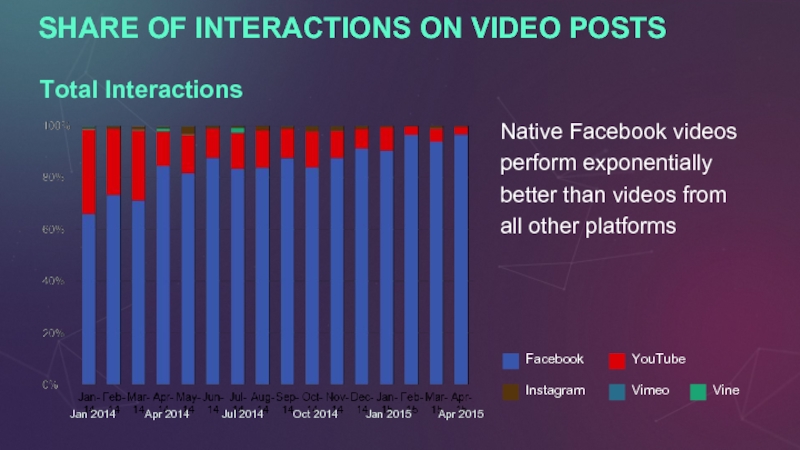
Слайд 5SHARE OF INTERACTIONS ON VIDEO POSTS
Native Facebook videos perform exponentially
Total Interactions
Слайд 6MEDIA / PUBLISHER VIDEO POSTS
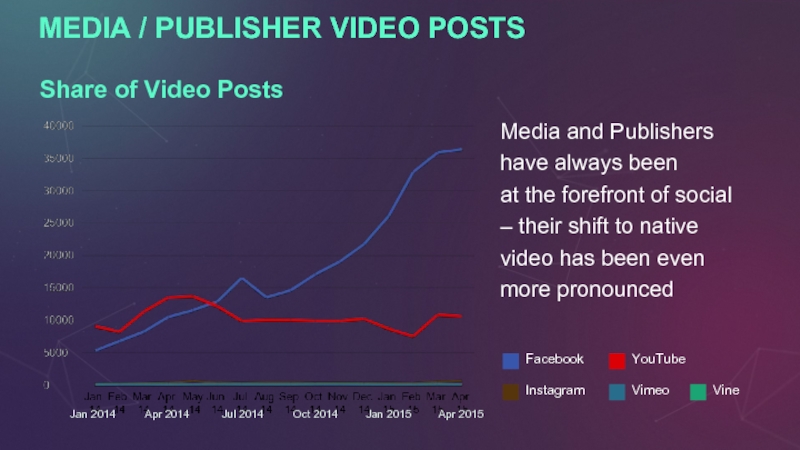
Media and Publishers have always been
Share of Video Posts
Слайд 7MEDIA / PUBLISHER TOTAL INTERACTIONS
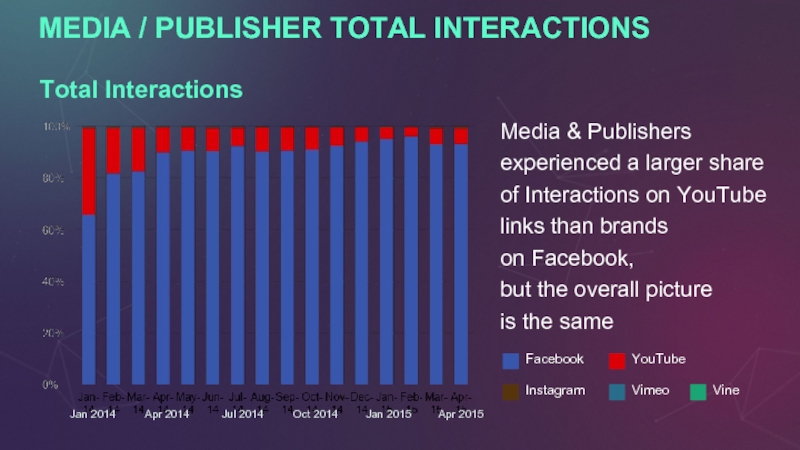
Media & Publishers experienced a larger share
Total Interactions
Слайд 8YOUTUBE TOP PERFORMERS
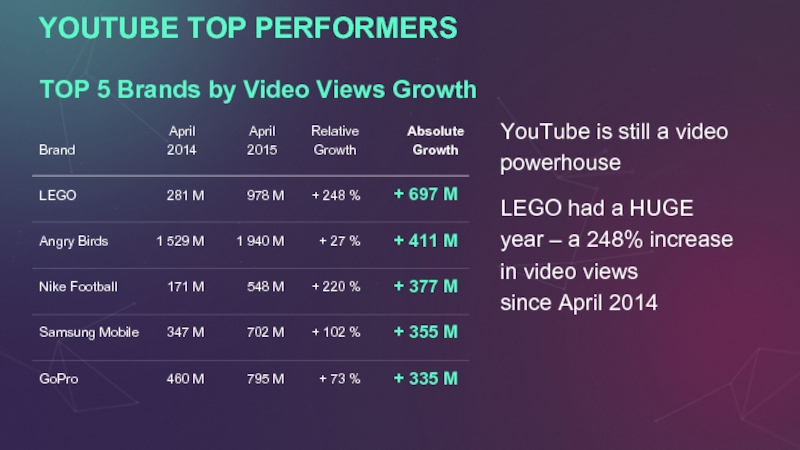
YouTube is still a video powerhouse
LEGO had a HUGE
TOP 5 Brands by Video Views Growth
Brand
April
2014
April
2015
Absolute
Growth
Relative
Growth
LEGO
Angry Birds
Nike Football
Samsung Mobile
GoPro
281 M
1 529 M
171 M
347 M
460 M
978 M
1 940 M
548 M
702 M
795 M
+ 697 M
+ 411 M
+ 377 M
+ 355 M
+ 335 M
+ 248 %
+ 27 %
+ 220 %
+ 102 %
+ 73 %
Слайд 9YOUTUBE TOP PERFORMERS
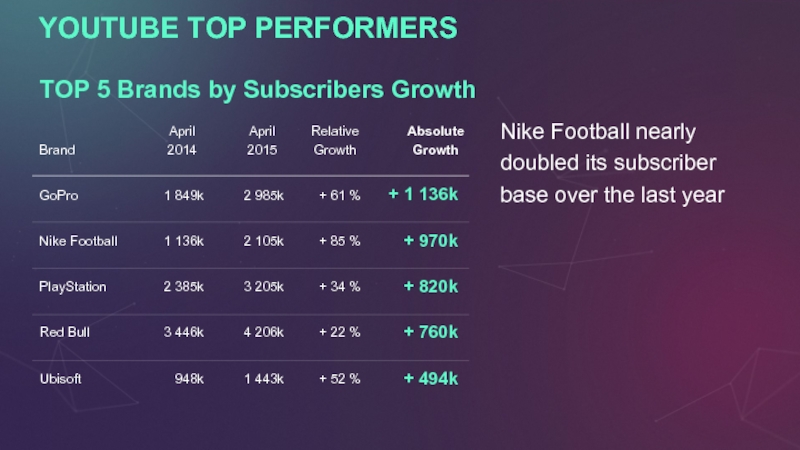
Nike Football nearly doubled its subscriber base over the
TOP 5 Brands by Subscribers Growth
Brand
April
2014
April
2015
Absolute
Growth
Relative
Growth
GoPro
Nike Football
PlayStation
Red Bull
Ubisoft
1 849k
1 136k
2 385k
3 446k
948k
2 985k
2 105k
3 205k
4 206k
1 443k
+ 1 136k
+ 970k
+ 820k
+ 760k
+ 494k
+ 61 %
+ 85 %
+ 34 %
+ 22 %
+ 52 %
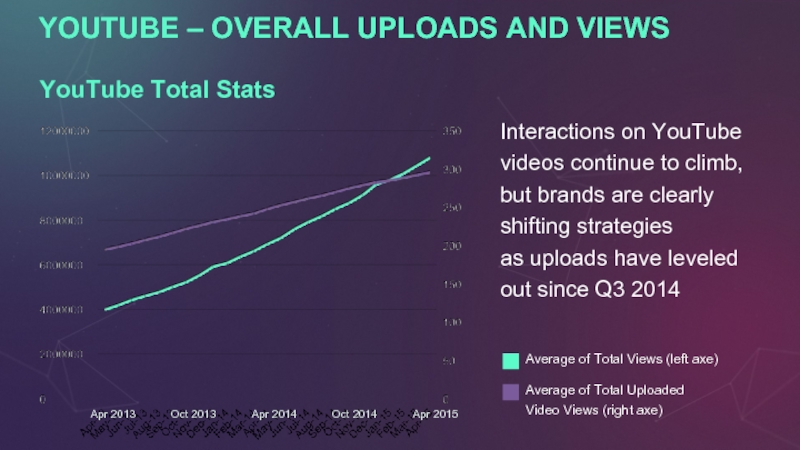
Слайд 10YOUTUBE – OVERALL UPLOADS AND VIEWS
Interactions on YouTube videos continue to
YouTube Total Stats
Average of Total Uploaded
Video Views (right axe)
Average of Total Views (left axe)
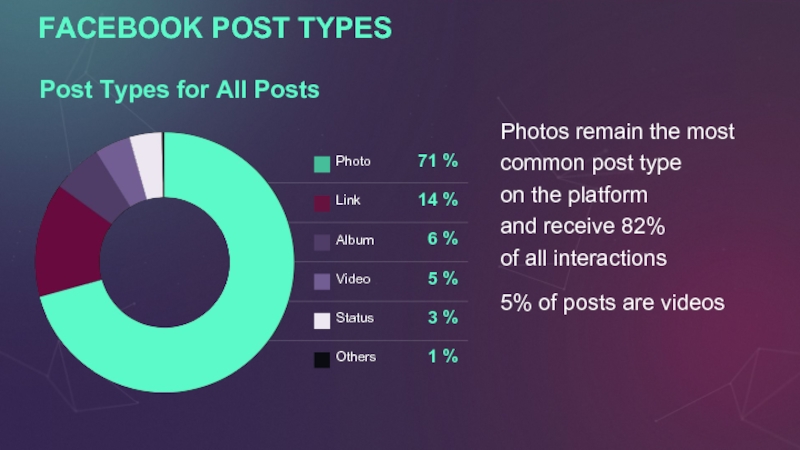
Слайд 1171 %
14 %
6 %
5 %
3 %
1 %
Photo
Link
Album
Video
Status
Others
FACEBOOK POST TYPES
Photos remain the
5% of posts are videos
Post Types for All Posts
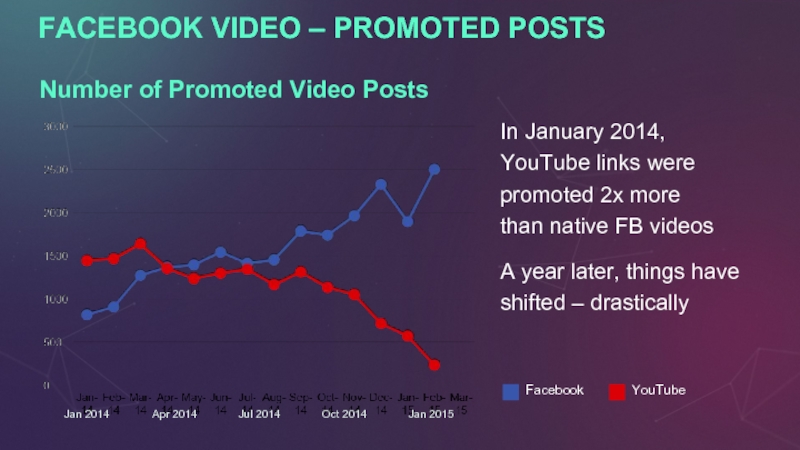
Слайд 12FACEBOOK VIDEO – PROMOTED POSTS
In January 2014, YouTube links were promoted
A year later, things have shifted – drastically
Number of Promoted Video Posts
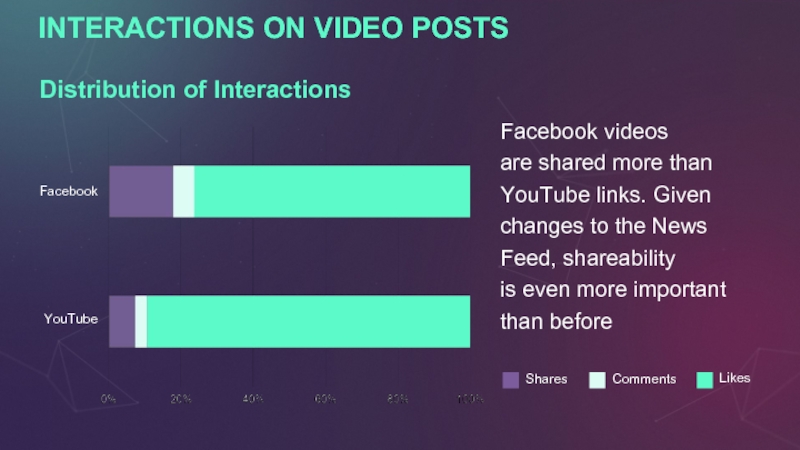
Слайд 13INTERACTIONS ON VIDEO POSTS
Facebook videos
are shared more than YouTube links.
Distribution of Interactions
Facebook
YouTube
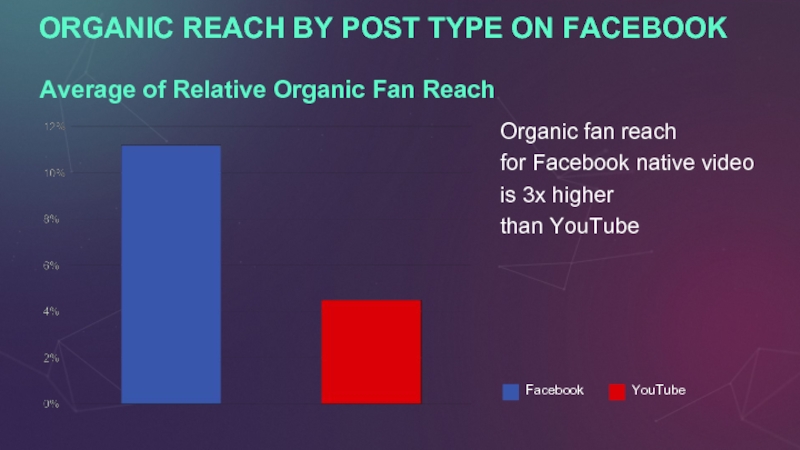
Слайд 14ORGANIC REACH BY POST TYPE ON FACEBOOK
Organic fan reach
for Facebook
Average of Relative Organic Fan Reach
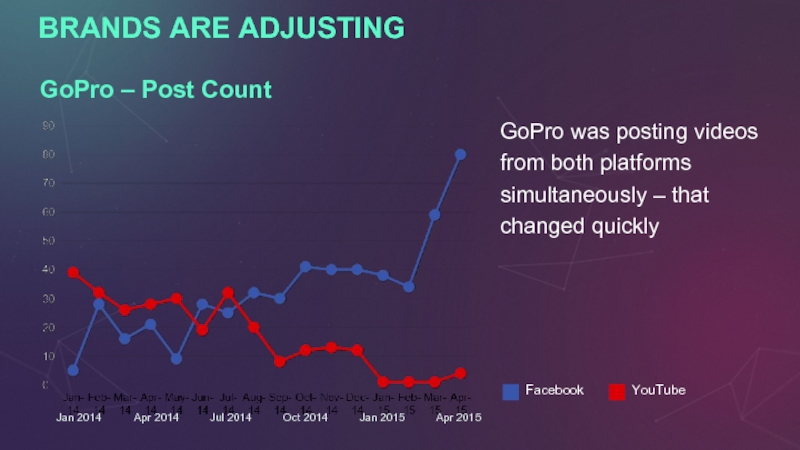
Слайд 15BRANDS ARE ADJUSTING
GoPro was posting videos from both platforms simultaneously –
GoPro – Post Count
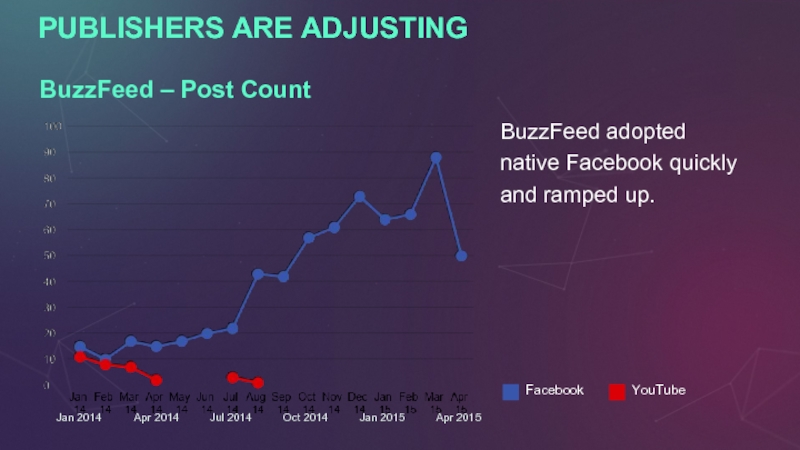
Слайд 16PUBLISHERS ARE ADJUSTING
BuzzFeed adopted
native Facebook quickly and ramped up.
BuzzFeed –
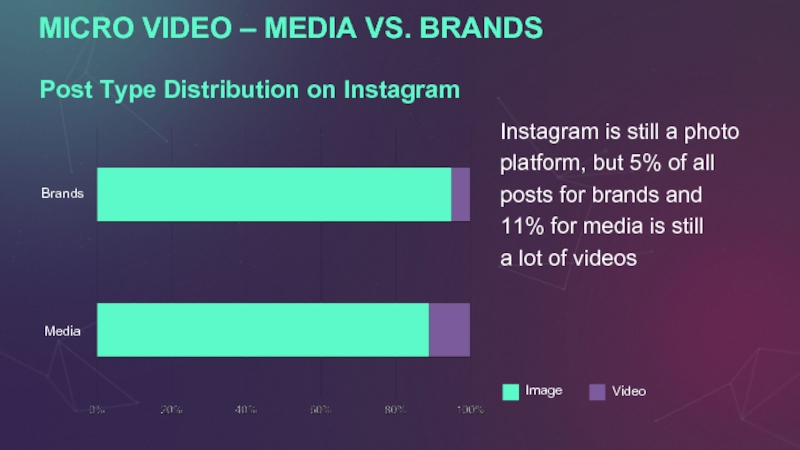
Слайд 17MICRO VIDEO – MEDIA VS. BRANDS
Instagram is still a photo platform,
Post Type Distribution on Instagram
Brands
Media
Слайд 18MICRO VIDEO – MEDIA VS. BRANDS
Images garner higher levels of engagement
Average Post Engagement Rate on Instagram
Слайд 19TWITTER VIDEO
YouTube videos remain the most-commonly shared videos on Twitter
TOP 500
Слайд 20TWITTER VIDEO
Despite that, Twitter videos received
the most interactions
TOP 500
Слайд 22CONCLUSION
Facebook video posts exceeded the number of YouTube videos shared on
Brands & media are posting much more Facebook native videos, promoting them, and seeing higher levels of engagement on the platform.
YouTube is still a valuable channel for brands and media, but native video on Facebook, Twitter, and Instagram is eating into its share externally.
Major brands are still expanding on YouTube, with increased viewership and solid subscriber growth
