- Главная
- Разное
- Дизайн
- Бизнес и предпринимательство
- Аналитика
- Образование
- Развлечения
- Красота и здоровье
- Финансы
- Государство
- Путешествия
- Спорт
- Недвижимость
- Армия
- Графика
- Культурология
- Еда и кулинария
- Лингвистика
- Английский язык
- Астрономия
- Алгебра
- Биология
- География
- Детские презентации
- Информатика
- История
- Литература
- Маркетинг
- Математика
- Медицина
- Менеджмент
- Музыка
- МХК
- Немецкий язык
- ОБЖ
- Обществознание
- Окружающий мир
- Педагогика
- Русский язык
- Технология
- Физика
- Философия
- Химия
- Шаблоны, картинки для презентаций
- Экология
- Экономика
- Юриспруденция
Students, Computersand Learning:making the connection презентация
Содержание
- 1. Students, Computersand Learning:making the connection
- 2. The kind of things that are easy
- 3. Changes in the demand for skills
- 4. Robotics
- 5. Google Autonomous Vehicle >1m km, one minor accident, occasional human intervention
- 6. Augmented Reality
- 7. A lot more to come 3D printing Synthetic biology Brain enhancements Nanomaterials Etc.
- 8. The Race between Technology and Education
- 9. Digital skills of 15-year-olds
- 18. Strong performance in
- 19. Countries doing better/worse in digital literacy
- 20. Overall browsing activity Average rank of students
- 21. Classification of students based on their overall
- 22. Think, then click: Task-oriented browsing Average rank
- 23. Classification of students based on the quality
- 24. Explained variation in the digital reading performance
- 25. Relationship between digital reading performance and navigation
- 26. Strong performance in
- 27. Relative success on mathematics tasks that require
- 28. Young adults (16-24 year-olds) All adults
- 29. Students’ use of computers
- 30. Access to computers at home Source: Figure 1.1 %
- 31. Access to computers at home: Change between
- 32. Internet access at home (PISA 2012) Source: Figure 1.2 %
- 33. Internet access at home: Change between 2009
- 34. Bridging the social divide
- 35. Access to the Internet at home and
- 36. Early exposure to computers % of students
- 37. Early exposure to computers, by gender %
- 38. Percentage of students with access to the
- 39. Common computer leisure activities outside of school,
- 40. Relationship among analogue skills, socio-economic status, and
- 41. Time online
- 42. Time spent on line in school and
- 43. Feeling lonely at school, by time spent
- 44. Students arriving late for school, by time
- 45. Technology in teaching and learning
- 46. Number of students per school computer (PISA
- 47. Number of students per school computer: Change
- 48. Number of students per school computer Magnified Students per computer Source: Figure 2.14
- 49. Number of students per school computer: Change
- 50. Use of computers at school` Percentage of
- 51. Use of ICT at school % of
- 52. Use of ICT at school % of
- 53. Index of ICT use at school Source: Figure 2.3 Mean index
- 54. Change between 2009 and 2012 in the
- 55. Students and teachers using computers during mathematics
- 56. Relationship between the change in ICT use
- 57. Relationship between computer use in mathematics lessons
- 58. Computer use and learning outcomes
- 59. Number of computers available to students and expenditure on education 0 Source: Figure 6.1
- 60. Trends in mathematics performance and increase in
- 61. Trends in mathematics performance and increase in
- 62. Students who use computers at school only
- 63. Source: Figure 6.5 Students who use computers
- 64. Frequency of computer use at school and
- 65. Performance in digital reading, by frequency of
- 66. Students who do not use computers in
- 67. Computer use in mathematics lessons and performance
- 68. Digital reading performance, by index of ICT
- 69. Frequency of computer use outside of school
- 70. Students who use computer outside of school
- 71. Digital reading performance, by index of ICT
- 72. Frequency of ICT use outside of school
- 73. Teaching practices and computer use in math lessons (OECD average) Mean index Source: Figure 2.19
- 74. Students who use computer outside of school
- 75. Mean mathematics performance, by school location, after
- 76. Mean mathematics performance, by school location, after
- 77. Mean mathematics performance, by school location, after
- 78. The potential of technology To gain the
- 79. Expand access to content As specialised
- 80. Experiential learning E.g. remote and virtual labs,
- 81. Mobilise innovation
- 82. Education is a heavily personalised service, so
- 83. Some new developments seem to be more
- 84. Make costs and benefits of educational innovation
- 85. Given the uncertainties that accompany change, education
- 86. Thank you Find
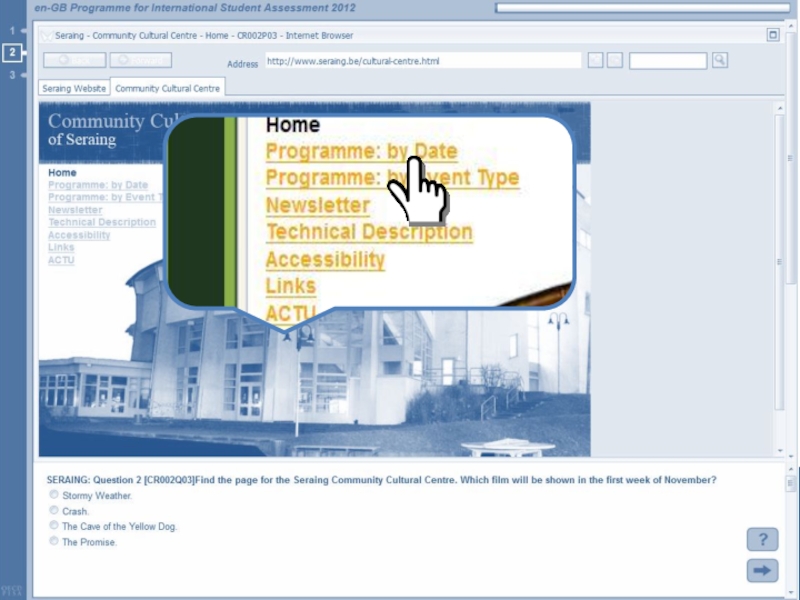
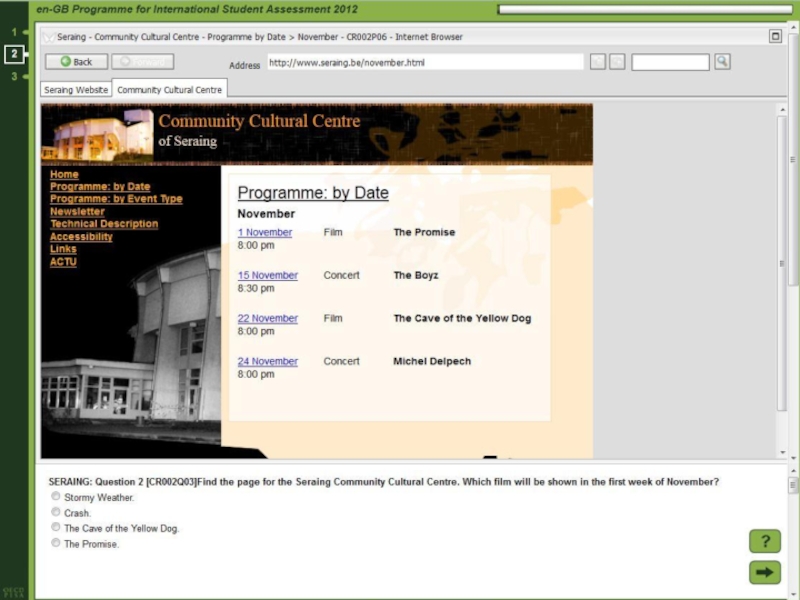
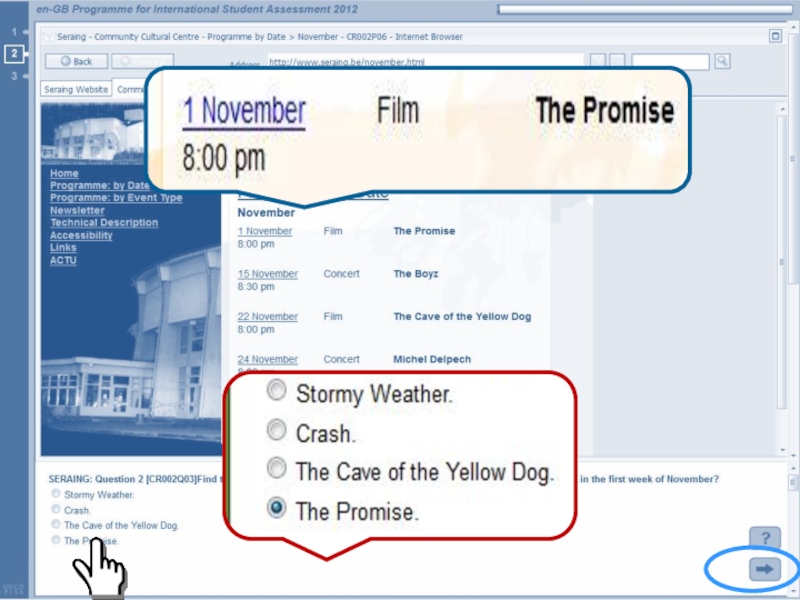
- 87. Using log-file data to understand what drives performance in PISA (Case study)
- 88. Relationship between long reaction time on Task
- 89. Success from perseverance Percentage of students who
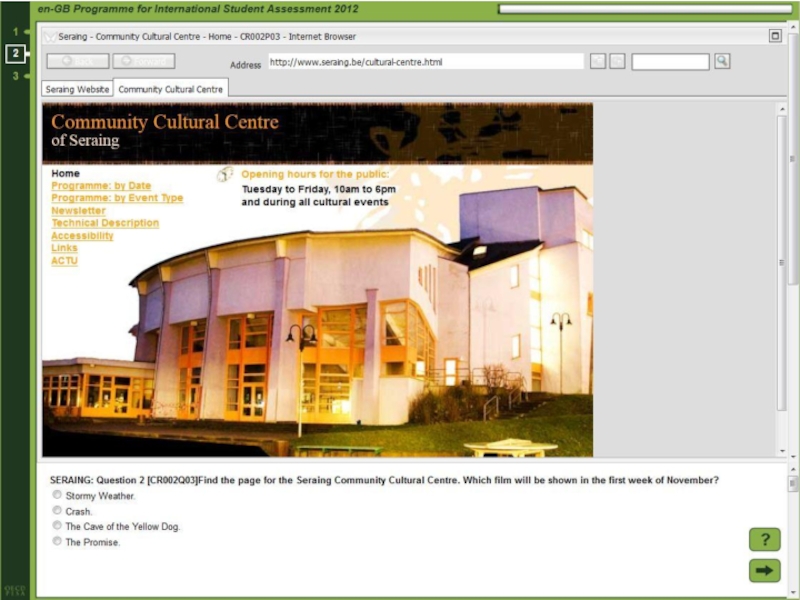
- 90. Navigation behaviour in Task 2 in the unit SERAING Source: Figure 7.9
- 91. Quality and quantity of navigation steps in
Слайд 1STUDENTS, COMPUTERS
AND LEARNING:
MAKING THE CONNECTION
September 2015
Andreas Schleicher
Director for Education and Skills


Слайд 3
Changes in the demand for skills
Trends in different tasks in occupations
Mean task input in percentiles of 1960 task distribution
Source: Autor, David H. and Brendan M. Price. 2013. "The Changing Task Composition of the US Labor Market: An Update of Autor, Levy, and Murnane (2003)." MIT Mimeograph, June.
Mean task")


Слайд 8
The Race between Technology and Education
Inspired by “The race between technology
Pr. Goldin & Katz (Harvard)
Industrial revolution
Digital revolution
Social pain
Universal
public schooling
Technology
Education
Prosperity
Social pain
Prosperity


Слайд 18
Strong performance in
in digital reading
Low performance in digital reading
Average performance
in
Fig 3.1

Слайд 19Countries doing better/worse in
digital literacy than in print reading?
Students'
Students' performance in digital reading is lower than their expected performance
Source: Figure 3.7
Score-point difference
Performance that would be expected based solely on print-reading

Слайд 20Overall browsing activity Average rank of students in the international comparison of
Percentile rank
Source: Figure 4.5
The index of overall browsing activity varies from 0 to 100, with:
0 indicating no browsing activity (no page visits beyond the starting page) and;
100 indicating the highest recorded level of browsing activity (page visits) for each test form.

Слайд 21Classification of students based on their overall browsing activity
%
Source: Figure 4.6
Percentage
No browsing activity: students with no navigation steps recorded in log files
Limited browsing activity: some navigation steps recorded, but index of overall browsing activity equal to 10 or lower
Moderate browsing activity: index of overall browsing activity between 10 and 75
Intensive browsing activity: index of overall browsing activity higher than 75

Слайд 22Think, then click: Task-oriented browsing Average rank of students in the international
Percentile rank
Source: Figure 4.7
The index of task-oriented browsing varies from 0 to 100. High values on this index reflect long navigation sequences that contain a high number of task-relevant steps and few or no missteps or task-irrelevant steps.

Слайд 23Classification of students based on the quality of their browsing activity
%
Source:
Percentage of students whose Internet browsing is mostly unfocused
Mostly unfocused browsing activity: students for whom the sum of navigation missteps and task-irrelevant steps is higher than the number of task-relevant steps
No browsing activity: no navigation steps recorded in log files
Insufficient or mixed browsing activity: the sum of navigation missteps and task-irrelevant steps is equal to the number of task-relevant steps or lower, and the index of task-relevant browsing is equal to 75 or lower
Highly focused browsing activity: index of task-relevant browsing higher than 75

Слайд 24Explained variation in the digital reading performance of countries and economies
80.4
10.4 %
4.4 %
4.9 %
Source: Figure 4.9

Слайд 25Relationship between digital reading performance and navigation behaviour
OECD average
OECD
average
R² =
Source: Figure 4.10
Percentile rank

Слайд 26
Strong performance in
in computer-based assessment of mathematics
Low performance in computer-based
Average performance
in computer-based
assesment
of mathematics
Fig 3.10

Слайд 27Relative success on mathematics tasks that require the use of computers
Better-than-expected performance on tasks that do not require the use of computers to solve mathematics problems
Better-than-expected performance on tasks that require the use of computers to solve mathematics problems
Odds ratio
(OECD average = 1.00)
Source: Figure 3.13

Слайд 28
Young adults (16-24 year-olds)
All adults (16-65 year-olds)
Digital problem solving skills of
%
PIAAC/OECD
All adults (16-65 year-olds)Digital problem solving skills of adults%PIAAC/OECD")


Слайд 31Access to computers at home:
Change between 2009 and 2012
Source: Figure 1.1
%
Note:

 Source: Figure 1.2%")
Слайд 33Internet access at home:
Change between 2009 and 2012
Source: Figure 1.2
%
Note: White


Слайд 35Access to the Internet at home and students' socio-economic status
The
Source: Figure 5.2
%
1. The difference between the top and the bottom quarter of ESCS is not statistically significant.

Слайд 36Early exposure to computers % of students who first used a computer
The PISA index of economic, social and cultural status (ESCS)
Source: Figure 5.4
%

Слайд 37Early exposure to computers, by gender % of students who first used
Source: Figure 5.5
%
1. The difference between boys and girls is not statistically significant.

Слайд 38Percentage of students with access to the Internet at school, but
Source: Figure 5.7
%
1. The difference between socio-economically advantaged and disadvantaged students is not statistically significant.

Слайд 39Common computer leisure activities outside of school, by students' socio-economic status OECD
Source: Figure 5.8

Слайд 40Relationship among analogue skills, socio-economic status, and performance in computer-based assessments
Source:
Performance
in (print) reading
Performance
in digital reading
PISA index of economic, social and cultural status
Direct effect: 0.5%
Digital reading
(Overall effect: 12.0%)
Indirect effect: 11.5%
Performance
in (paper-based) mathematics
Performance
in computer-based mathematics
PISA index of economic, social and cultural status
Direct effect: 0.1%
Computer-based mathematics
(Overall effect: 12.1%)
Indirect effect: 12.0%
")

Слайд 42Time spent on line in school and outside of school
Minutes per
Source: Figure 1.5
Percentage of students spending at least 4 hours on line, during weekend days

Слайд 43Feeling lonely at school, by time spent on the Internet outside of
% of students who agree with the statement « I feel lonely at school »
Source: Figure 1.8
1. The difference between moderate and extreme Internet users is not statistically significant.

Слайд 44Students arriving late for school, by time spent on the Internet outside
%
Source: Figure 1.9
1. The difference between moderate and extreme Internet users is not statistically significant.


Students per computerSource: Figure 2.14")
Слайд 47Number of students per school computer:
Change between 2009 and 2012
Students per
Source: Figure 2.14


Слайд 49Number of students per school computer:
Change between 2009 and 2012
Magnified
Students per
Source: Figure 2.14

Слайд 50Use of computers at school` Percentage of students who reported engaging in
During a typical school day:
At least once a week:
Source: Figure 2.16
%

Слайд 51Use of ICT at school % of students who reported engaging in
Source: Figure 2.1
%

Слайд 52Use of ICT at school % of students who reported engaging in
Source: Figure 2.1
%


Слайд 54Change between 2009 and 2012 in the share of students using
%
Source: Figure 2.4

Слайд 55Students and teachers using computers during mathematics lessons Percentage of students who
%
Source: Figure 2.7

Слайд 56Relationship between the change in ICT use at school and increased
Access to laptop computers at school increased;
share of students doing individual homework
on a school computer increased
Source: Figure 2.17

Слайд 57Relationship between computer use in mathematics lessons and students' exposure to
OECD average
%
Source: Figure 2.18
OECD average
OECD average
OECD average
%


Слайд 60Trends in mathematics performance and increase in computers in schools
Fewer computers More
Fewer computers More computers
Expected number of computers per student, based on per capita GDP
Source: Figure 6.3

Слайд 61Trends in mathematics performance and increase in computers at school
Expected number
Fewer computers More computers
Source: Figure 6.3

Слайд 62Students who use computers at school only moderately score the highest
Source: Figure 6.5
Relationship between students’ skills in reading and computer use at school
(average across OECD countries)
OECD average
Highest score
Print reading
Digital reading
Students with a value above 1 use chat or email at least once a week at school, browse the Internet for schoolwork almost every day, and practice and drill on computers (e.g. for foreign language or maths) at least weekly
Most students with a value above 0 use email at school at least once a month, browse the Internet for schoolwork at least once a week, and practice and drill on computers (e.g. for foreign language or maths) at least once a month

Слайд 63Source: Figure 6.5
Students who use computers at school only moderately score
OECD average

Слайд 64Frequency of computer use at school and digital reading skills OECD average
Score points
Source: Figure 6.6
Index of task-oreinted browsing

Слайд 65Performance in digital reading, by frequency of browsing the Internet for
Score points
Source: Figure 6.6

Слайд 66Students who do not use computers in maths lessons score highest
Source: Figure 6.7
Relationship between students’ skills in reading and computer use at school
(average across OECD countries)
Paper-based mathematics
Computer-based mathematics
Highest score
OECD average

Слайд 67Computer use in mathematics lessons and performance in computer-based mathematics OECD average
Score points
Source: Figure 6.8
Expected score points

Слайд 68Digital reading performance, by index of ICT use outside of school
Source: Figure 6.9
OECD average

Слайд 69Frequency of computer use outside of school for schoolwork and digital
Score points
Source: Figure 6.10
Index of task-oreinted browsing

Слайд 70Students who use computer outside of school for leisure moderately score
Source: Figure 6.11
Relation between students’ skills in reading and computer use outside of school for leisure (average across OECD countries)
OECD average
Print reading
Digital reading

Слайд 71Digital reading performance, by index of ICT use outside of school
Source: Figure 6.11
OECD average

Слайд 72Frequency of ICT use outside of school for leisure and digital
Score points
Source: Figure 6.12
Index of task-oreinted browsing

Слайд 73Teaching practices and computer use in math lessons
(OECD average)
Mean index
Source: Figure
Mean indexSource: Figure 2.19")
Слайд 74Students who use computer outside of school for schoolwork moderately score
Source: Figure 6.9
Relation between students’ skills in reading and computer use outside of school for schoolwork (average across OECD countries)
OECD average
Print reading
Digital reading

Слайд 75Mean mathematics performance, by school location, after accounting for socio-economic status
Fig
Most teachers value 21st century pedagogies…
Percentage of lower secondary teachers who "agree" or "strongly agree" that:

Слайд 76Mean mathematics performance, by school location, after accounting for socio-economic status
Fig
…but teaching practices do not always reflect that
Percentage of lower secondary teachers who report using the following teaching practices "frequently" or "in all or nearly all lessons"

Слайд 77Mean mathematics performance, by school location, after accounting for socio-economic status
Fig
Teachers' needs for professional development
Percentage of lower secondary teachers indicating they have a high level of need for professional development in the following areas

Слайд 78The potential of technology
To gain the benefits of collaborative planning, work,
To open up pedagogical options
To give extra attention to groups of learners
To give learners a sense of belonging & engagement
To mix students of different ages
To mix different abilities and strengths
To widen pedagogical options, including peer teaching
To allow for deeper learning
To create flexibility for more individual choices
To accelerate learning
To use out-of-school learning in effective & innovative ways
Inquiry, authentic learning, collaboration,
and formative assessment
A prominent place for student voice & agency

Слайд 79Expand access to content
As specialised materials well beyond textbooks, in
Support new pedagogies with learners as active participants
As tools for inquiry-based pedagogies and collaborative workspaces
Collaboration for knowledge creation
Collaboration platforms for teachers to share and enrich teaching materials
Feedback
Make it faster and more granular
Automatise data-intensive processes
Visualisation
Technology can amplify innovative teaching

Слайд 80Experiential learning
E.g. remote and virtual labs, project-based and enquiry-based pedagogies
Hands-on pedagogies
E.g. game development
Cooperative learning
E.g. local and global collaboration
Interactive and metacognitive pedagogies
E.g. real-time assessment
Using digital technology


Слайд 82Education is a heavily personalised service, so productivity gains through technology
Impact of technology on educational delivery remains sub-optimal
Over-estimation of digital skills among teachers AND students
Naïve policy and implementation strategies
Resistance of teachers AND students
Lack of understanding of pedagogy and instructional design
Low quality of educational software and courseware
Some conclusions

Слайд 83Some new developments seem to be more promising:
Highly interactive, non-linear courseware,
Sophisticated software for experimentation, simulation
Social media to support learning communities and communities of practice among teachers
Use of gaming in instruction
Concerted influence on the ‘education industry’
Some conclusions

Слайд 84Make costs and benefits of educational innovation as symmetric as possible
Everyone
(except for their own children)
The benefits for ‘winners’ are often insufficient to mobilise support, the costs for ‘losers’ are concentrated
That’s the power of interest groups
Need for consistent, co-ordinated efforts to persuade those affected of the need for change and, in particular, to communicate the costs of inaction
Some conclusions

Слайд 85Given the uncertainties that accompany change, education stakeholders will always value
Successful innovations…
are good at communicating the need for change and building support for change
tend to invest in capacity development and change-management skills
develop evidence and feed this back to institutions along with tools with which they can use the information
Are backed by sustainable financing
Teachers need to be active agents, not just in the implementation of innovations, but also in their design
Some conclusions

Слайд 86
Thank you
Find out more about our work at www.oecd.org
All publications
The complete
Email: Andreas.Schleicher@OECD.org
Twitter: SchleicherEDU
and remember:
Without data, you are just another person with an opinion

")
Слайд 88Relationship between long reaction time on Task 2 in the unit
Source: Figure 7.4
%
%

Слайд 89Success from perseverance Percentage of students who succeed on Task 3 in
%
Source: Figure 7.6


Слайд 91Quality and quantity of navigation steps in Task 2 in the
Source: Figure 7.10
Navigation steps