- Главная
- Разное
- Дизайн
- Бизнес и предпринимательство
- Аналитика
- Образование
- Развлечения
- Красота и здоровье
- Финансы
- Государство
- Путешествия
- Спорт
- Недвижимость
- Армия
- Графика
- Культурология
- Еда и кулинария
- Лингвистика
- Английский язык
- Астрономия
- Алгебра
- Биология
- География
- Детские презентации
- Информатика
- История
- Литература
- Маркетинг
- Математика
- Медицина
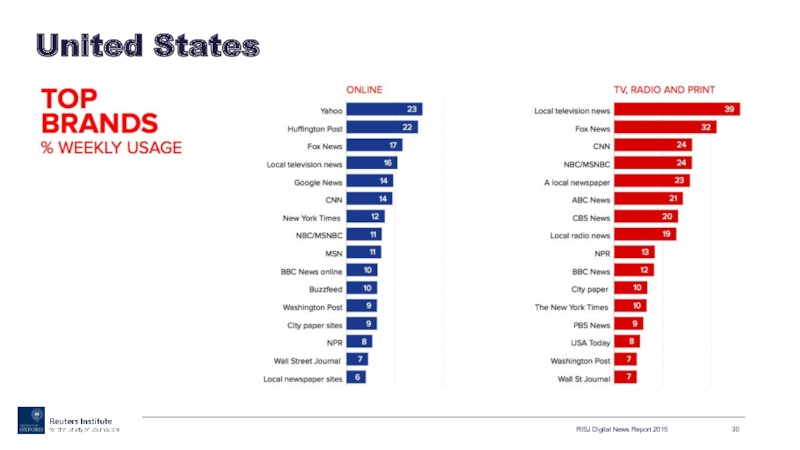
- Менеджмент
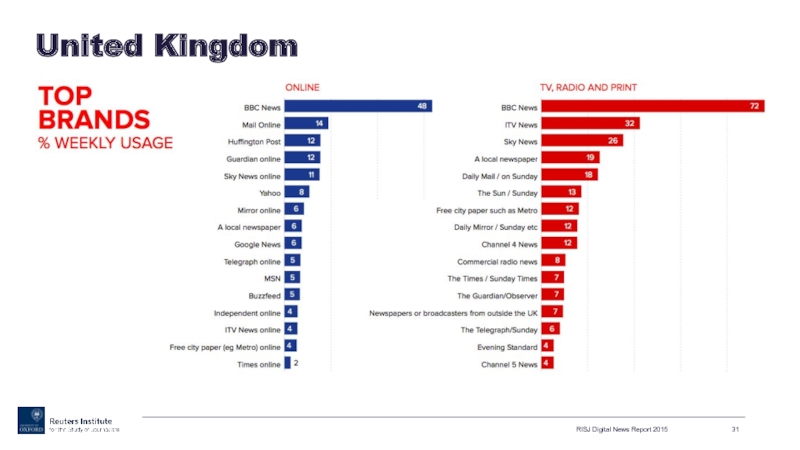
- Музыка
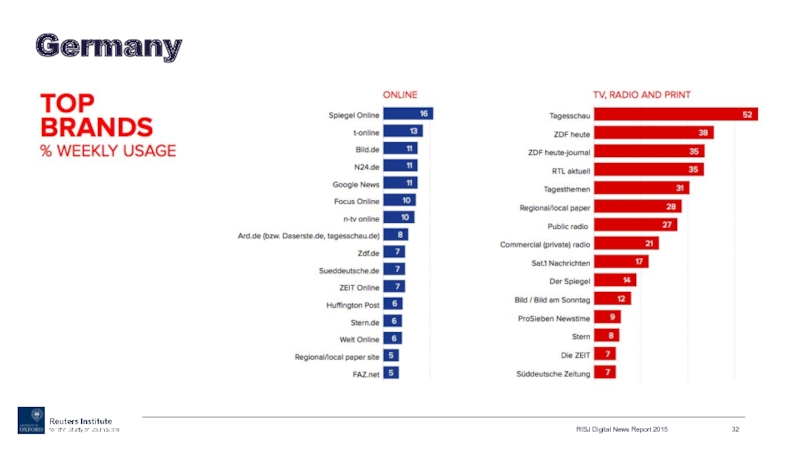
- МХК
- Немецкий язык
- ОБЖ
- Обществознание
- Окружающий мир
- Педагогика
- Русский язык
- Технология
- Физика
- Философия
- Химия
- Шаблоны, картинки для презентаций
- Экология
- Экономика
- Юриспруденция
REUTERS INSTITUTEDIGITAL NEWS REPORT презентация
Содержание
- 1. REUTERS INSTITUTEDIGITAL NEWS REPORT
- 2. Background and methodology This is one
- 3. Key findings from 2015 Move
- 4. 1. CENTRALITY OF SMARTPHONES 9
- 5. Strong growth in news via smartphone
- 6. Mobile app or mobile browser? RISJ Digital
- 7. The app gap 70% have a
- 8. 2. SOURCES OF NEWS
- 9. Top news sources compared 2012-15 Online news
- 10. Top news sources compared 2012-15 But it
- 11. Main source of news TV remains the
- 12. Main source of news by age RISJ
- 13. Young turning away from TV News Some
- 14. Overall trust in the news environment
- 15. Partisan viewing of TV news channels US
- 16. 3. SOCIAL MEDIA AND MESSAGING APPS
- 17. Facebook becoming more important for news RISJ
- 18. We seek news on Twitter but
- 19. RISJ Digital News Report 2015 Percentage using
- 20. 4. VIDEO GROWTH AND NEW FORMATS
- 21. Growth in online video usage RISJ Digital
- 22. Attitudes to video vs text RISJ Digital
- 23. Types of video consumed RISJ Digital News
- 24. Barriers to video usage RISJ Digital News
- 25. 5. DISRUPTION TO TRADITIONAL BRANDS
- 26. Japan, Australia suffering most disruption – Finland,
- 27. Battle for global eyeballs The Huffington Post
- 28. New routes to news accelerate disruption Competition
- 29. 6. TOP BRANDS BY COUNTRY
- 30. RISJ Digital News Report 2015 United States
- 31. RISJ Digital News Report 2015 United Kingdom
- 32. RISJ Digital News Report 2015 Germany
- 33. 7. THE BUSINESS OF JOURNALISM
- 34. RISJ Digital News Report 2015 Newspaper purchase
- 35. Paying for online news content Compared to
- 36. How much might you be prepared to
- 37. Advertising revenues RISJ Digital News Report 2015
- 38. Sponsored and branded content RISJ Digital
- 39. Smartphones are changing the news experience. How
- 40. Do we know enough about growing digital
- 41. Thanks for listening. More information: www.digitalnewsreport.org RISJ Digital News Report 2015
Слайд 1
REUTERS INSTITUTE
DIGITAL NEWS REPORT
KEY FINDINGS FROM 2015
Edited highlights
Curated by:
Damian
Слайд 2Background and
methodology
This is one of the largest news surveys in
Additional analysis of key themes, country level insights from network of partners
RISJ Digital News Report 2015
Please note that Brazil is representative of an urban population rather than a national population.
Source: Internet World Stats www.internetworldstats.com internet population estimate 2014.
Слайд 3Key
findings
from 2015
Move to mobile – smartphone ever more central
Growing power
Video and new visual formats taking off
Increased disruption for traditional media by digital-born companies and aggregators
Making money getting harder due to mobile and social
RISJ Digital News Report 2015
Слайд 4
1. CENTRALITY
OF SMARTPHONES
9 July 2015
RISJ Digital News Report 2015 Presentation
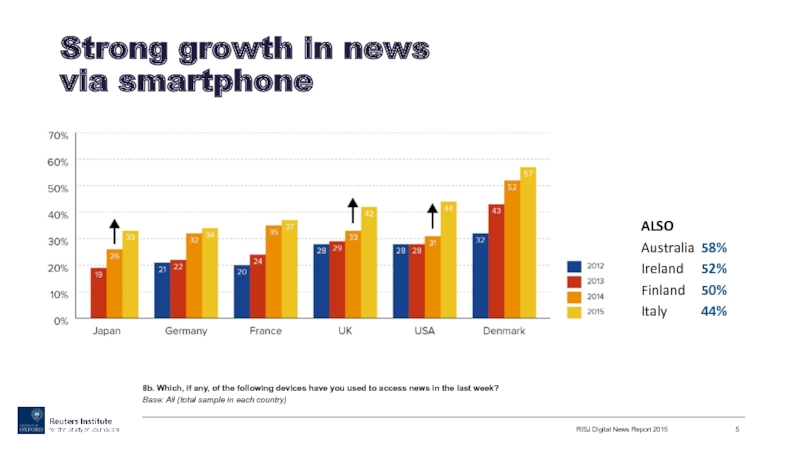
Слайд 5Strong growth in news
via smartphone
RISJ Digital News Report 2015
8b. Which,
ALSO
Australia 58%
Ireland 52%
Finland 50%
Italy 44%
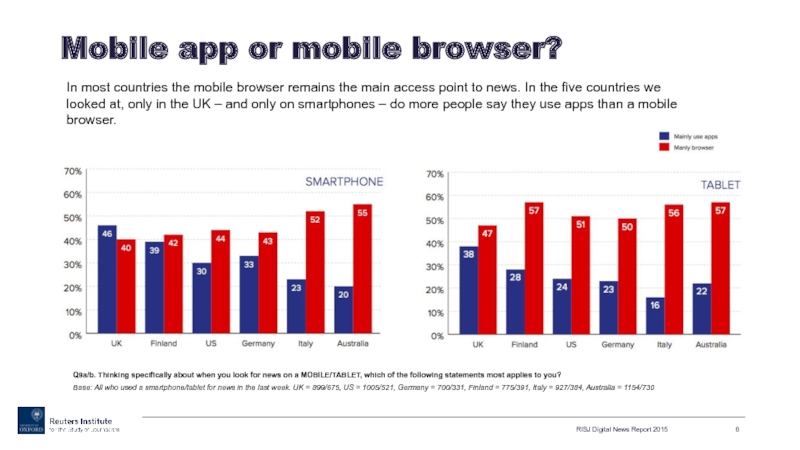
Слайд 6Mobile app or mobile browser?
RISJ Digital News Report 2015
In most countries
Q9a/b. Thinking specifically about when you look for news on a MOBILE/TABLET, which of the following statements most applies to you?
Base: All who used a smartphone/tablet for news in the last week. UK = 899/675, US = 1005/521, Germany = 700/331, Finland = 775/391, Italy = 927/384, Australia = 1154/730
Слайд 7The app gap
70%
have a news app installed on their phone,
RISJ Digital News Report 2015
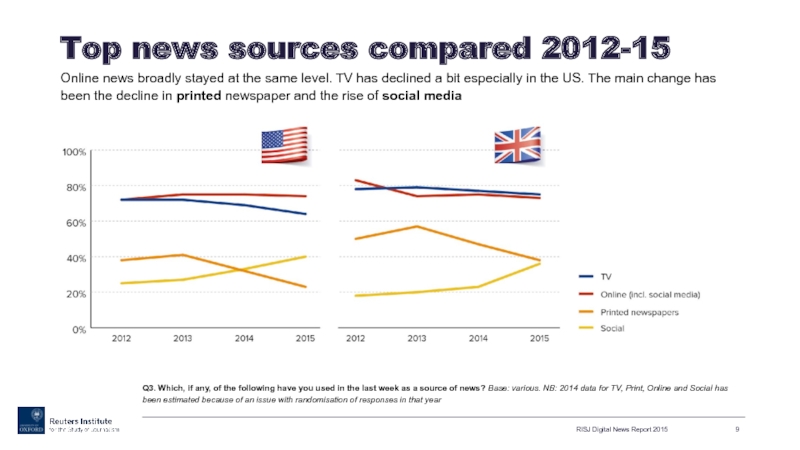
Слайд 9Top news sources compared 2012-15
Online news broadly stayed at the same
RISJ Digital News Report 2015
Q3. Which, if any, of the following have you used in the last week as a source of news? Base: various. NB: 2014 data for TV, Print, Online and Social has been estimated because of an issue with randomisation of responses in that year
Слайд 10Top news sources compared 2012-15
But it is not the same story
RISJ Digital News Report 2015
Q3. Which, if any, of the following have you used in the last week as a source of news? Base: various. NB: 2014 data for TV, Print, Online and Social has been estimated because of an issue with randomisation of responses in that year
Слайд 11Main source of news
TV remains the most important source of news
RISJ Digital News Report 2015
Q4. You say you’ve used these sources of news in the last week, which would you say is your MAIN source of news? Base: All who used a source of news in the last week in each country.
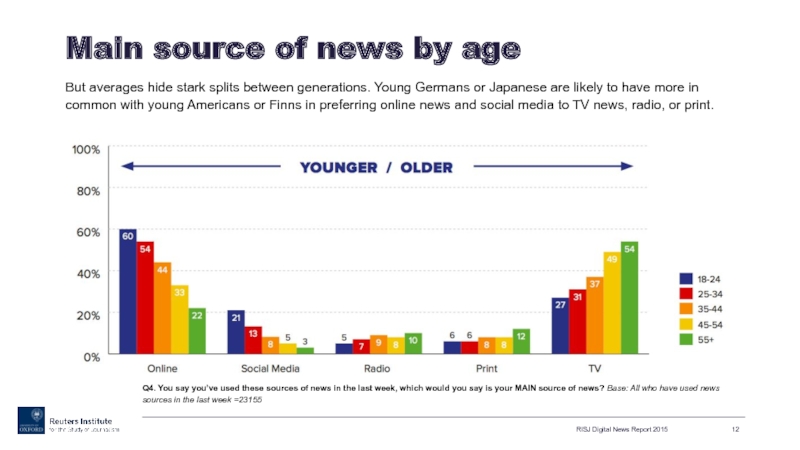
Слайд 12Main source of news by age
RISJ Digital News Report 2015
Q4. You
But averages hide stark splits between generations. Young Germans or Japanese are likely to have more in common with young Americans or Finns in preferring online news and social media to TV news, radio, or print.
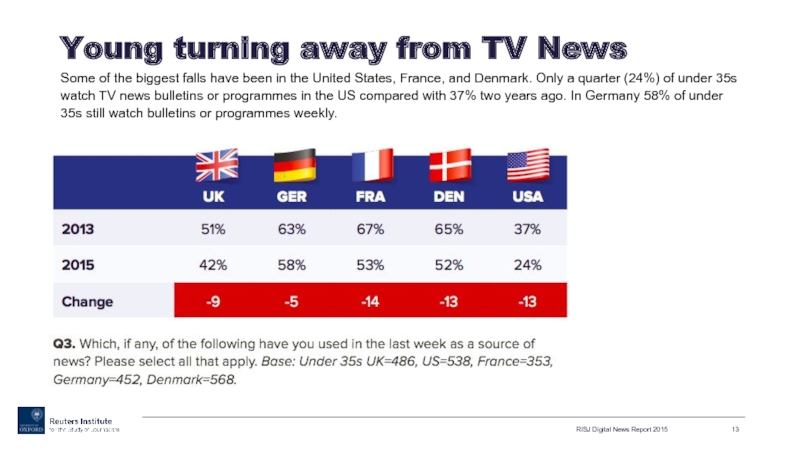
Слайд 13Young turning away from TV News
Some of the biggest falls have
RISJ Digital News Report 2015
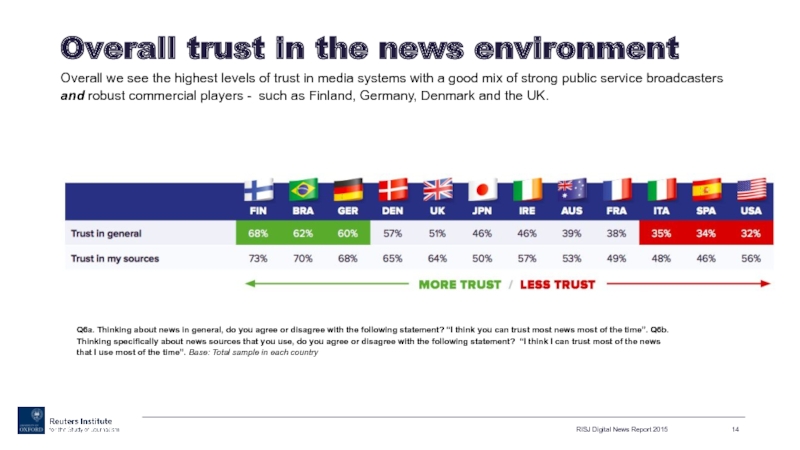
Слайд 14Overall trust in the news environment
Overall we see the highest
RISJ Digital News Report 2015
Q6a. Thinking about news in general, do you agree or disagree with the following statement? “I think you can trust most news most of the time”. Q6b. Thinking specifically about news sources that you use, do you agree or disagree with the following statement? “I think I can trust most of the news that I use most of the time”. Base: Total sample in each country
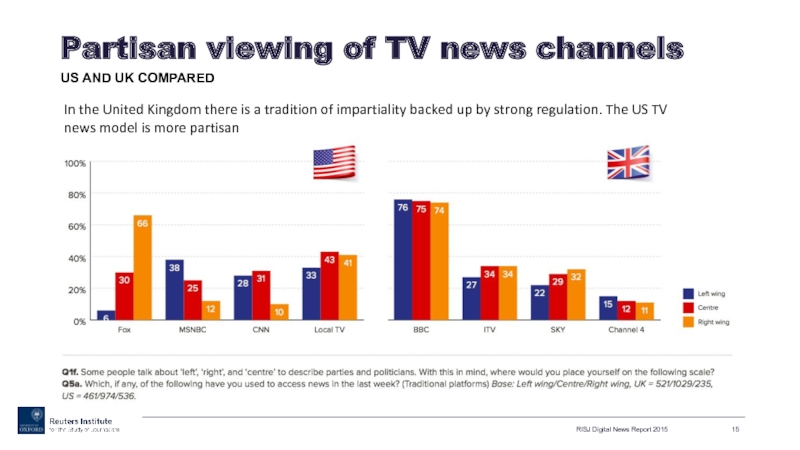
Слайд 15Partisan viewing of TV news channels
US AND UK COMPARED
RISJ Digital News
In the United Kingdom there is a tradition of impartiality backed up by strong regulation. The US TV news model is more partisan
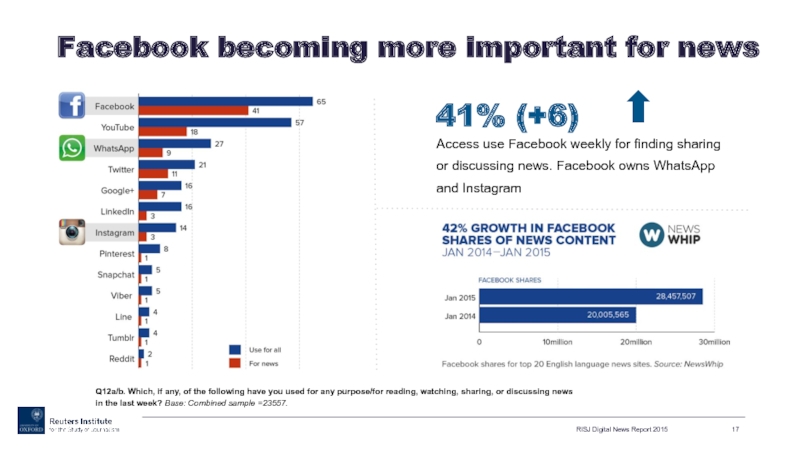
Слайд 17Facebook becoming more important for news
RISJ Digital News Report 2015
Q12a/b. Which,
41% (+6)
Access use Facebook weekly for finding sharing or discussing news. Facebook owns WhatsApp and Instagram
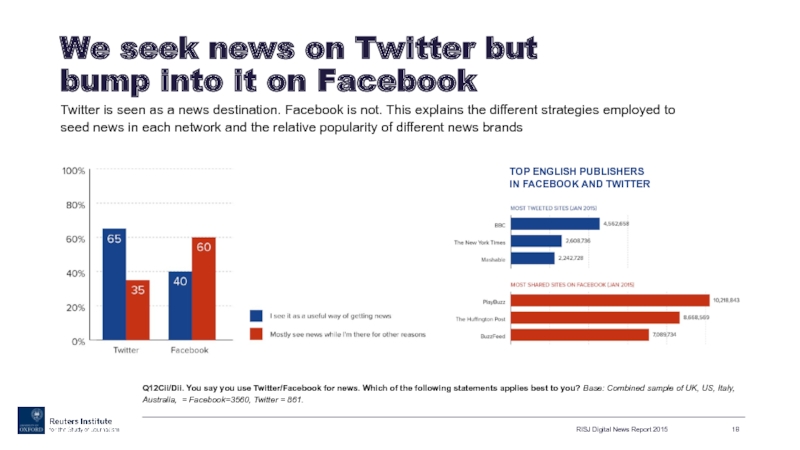
Слайд 18We seek news on Twitter but
bump into it on Facebook
Twitter
RISJ Digital News Report 2015
Q12Cii/Dii. You say you use Twitter/Facebook for news. Which of the following statements applies best to you? Base: Combined sample of UK, US, Italy, Australia, = Facebook=3560, Twitter = 861.
TOP ENGLISH PUBLISHERS
IN FACEBOOK AND TWITTER
Слайд 19RISJ Digital News Report 2015
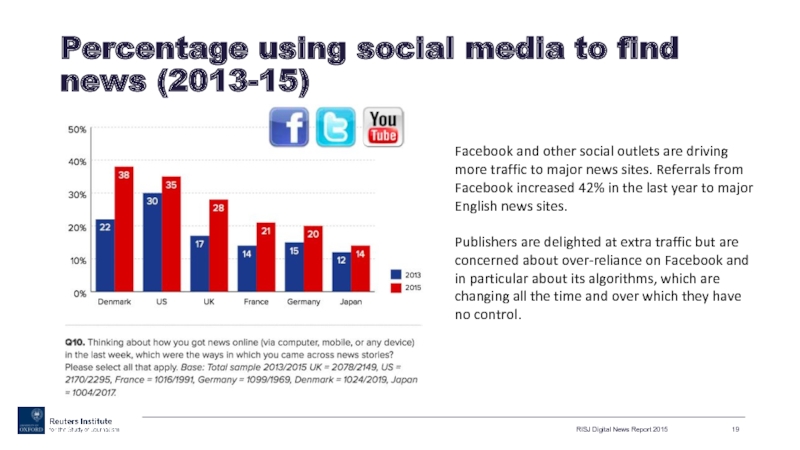
Percentage using social media to find news
Facebook and other social outlets are driving more traffic to major news sites. Referrals from Facebook increased 42% in the last year to major English news sites.
Publishers are delighted at extra traffic but are concerned about over-reliance on Facebook and in particular about its algorithms, which are changing all the time and over which they have no control.
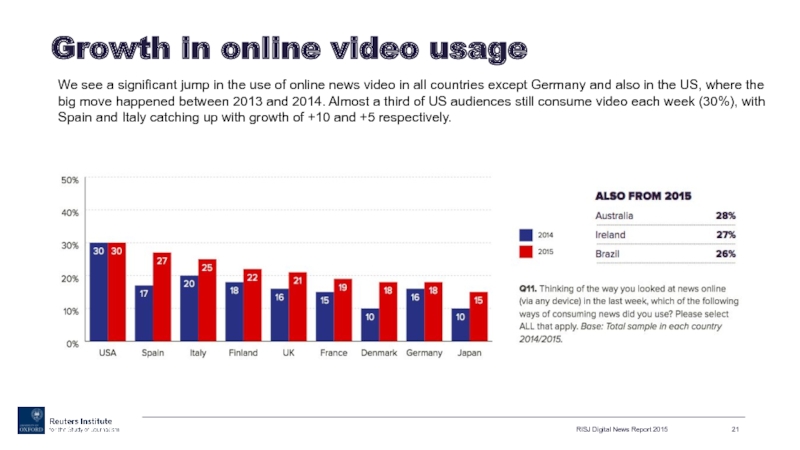
Слайд 21Growth in online video usage
RISJ Digital News Report 2015
We see a
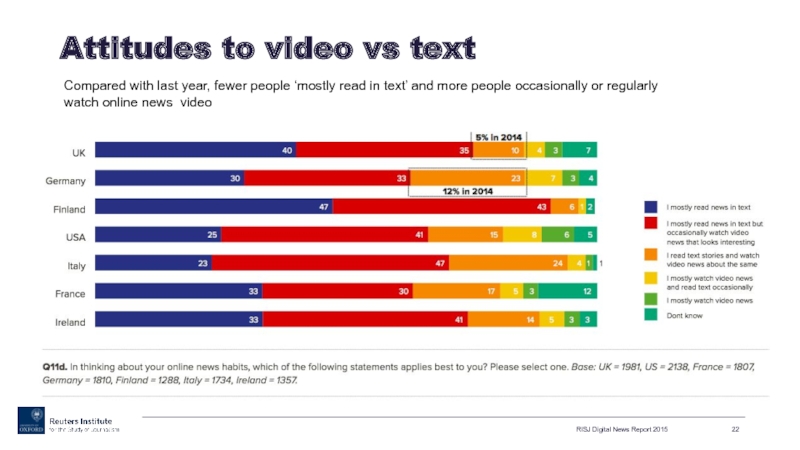
Слайд 22Attitudes to video vs text
RISJ Digital News Report 2015
Compared with last
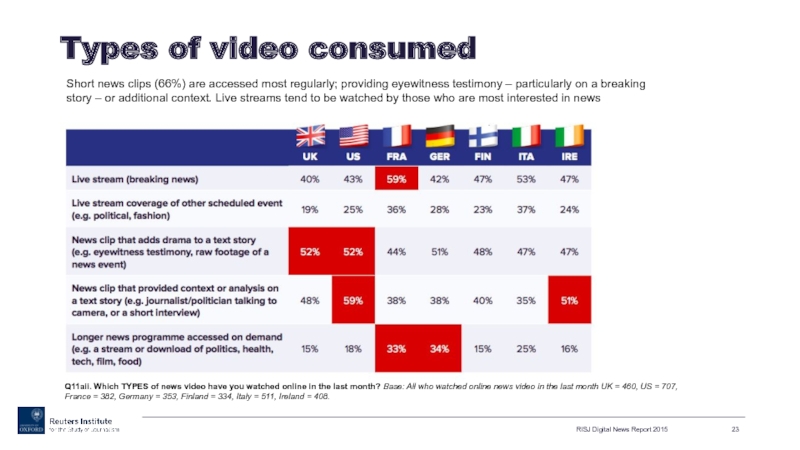
Слайд 23Types of video consumed
RISJ Digital News Report 2015
Q11aii. Which TYPES of
Short news clips (66%) are accessed most regularly; providing eyewitness testimony – particularly on a breaking story – or additional context. Live streams tend to be watched by those who are most interested in news
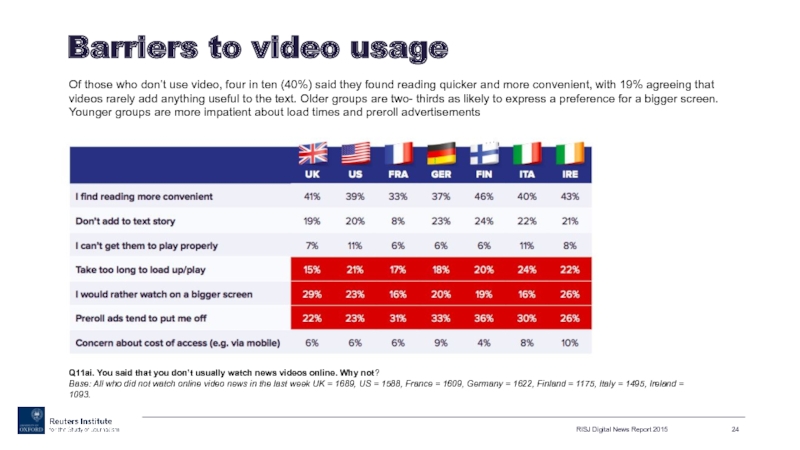
Слайд 24Barriers to video usage
RISJ Digital News Report 2015
Q11ai. You said that
Of those who don’t use video, four in ten (40%) said they found reading quicker and more convenient, with 19% agreeing that videos rarely add anything useful to the text. Older groups are two- thirds as likely to express a preference for a bigger screen. Younger groups are more impatient about load times and preroll advertisements
Слайд 26Japan, Australia suffering most disruption – Finland, Denmark and UK the
RISJ Digital News Report 2015
Q5b. Which, if any, of the following have you used to access news in the last week ? Via online platforms (web, mobile, tablet, e-reader).
Base: All markets 2015.
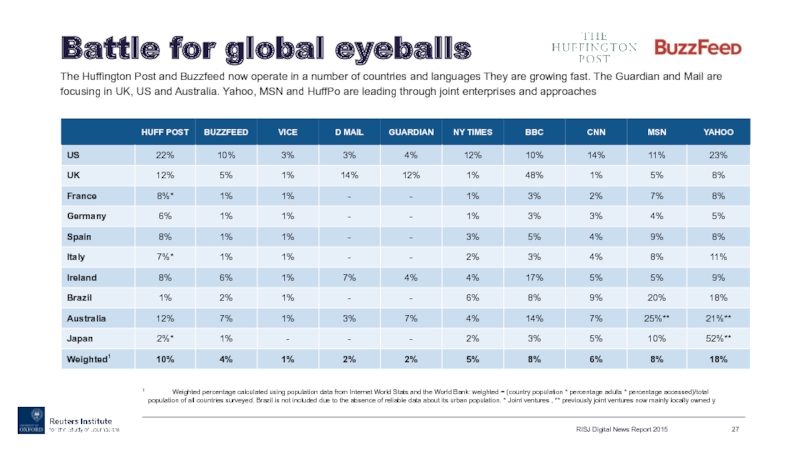
Слайд 27Battle for global eyeballs
The Huffington Post and Buzzfeed now operate in
RISJ Digital News Report 2015
1 Weighted percentage calculated using population data from Internet World Stats and the World Bank: weighted = (country population * percentage adults * percentage accessed)/total population of all countries surveyed. Brazil is not included due to the absence of reliable data about its urban population. * Joint ventures , ** previously joint ventures now mainly locally owned y
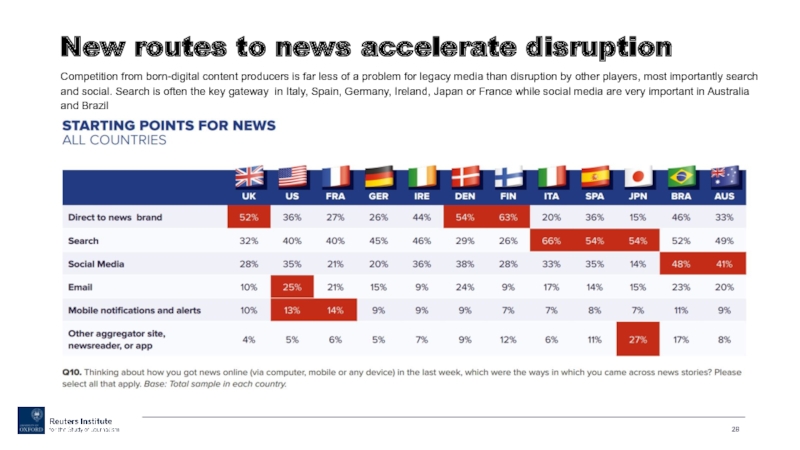
Слайд 28New routes to news accelerate disruption
Competition from born-digital content producers is
Слайд 34RISJ Digital News Report 2015
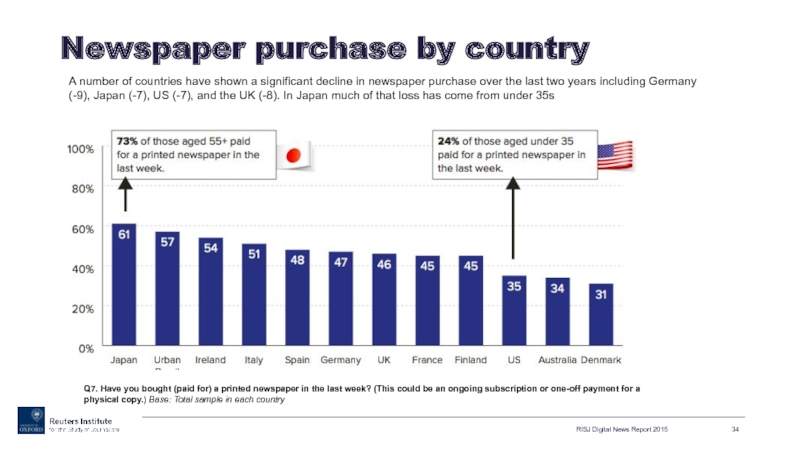
Newspaper purchase by country
Q7. Have you bought
A number of countries have shown a significant decline in newspaper purchase over the last two years including Germany (-9), Japan (-7), US (-7), and the UK (-8). In Japan much of that loss has come from under 35s
Слайд 35Paying for online news content
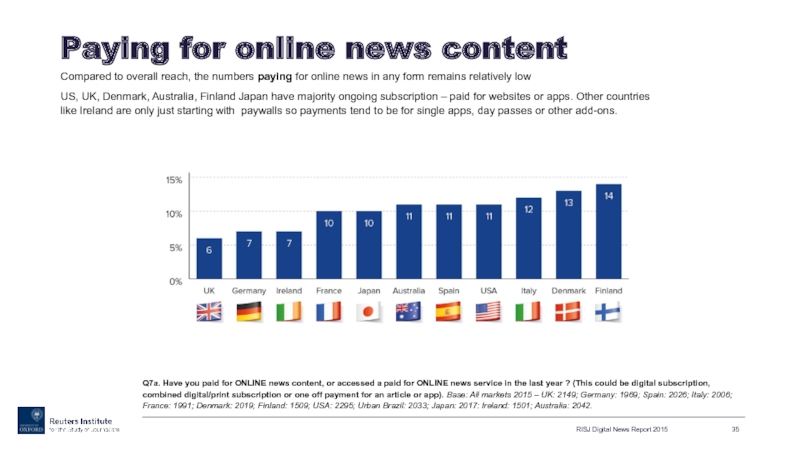
Compared to overall reach, the numbers paying
US, UK, Denmark, Australia, Finland Japan have majority ongoing subscription – paid for websites or apps. Other countries like Ireland are only just starting with paywalls so payments tend to be for single apps, day passes or other add-ons.
RISJ Digital News Report 2015
Q7a. Have you paid for ONLINE news content, or accessed a paid for ONLINE news service in the last year ? (This could be digital subscription, combined digital/print subscription or one off payment for an article or app). Base: All markets 2015 – UK: 2149; Germany: 1969; Spain: 2026; Italy: 2006; France: 1991; Denmark: 2019; Finland: 1509; USA: 2295; Urban Brazil: 2033; Japan: 2017: Ireland: 1501; Australia: 2042.
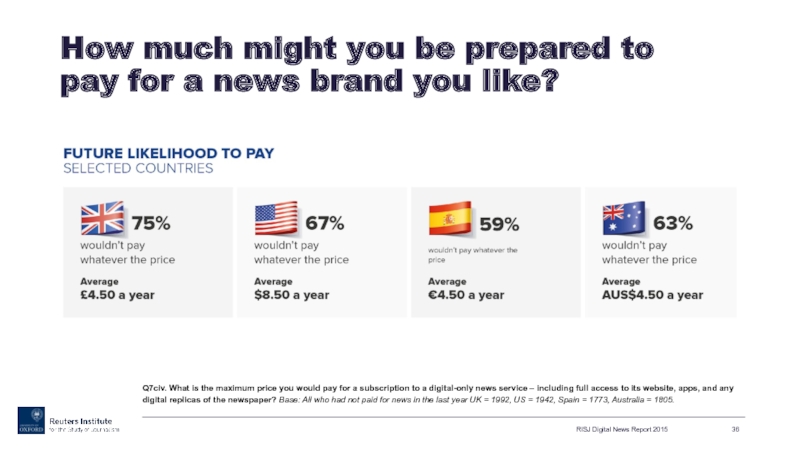
Слайд 36How much might you be prepared to pay for a news
RISJ Digital News Report 2015
Q7civ. What is the maximum price you would pay for a subscription to a digital-only news service – including full access to its website, apps, and any digital replicas of the newspaper? Base: All who had not paid for news in the last year UK = 1992, US = 1942, Spain = 1773, Australia = 1805.
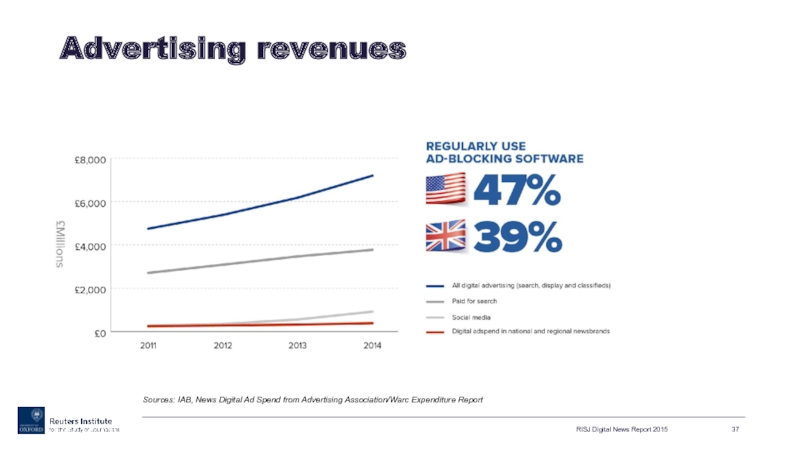
Слайд 37Advertising revenues
RISJ Digital News Report 2015
Sources: IAB, News Digital Ad Spend
Слайд 38Sponsored and
branded content
RISJ Digital News Report 2015
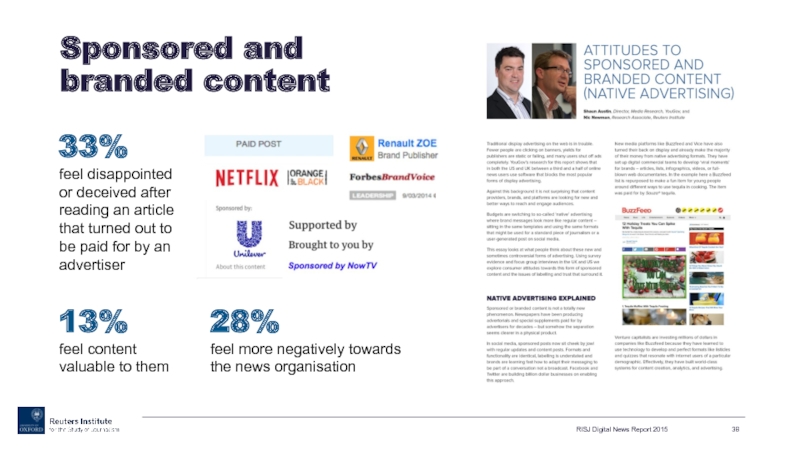
33%
feel disappointed or
13%
feel content valuable to them
28%
feel more negatively towards the news organisation
Слайд 39Smartphones are changing the news experience. How can news brands get
More offsite consumption (social networks, aggregators) feeds traffic but at cost of control
Can legacy media innovate enough to hold their own against disrupters?
Business prospects for advertising and pay models remain challenging
Key implications for industry
Слайд 40Do we know enough about growing digital brands? (HuffPo, Buzzfeed, Vice
What relationships do we have with them? (internships) Are they looking for different skills?
How do we teach writing for mobile, social, or pieces which blend video and text?
What’s the best way to pool our learning – journalism, PR and advertising – to understand interlinked changes across our industry?
Potential implications
for SOJC


