- Главная
- Разное
- Дизайн
- Бизнес и предпринимательство
- Аналитика
- Образование
- Развлечения
- Красота и здоровье
- Финансы
- Государство
- Путешествия
- Спорт
- Недвижимость
- Армия
- Графика
- Культурология
- Еда и кулинария
- Лингвистика
- Английский язык
- Астрономия
- Алгебра
- Биология
- География
- Детские презентации
- Информатика
- История
- Литература
- Маркетинг
- Математика
- Медицина
- Менеджмент
- Музыка
- МХК
- Немецкий язык
- ОБЖ
- Обществознание
- Окружающий мир
- Педагогика
- Русский язык
- Технология
- Физика
- Философия
- Химия
- Шаблоны, картинки для презентаций
- Экология
- Экономика
- Юриспруденция
Education at a Glance презентация
Содержание
- 1. Education at a Glance
- 2. Qualification levels in Europe have risen
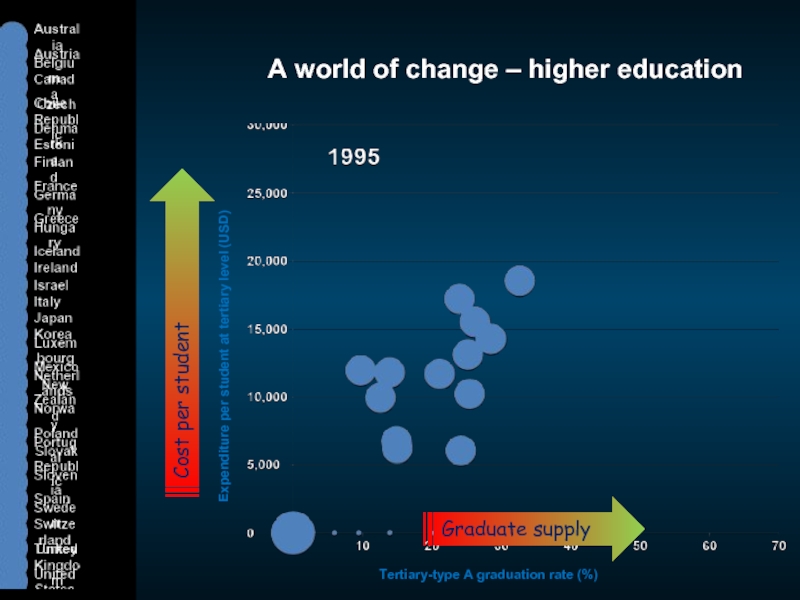
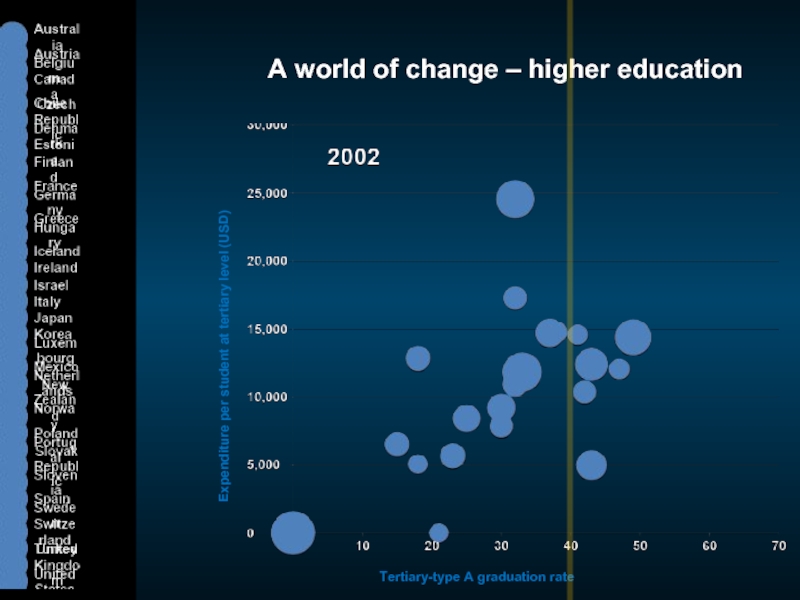
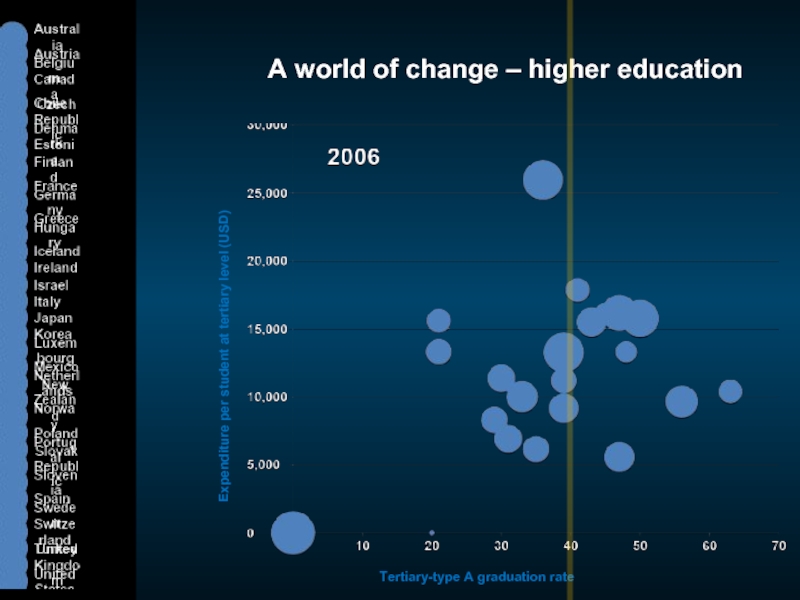
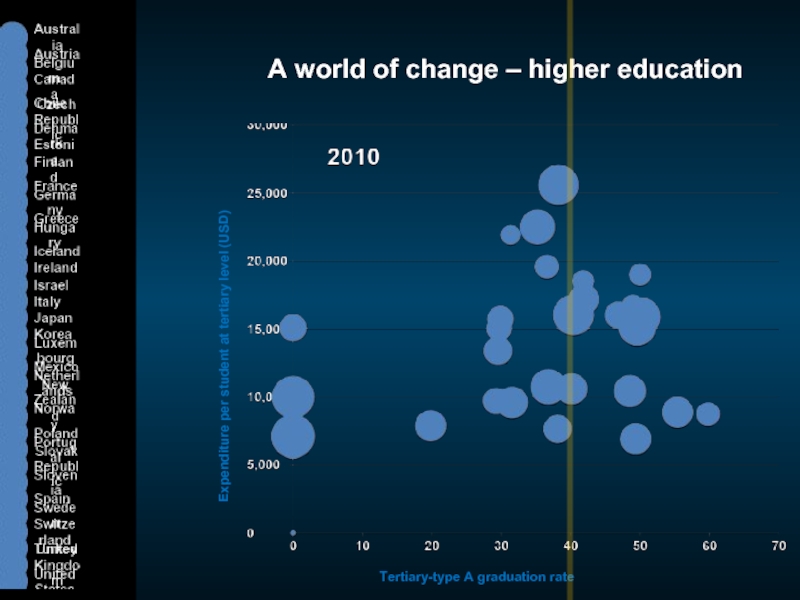
- 3. A world of change – higher education
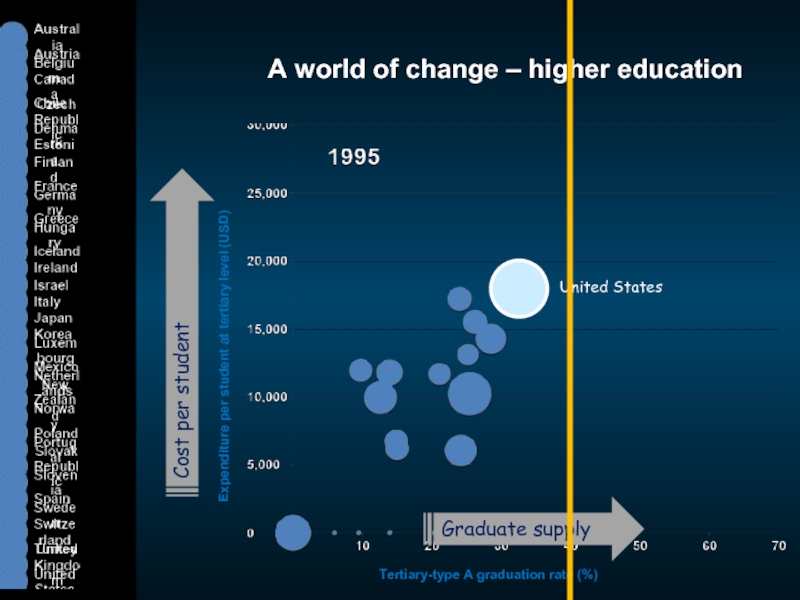
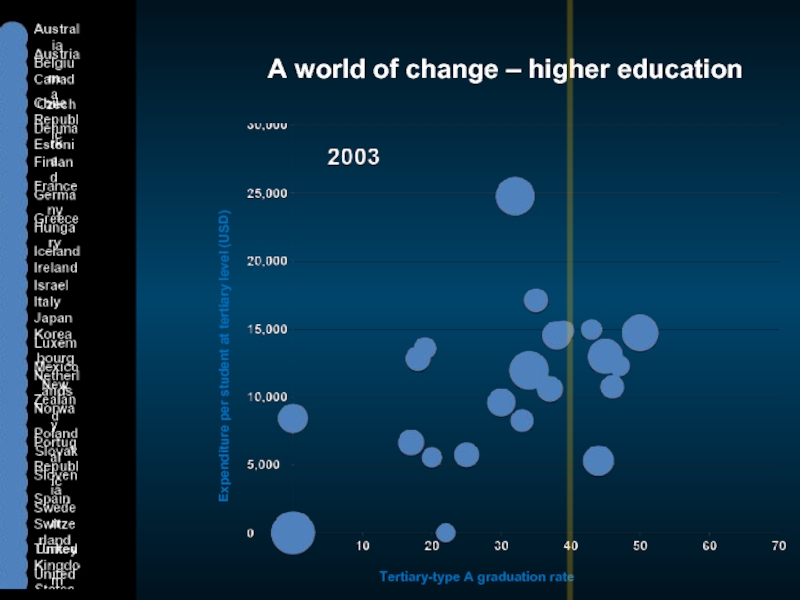
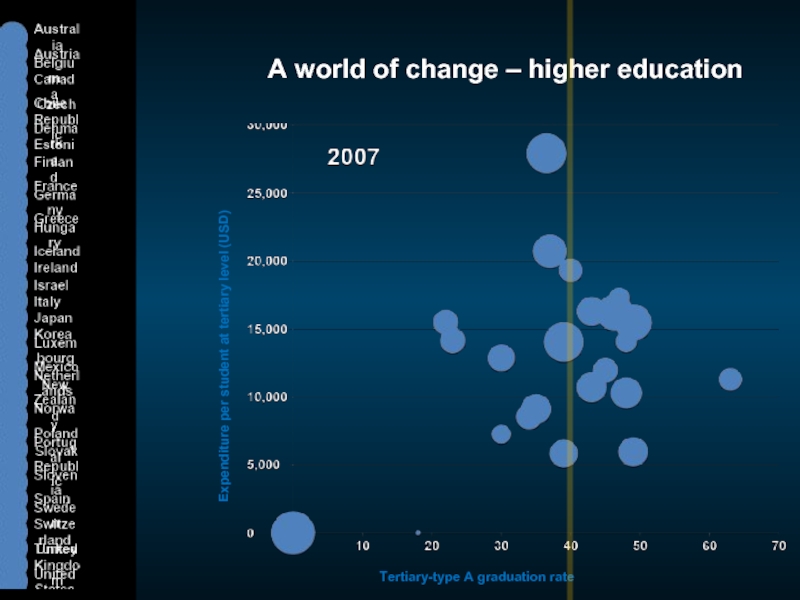
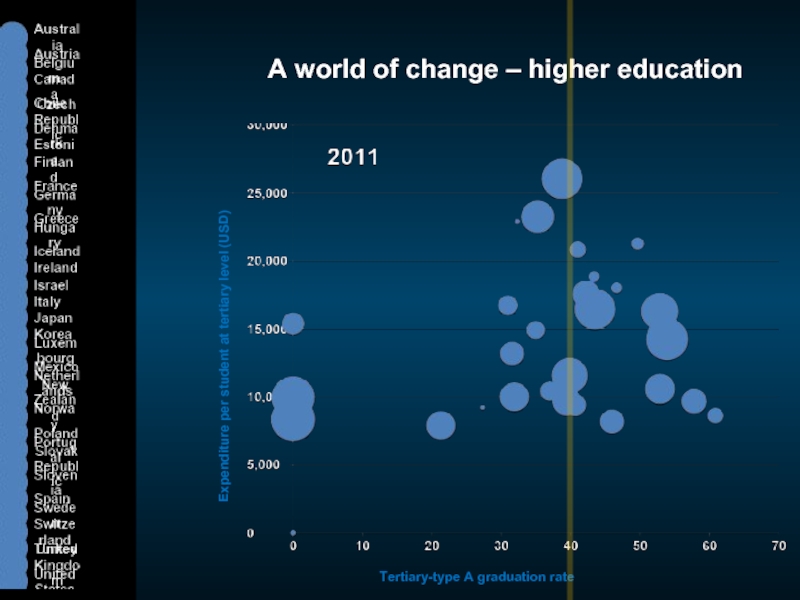
- 4. A world of change – higher education
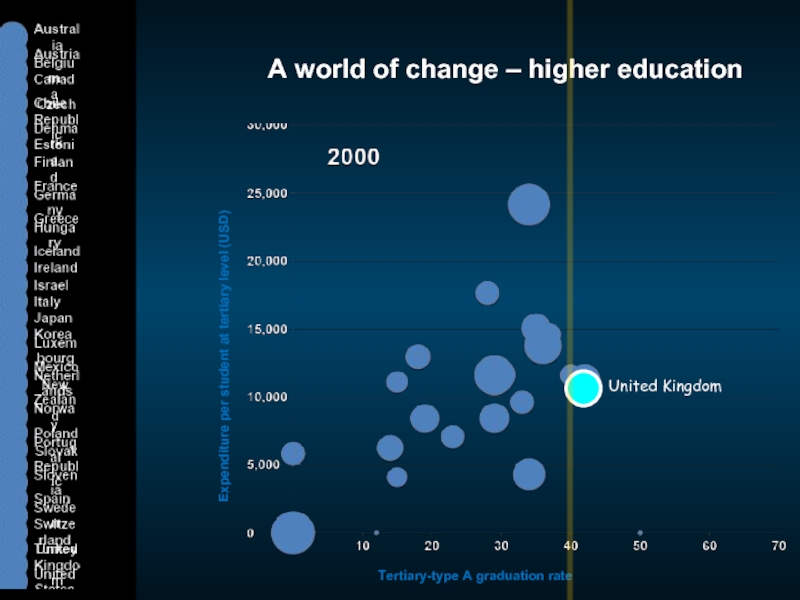
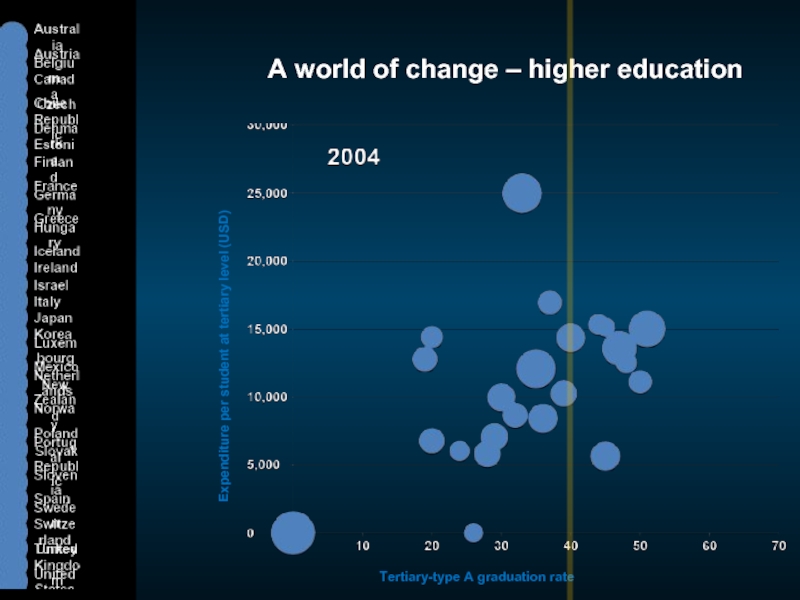
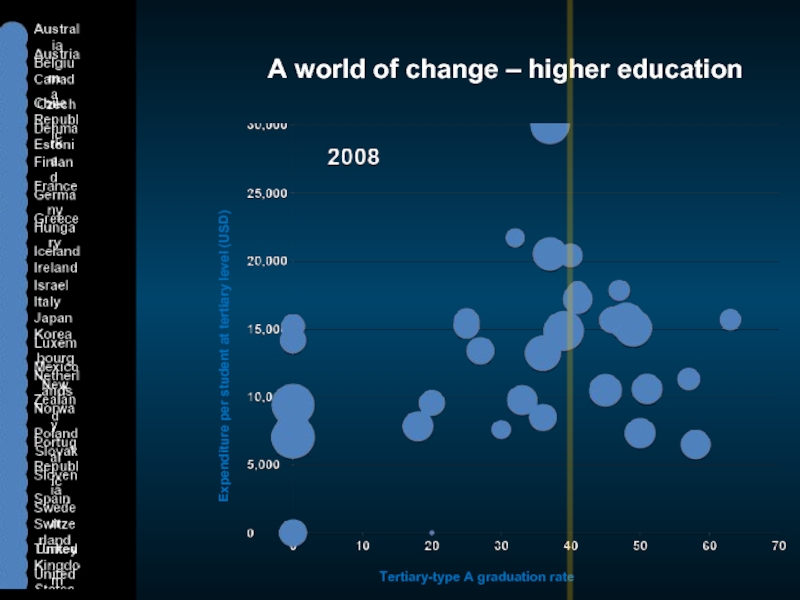
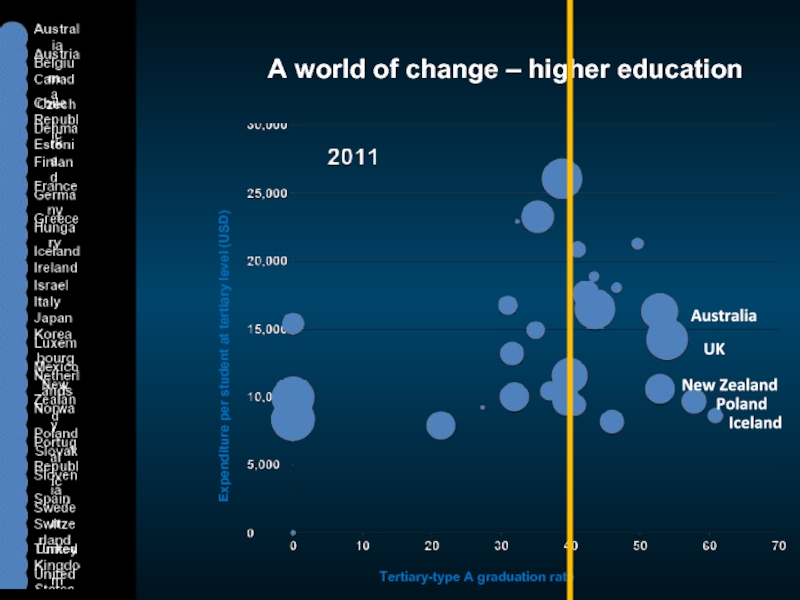
- 5. A world of change – higher education
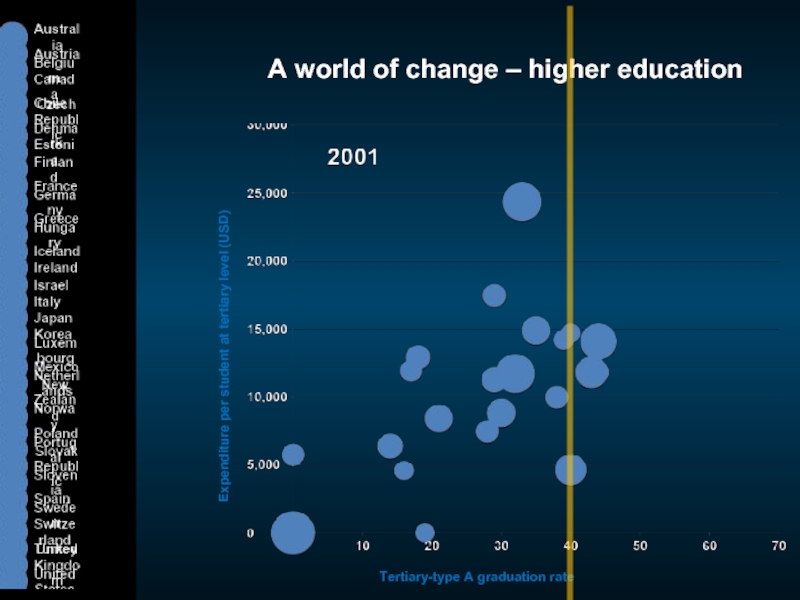
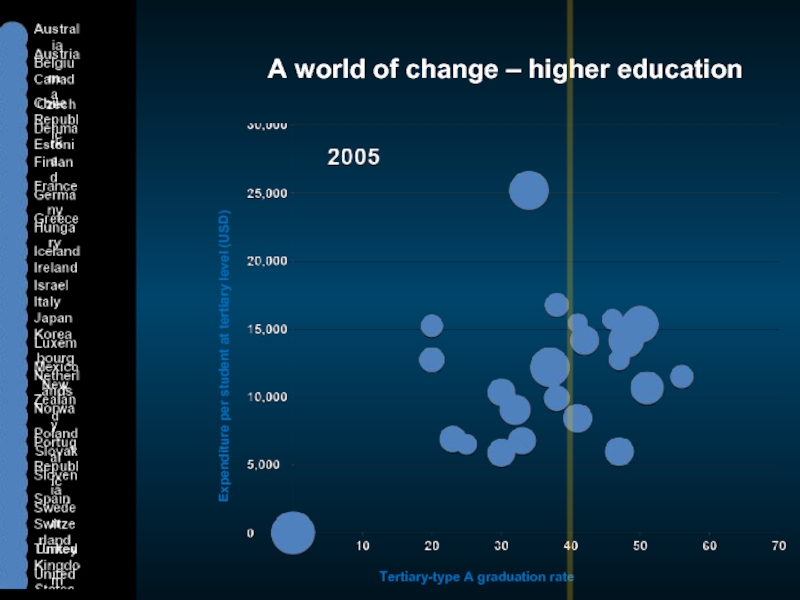
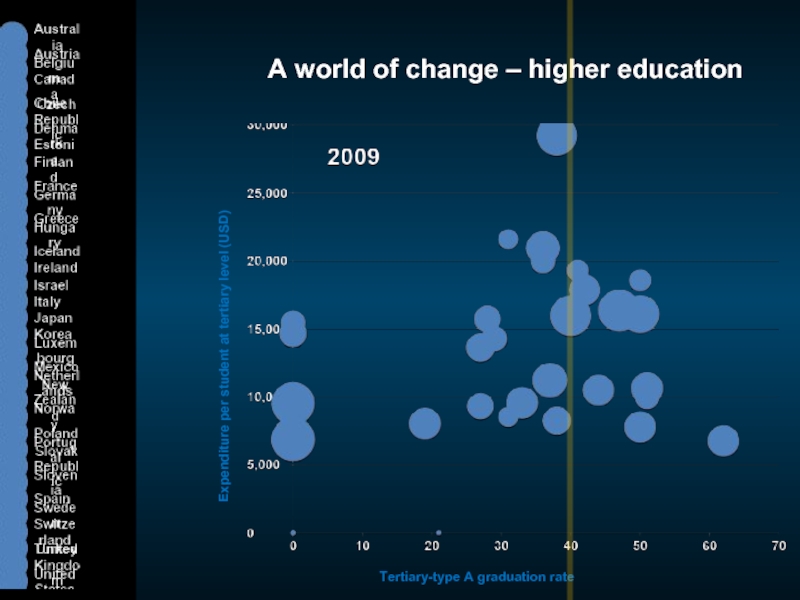
- 6. A world of change – higher education
- 7. A world of change – higher education
- 8. A world of change – higher education
- 9. A world of change – higher education
- 10. A world of change – higher education
- 11. A world of change – higher education
- 12. A world of change – higher education
- 13. A world of change – higher education
- 14. A world of change – higher education
- 15. A world of change – higher education
- 16. A world of change – higher education
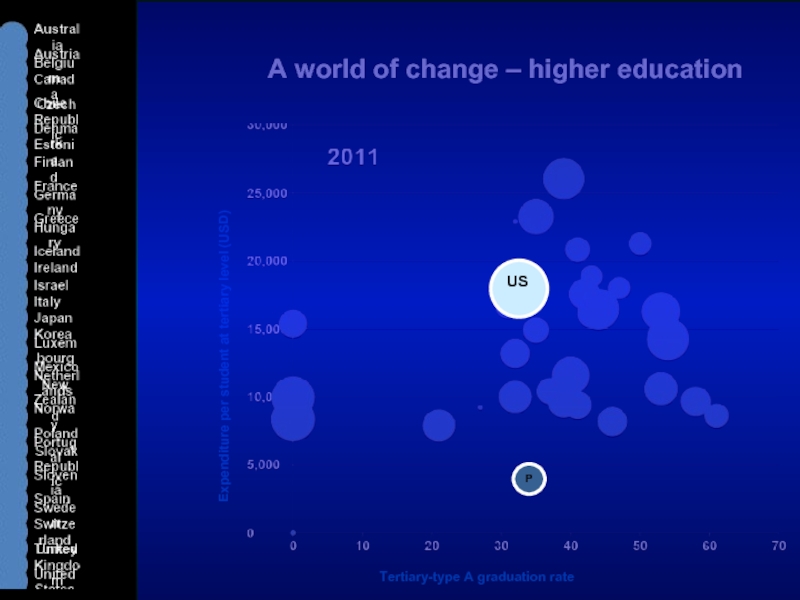
- 17. A world of change – higher education
- 18. A world of change – higher education
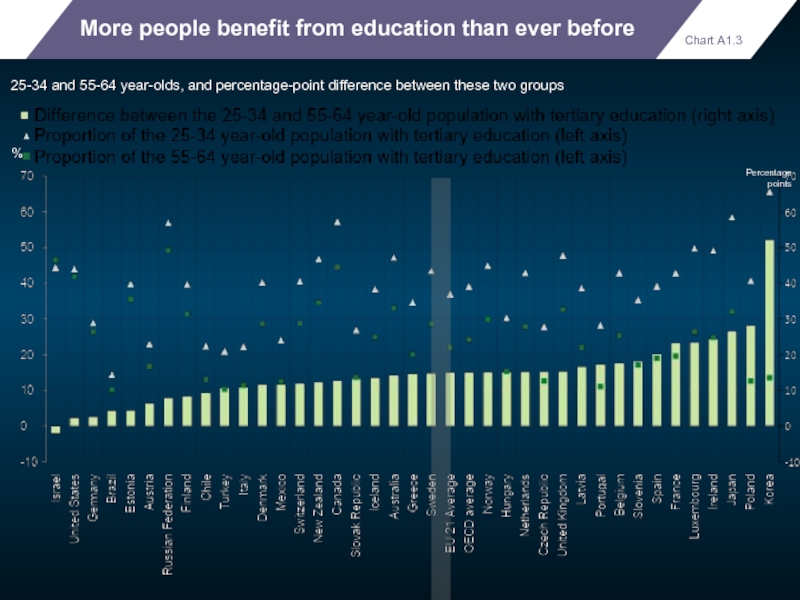
- 19. More people benefit from education than
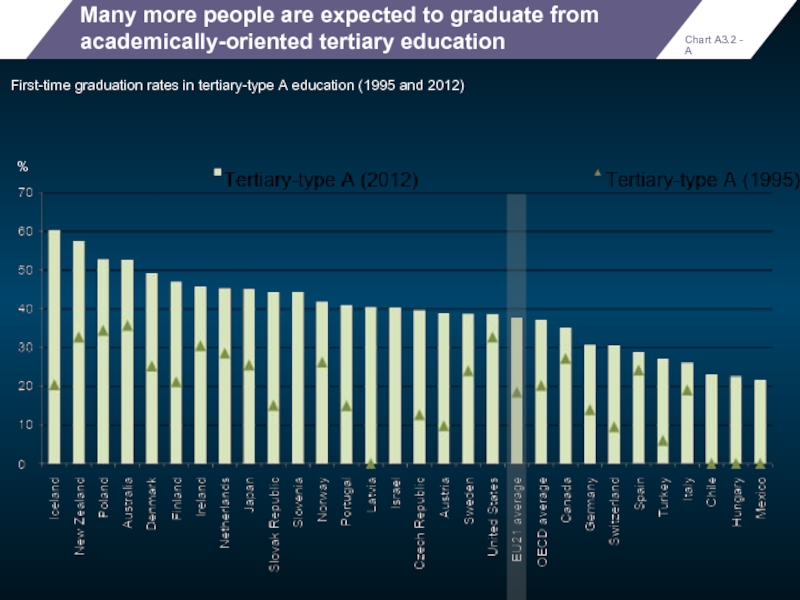
- 20. Many more people are expected to
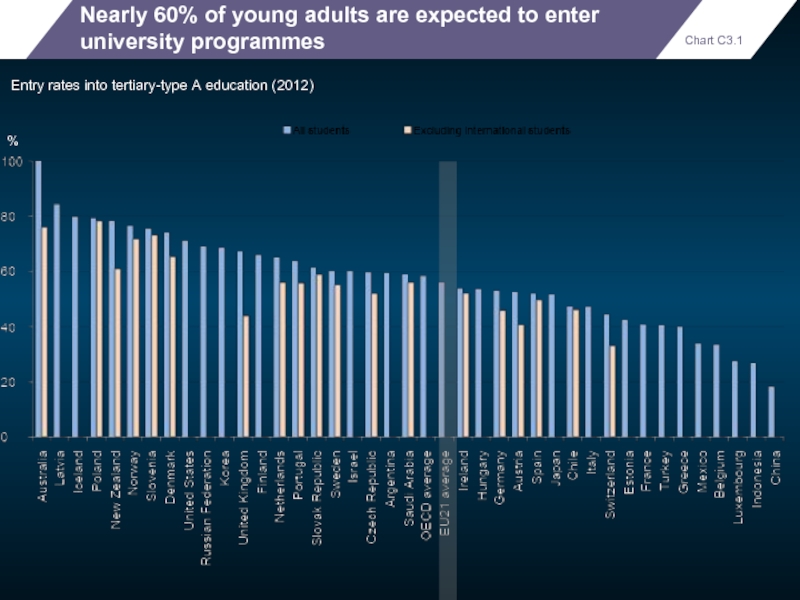
- 21. Nearly 60% of young adults are
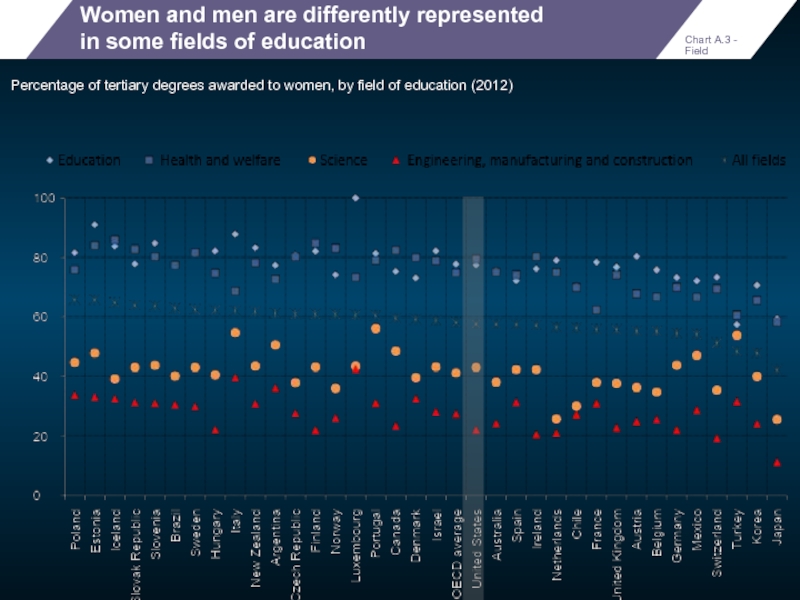
- 22. Women and men are differently represented
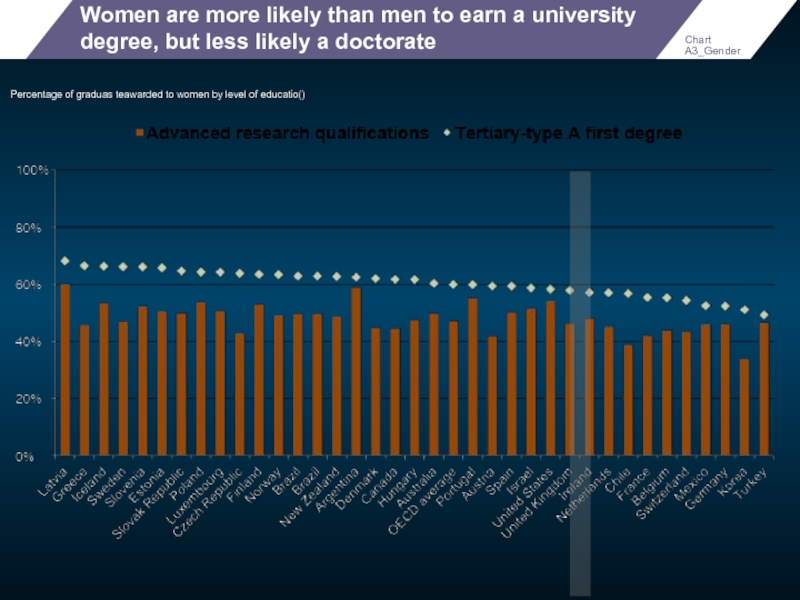
- 23. Women are more likely than men
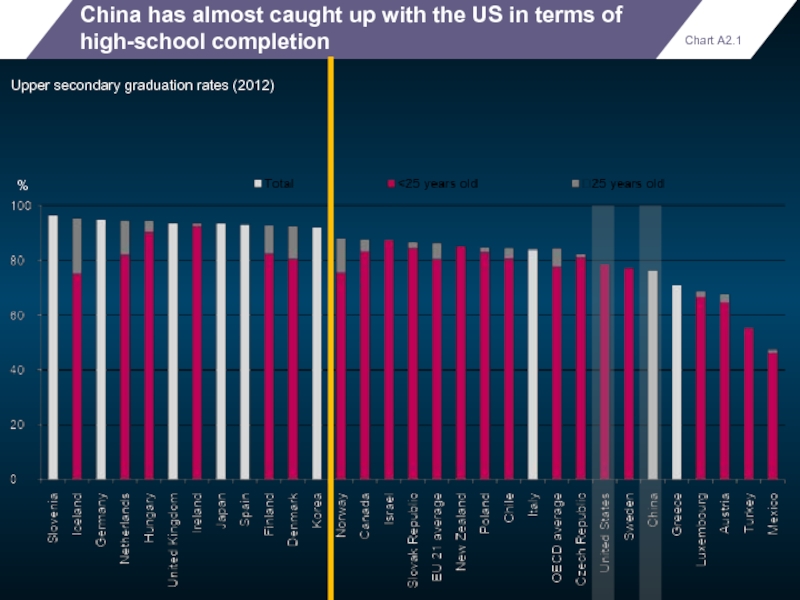
- 24. China has almost caught up with
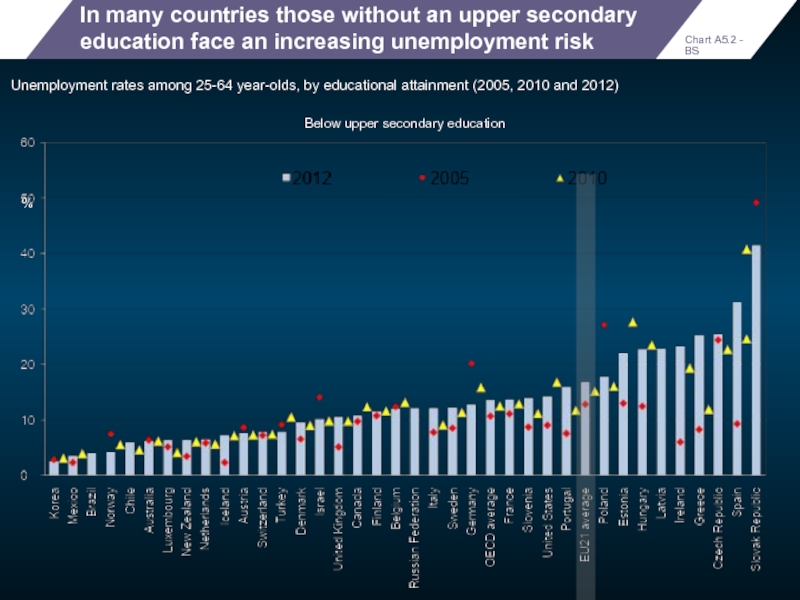
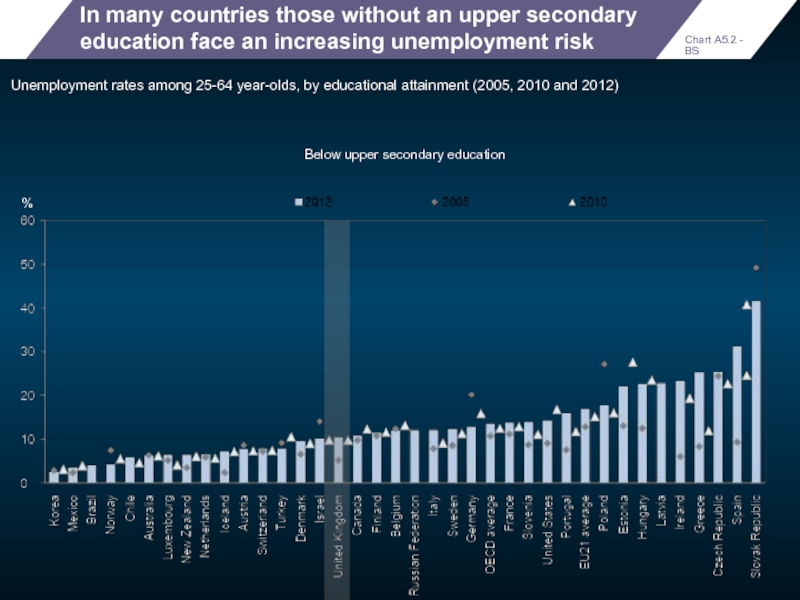
- 25. In many countries those without an
- 26. Qualifications don’t always translate into strong foundation skills
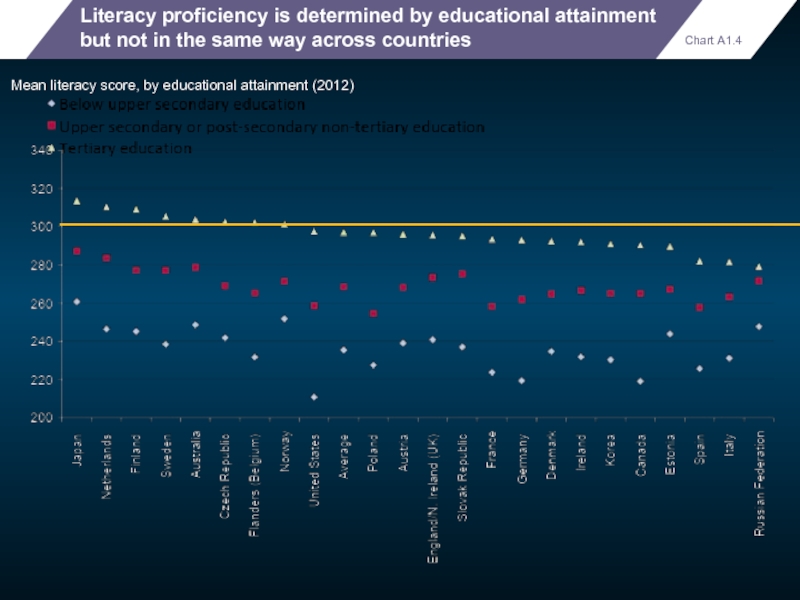
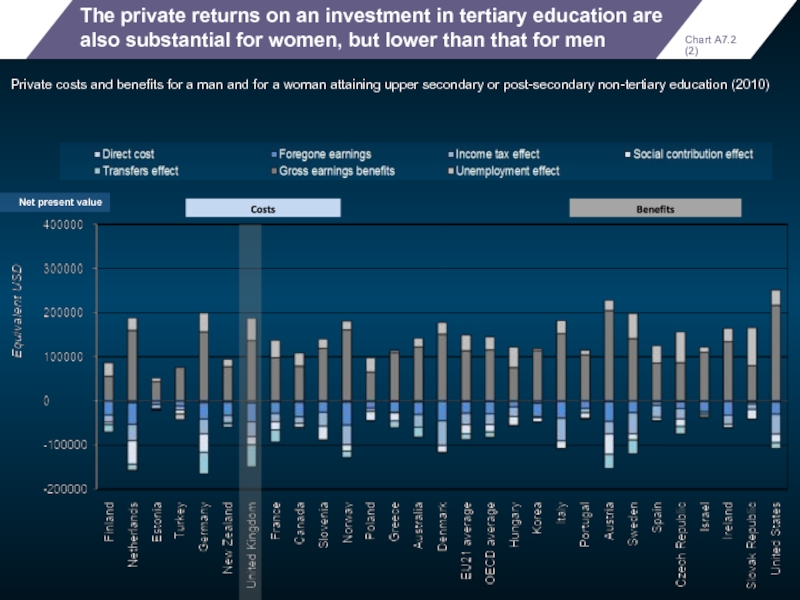
- 27. Literacy proficiency is determined by educational
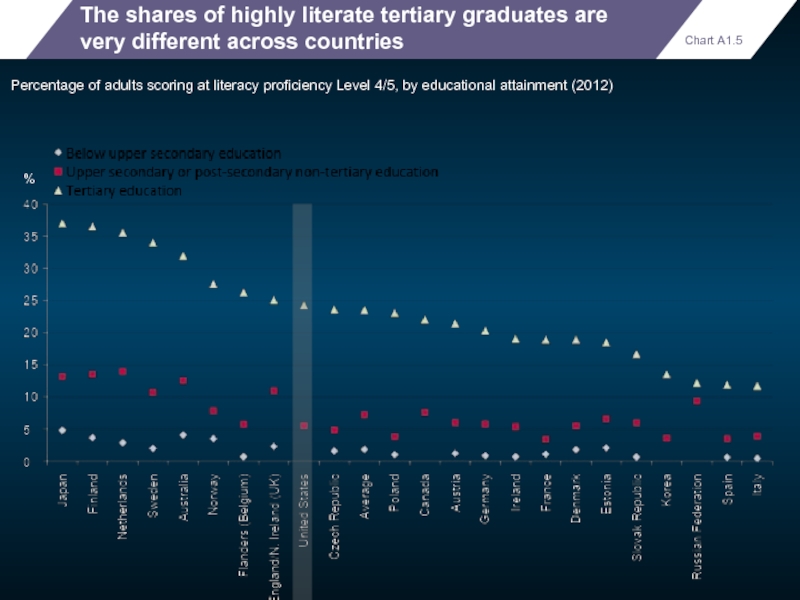
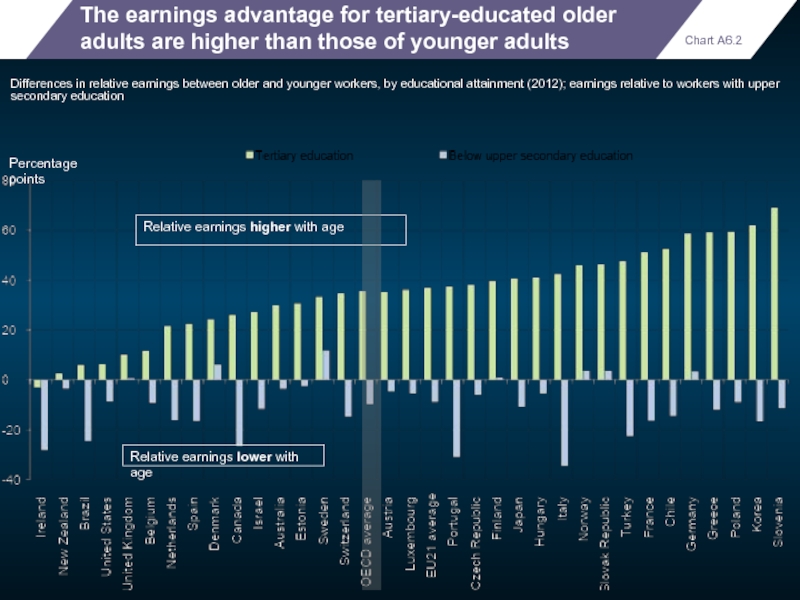
- 28. The shares of highly literate tertiary
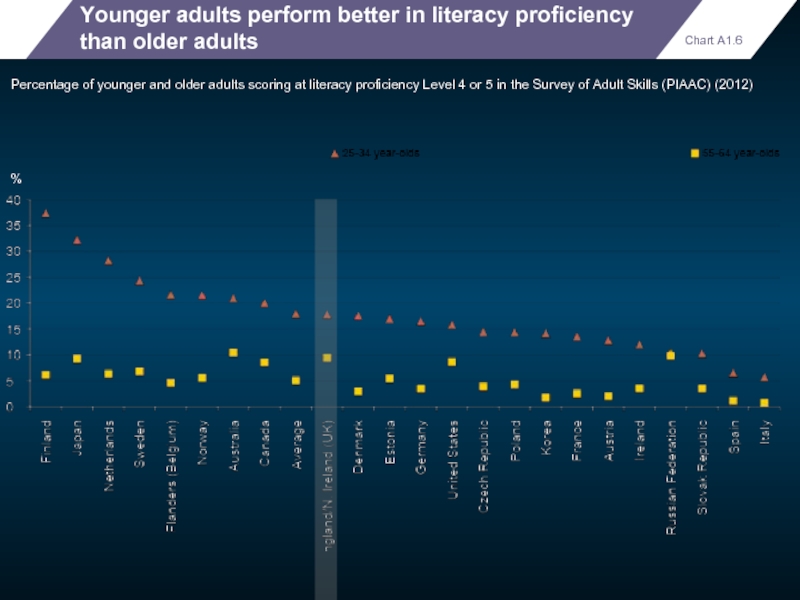
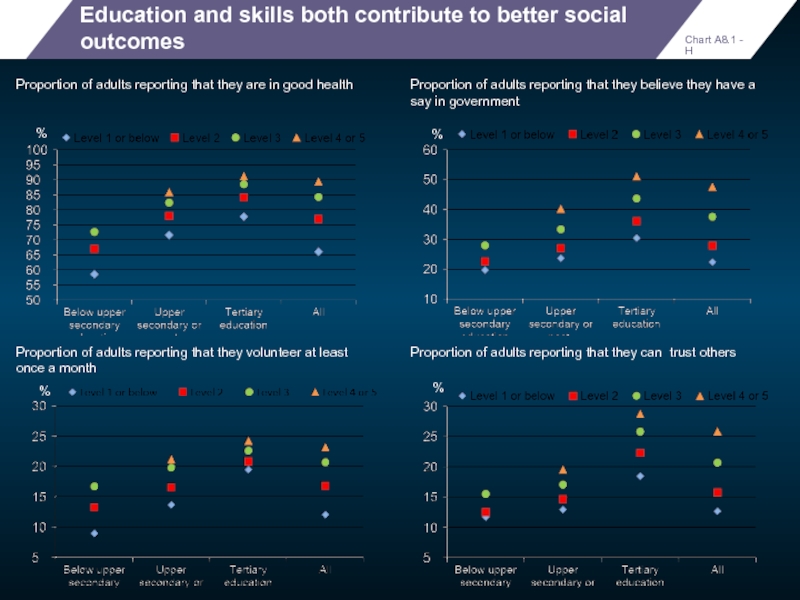
- 29. Younger adults perform better in literacy
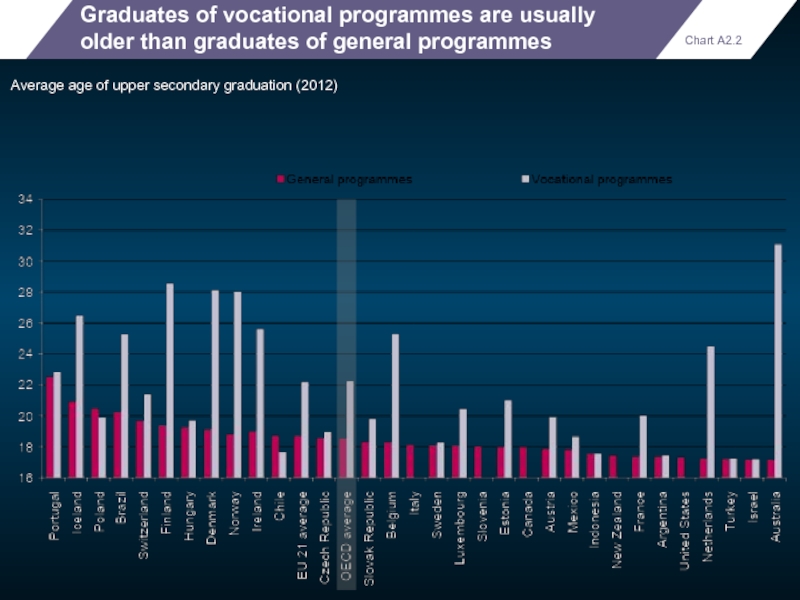
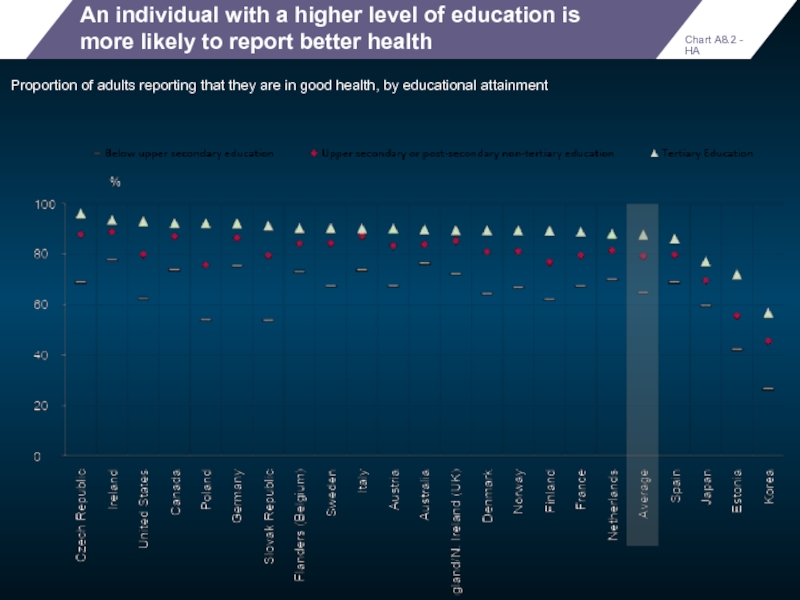
- 30. Graduates of vocational programmes are usually
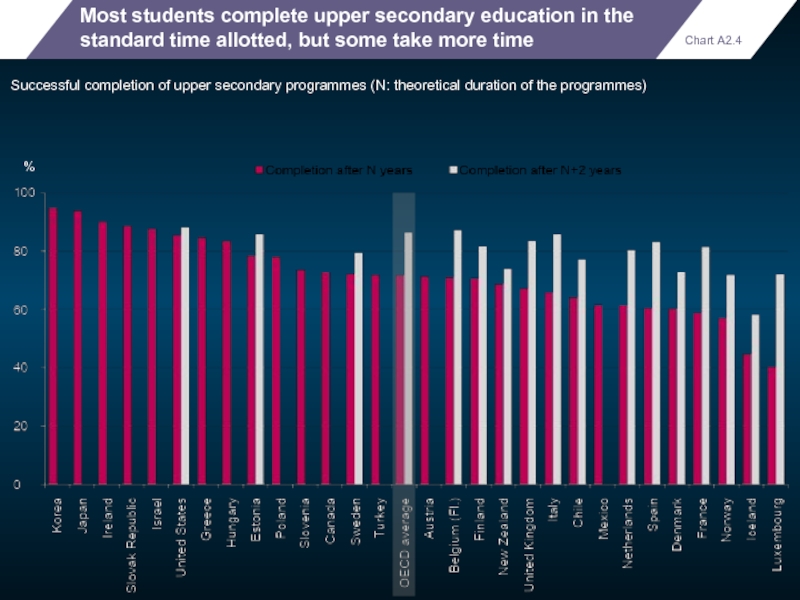
- 31. Most students complete upper secondary education
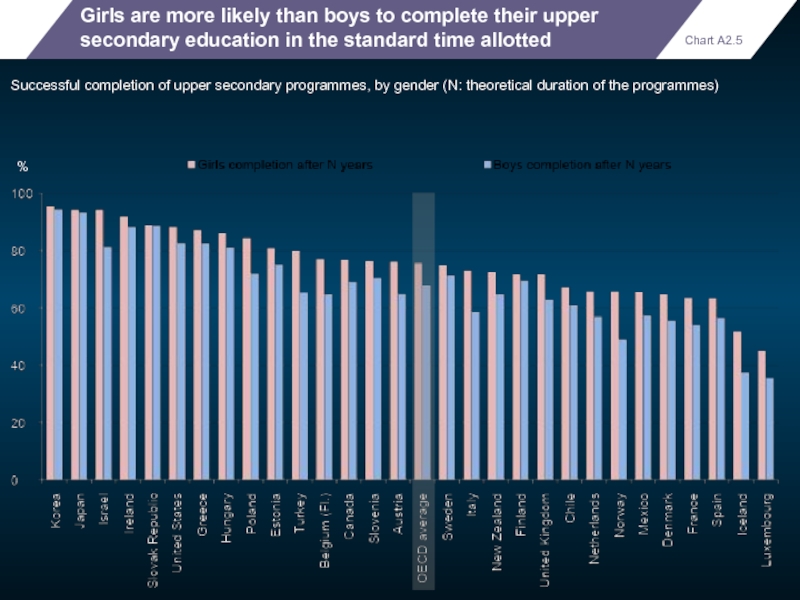
- 32. Girls are more likely than boys
- 33. The rising tide has not lifted all
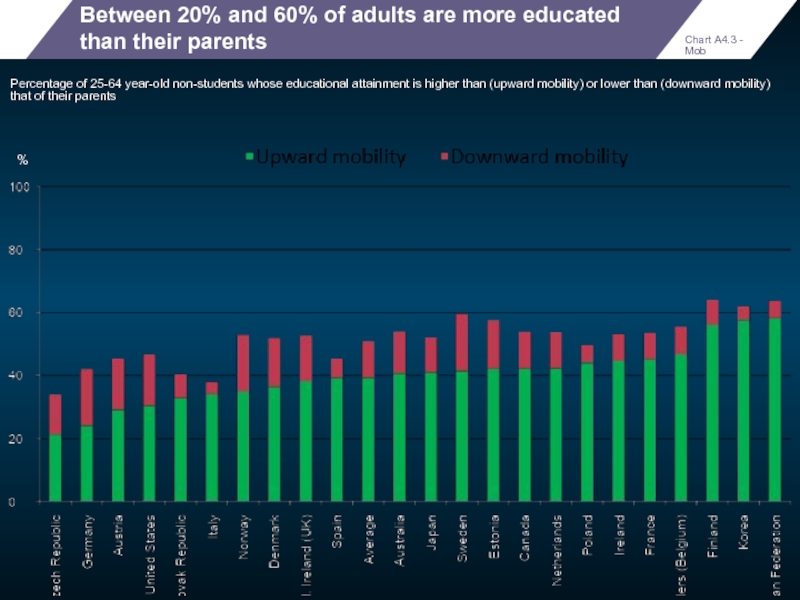
- 34. Between 20% and 60% of adults
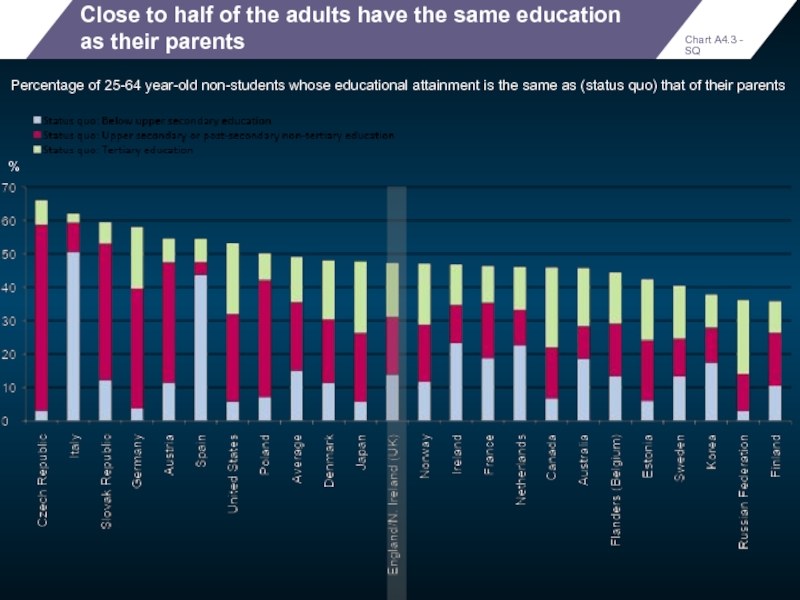
- 35. Close to half of the adults
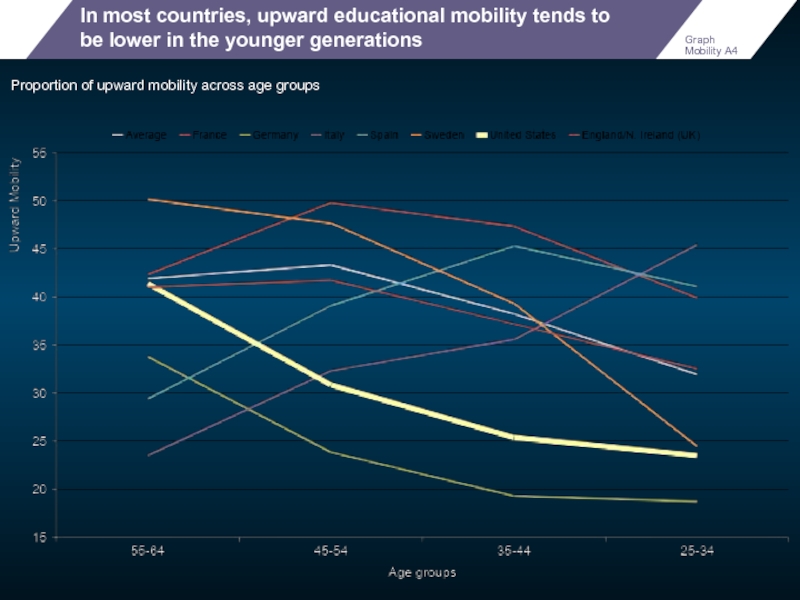
- 36. In most countries, upward educational mobility
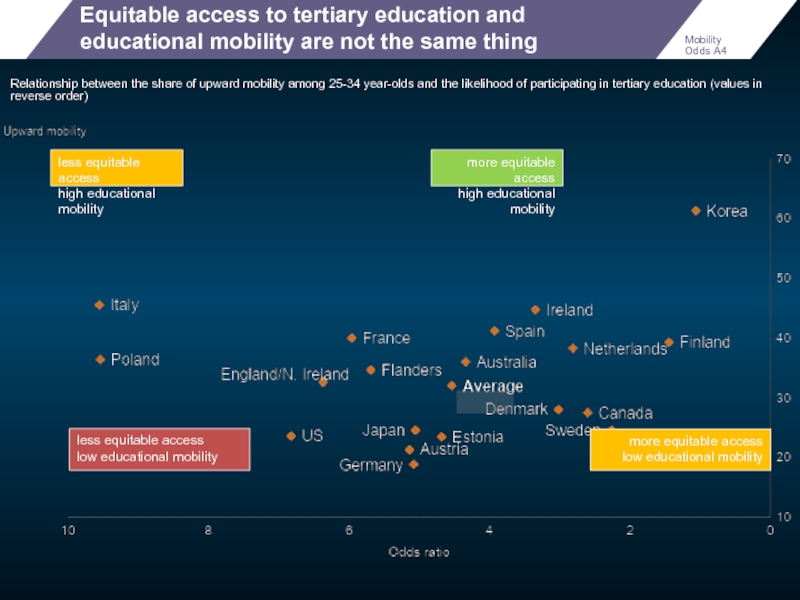
- 37. Equitable access to tertiary education and
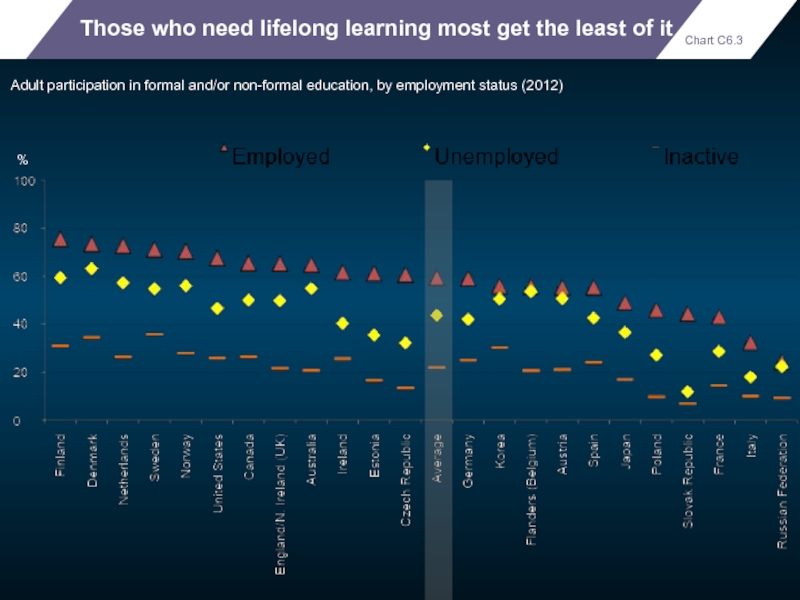
- 38. Those who need lifelong learning most
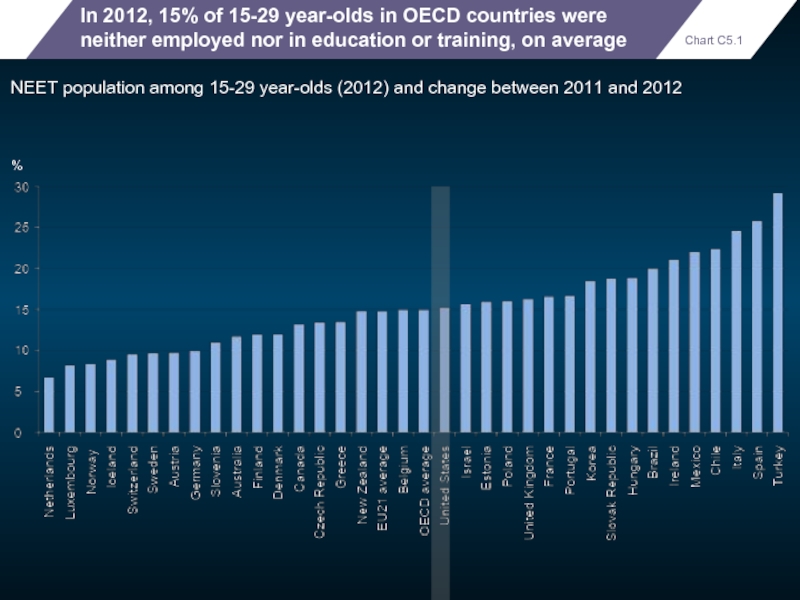
- 39. In 2012, 15% of 15-29 year-olds
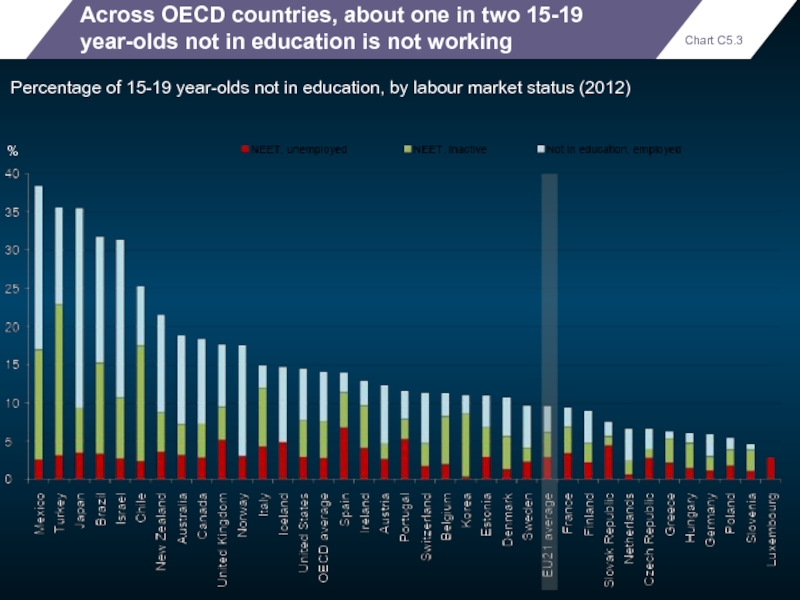
- 40. Across OECD countries, about one in
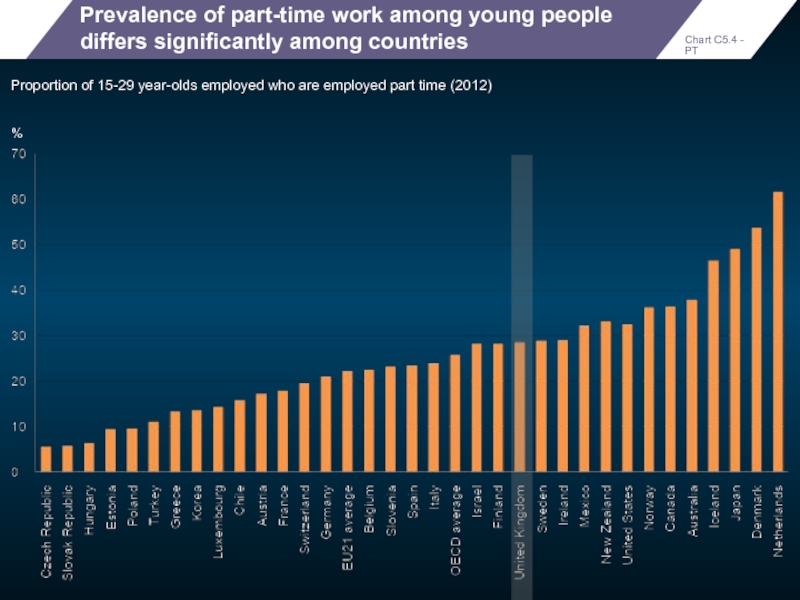
- 41. Prevalence of part-time work among young
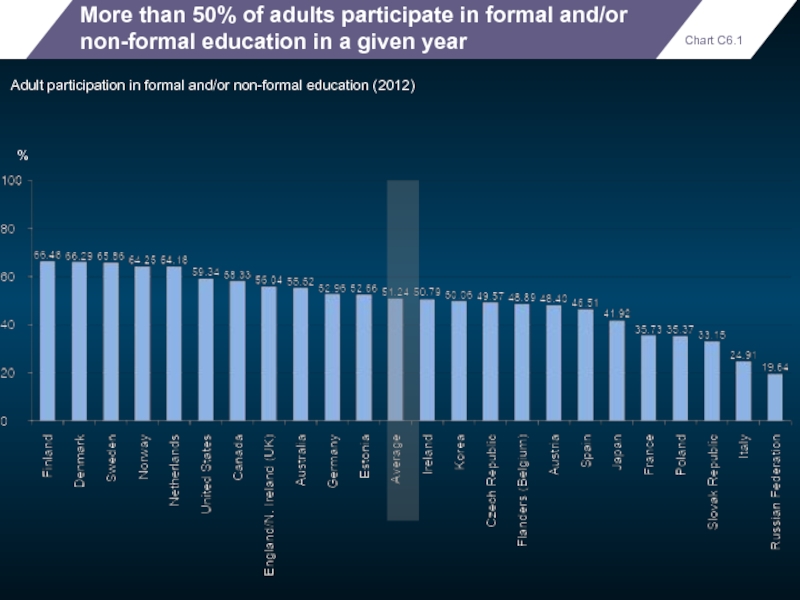
- 42. More than 50% of adults participate
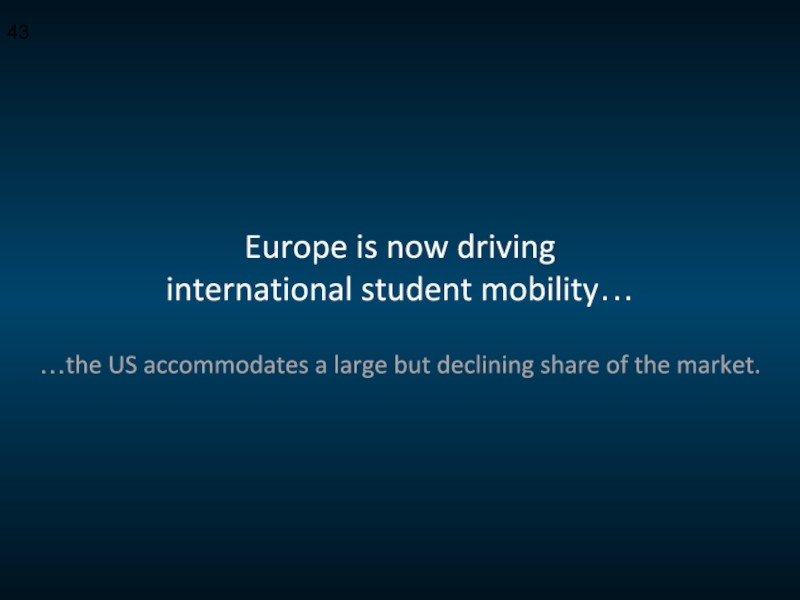
- 43. Europe is now driving international student
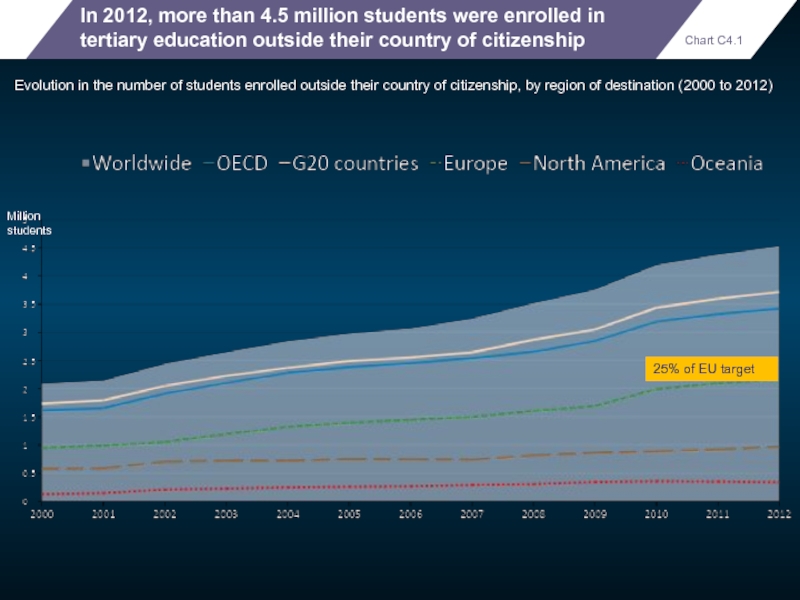
- 44. In 2012, more than 4.5 million
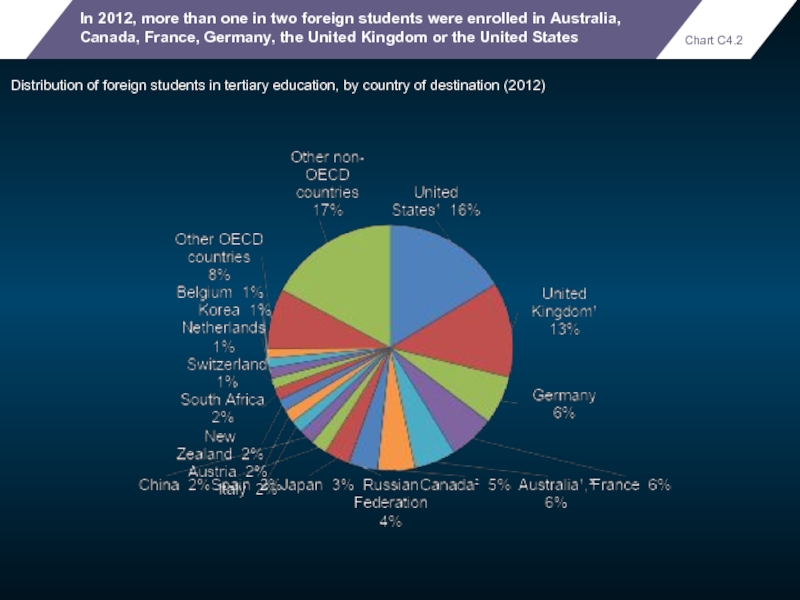
- 45. In 2012, more than one in
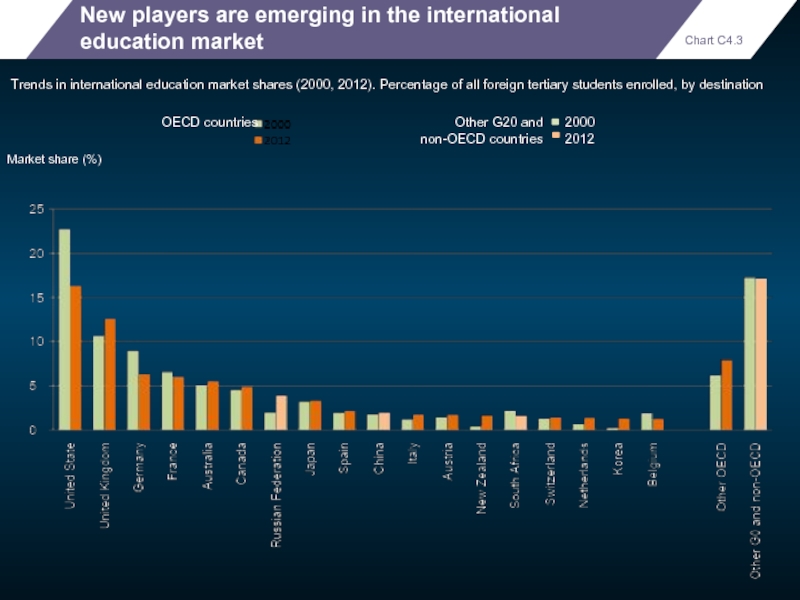
- 46. New players are emerging in the
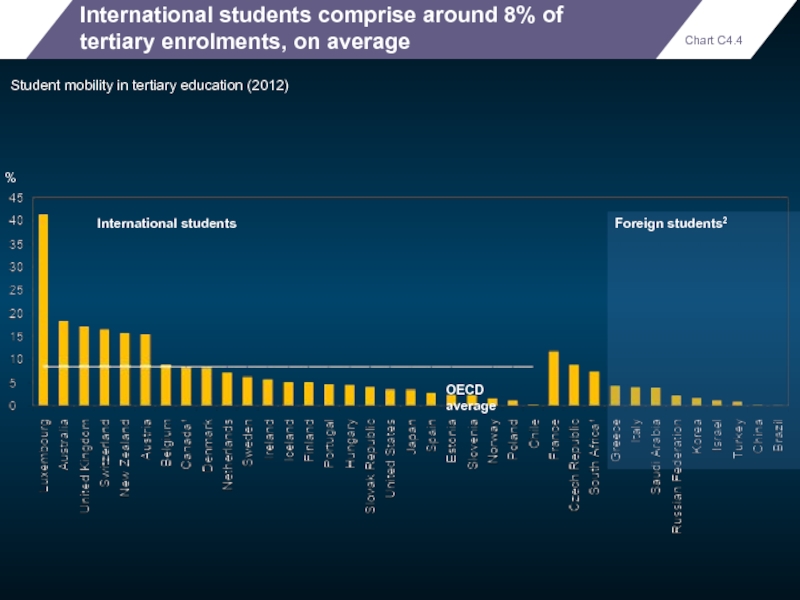
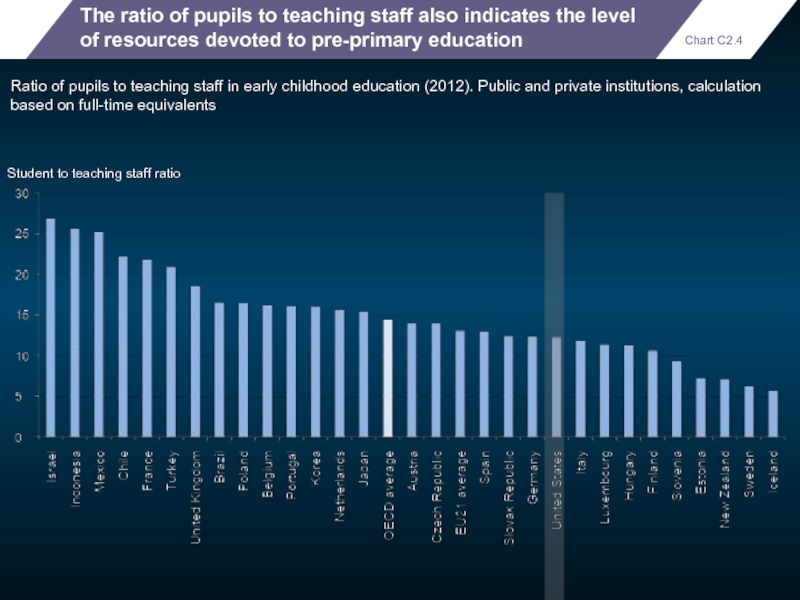
- 47. International students comprise around 8% of
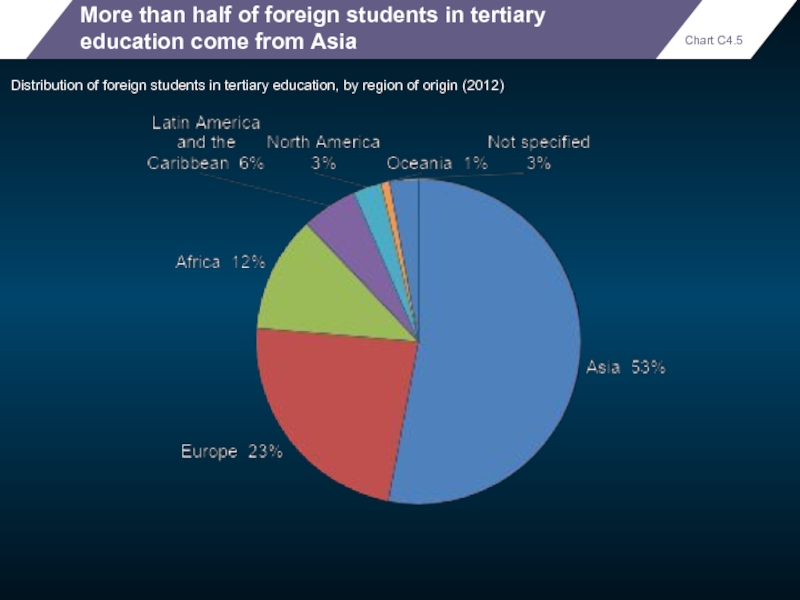
- 48. More than half of foreign students
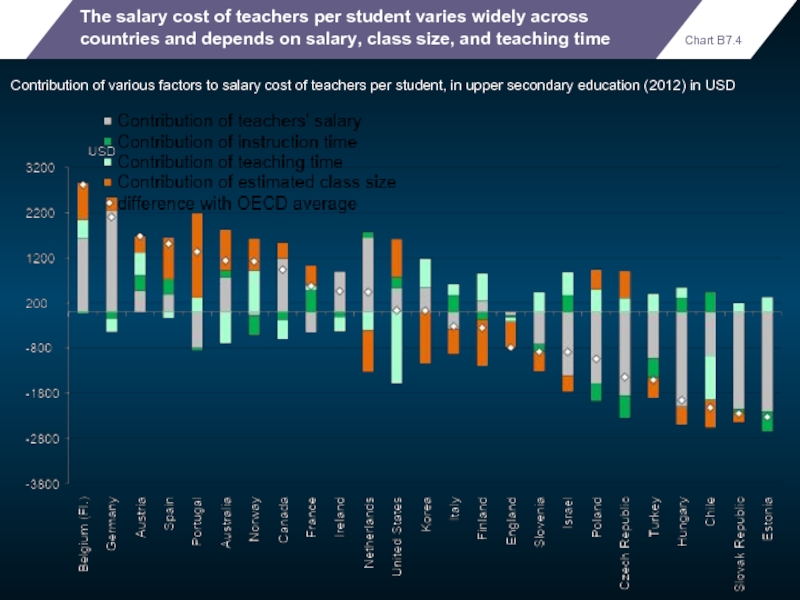
- 49. Education remained a priority during the crisis…
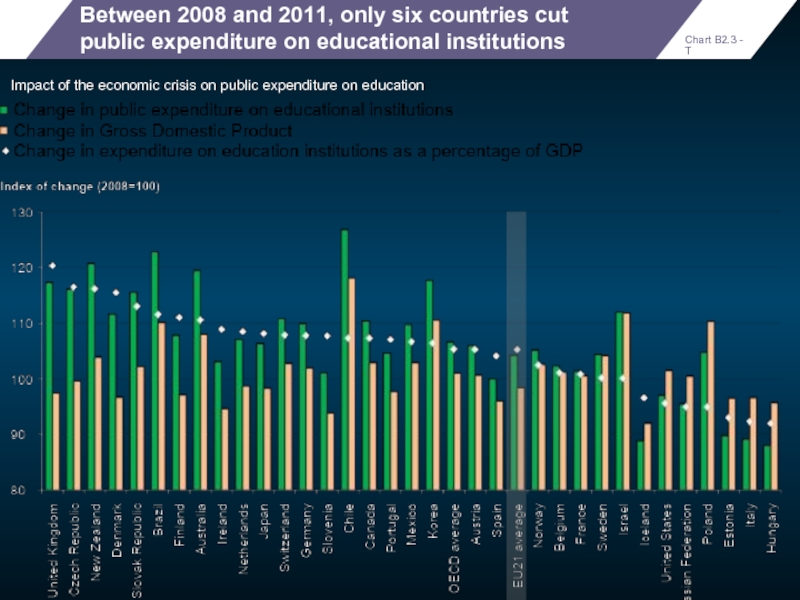
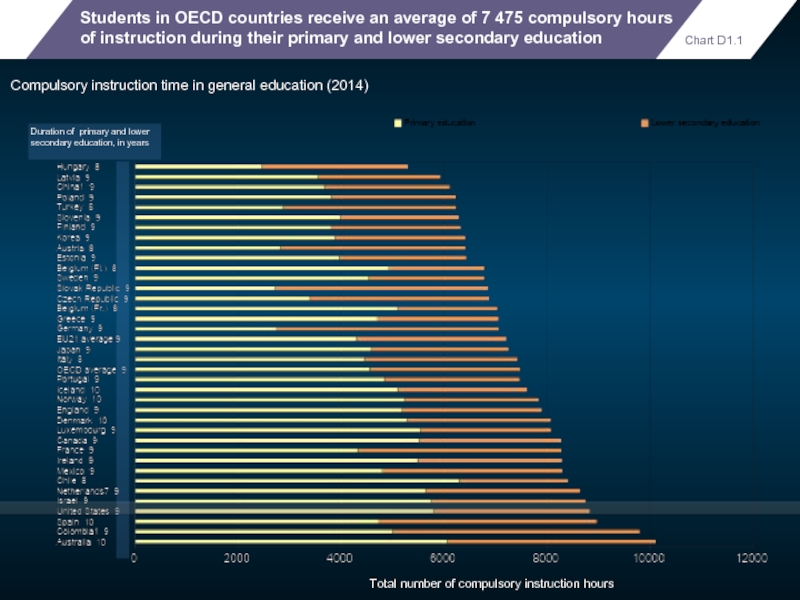
- 50. Between 2008 and 2011, only six
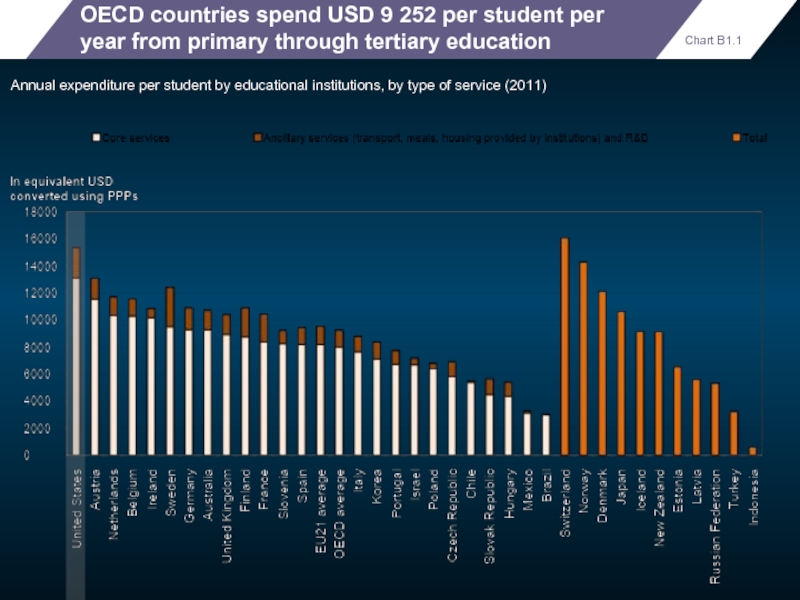
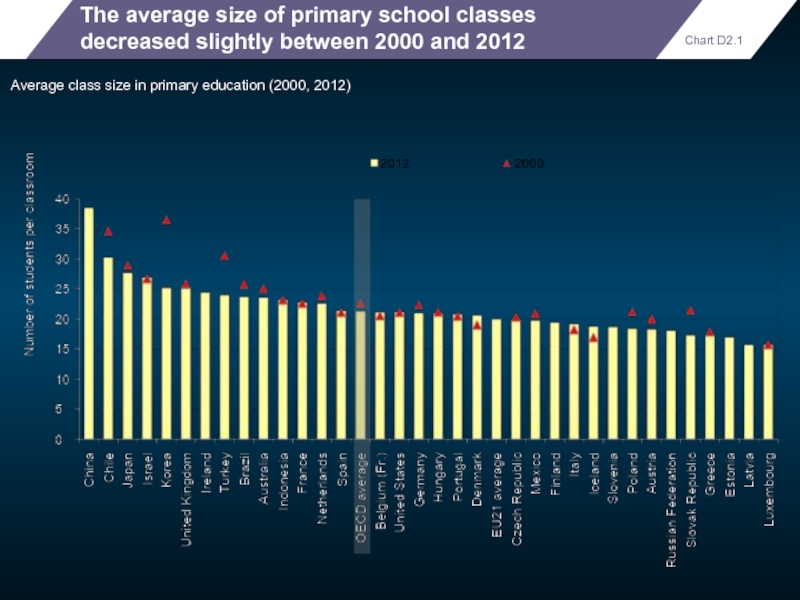
- 51. OECD countries spend USD 9 252
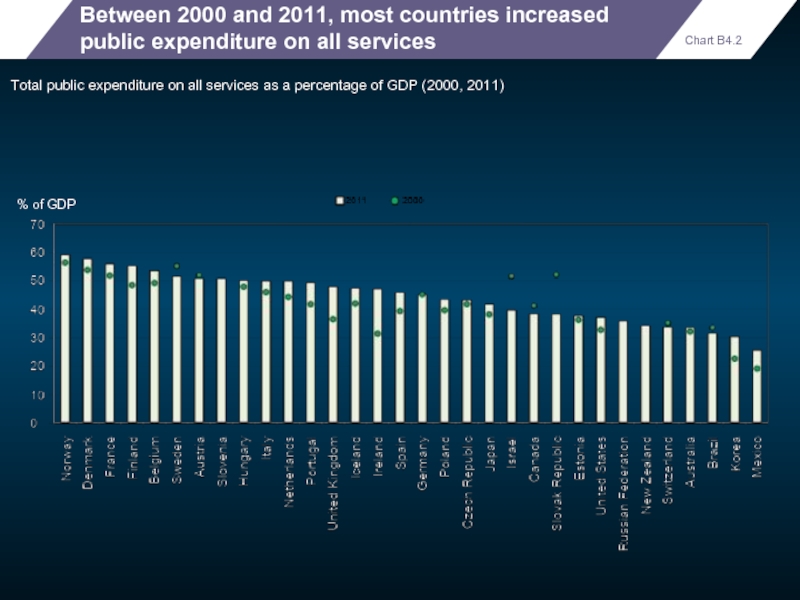
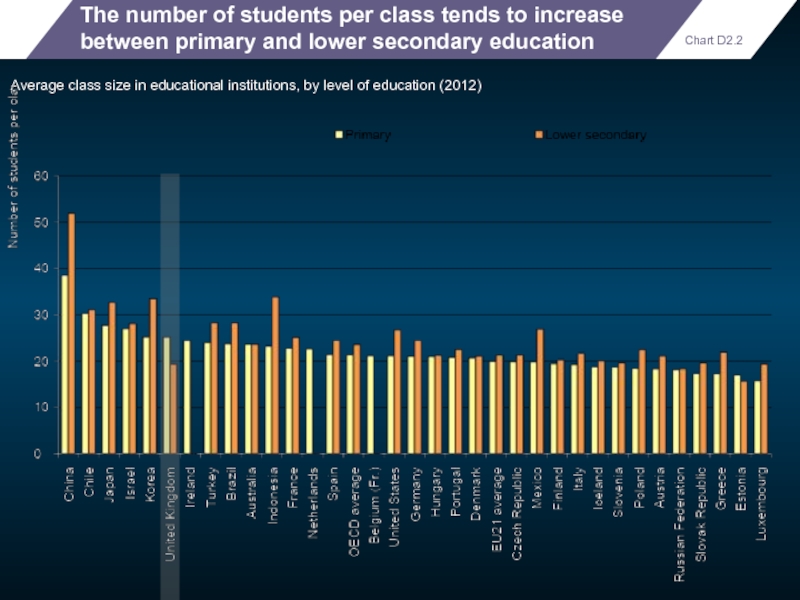
- 52. Between 2000 and 2011, most countries
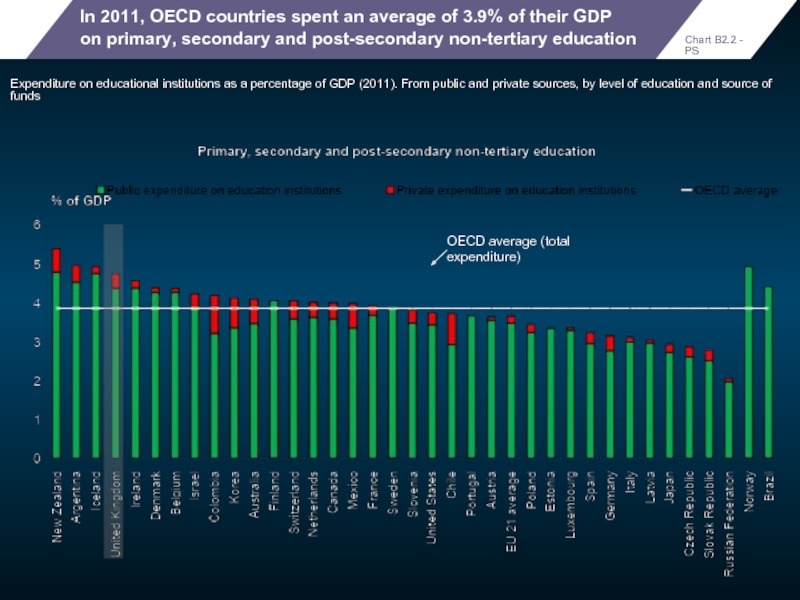
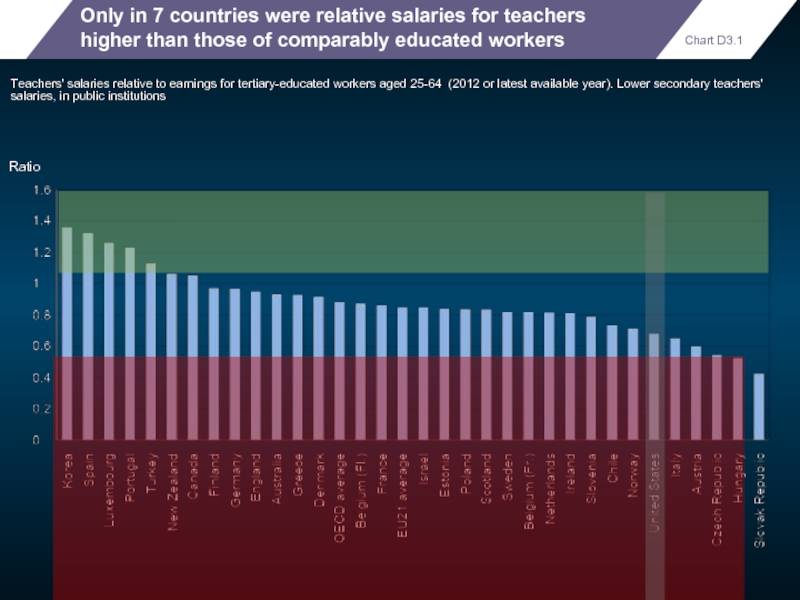
- 53. In 2011, OECD countries spent an
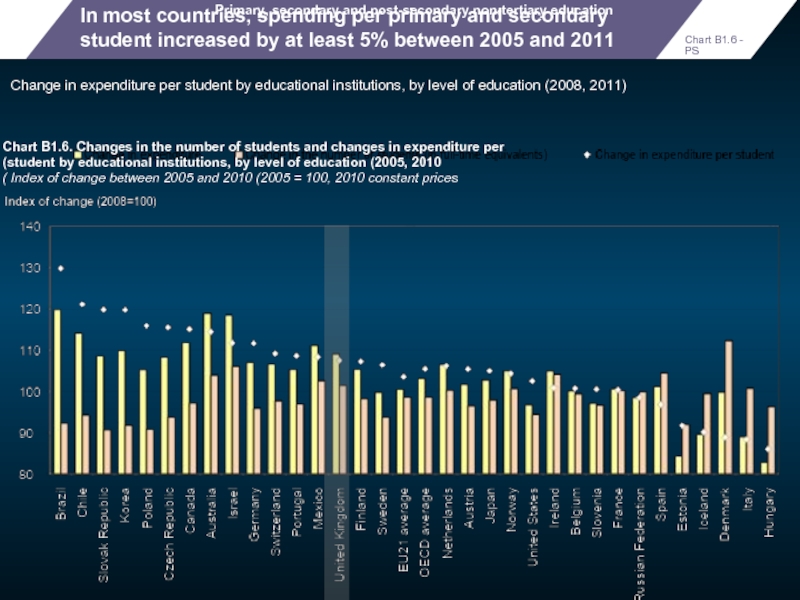
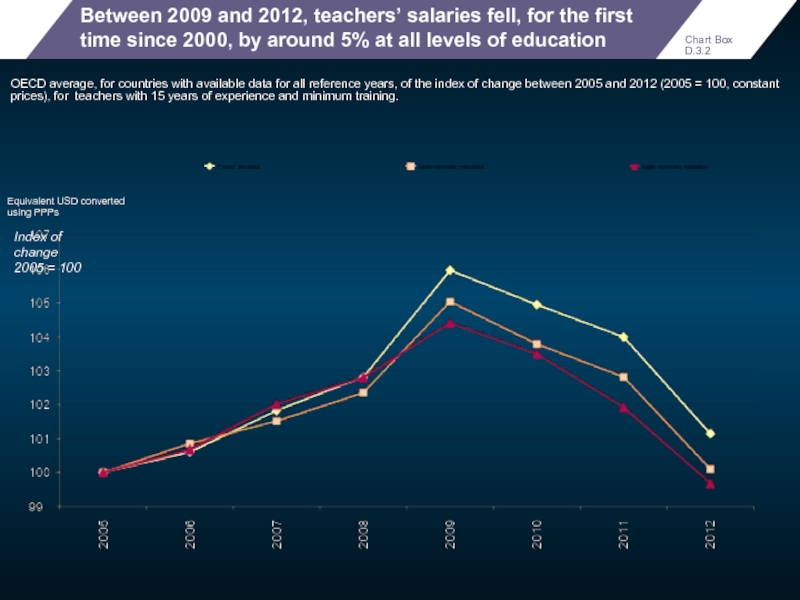
- 54. In most countries, spending per primary
- 55. Expenditure per primary, secondary and post-secondary
- 56. Between 2005 and 2011, expenditure per
- 57. In 2011, OECD countries spent an
- 58. As enrolment increased faster than expenditure,
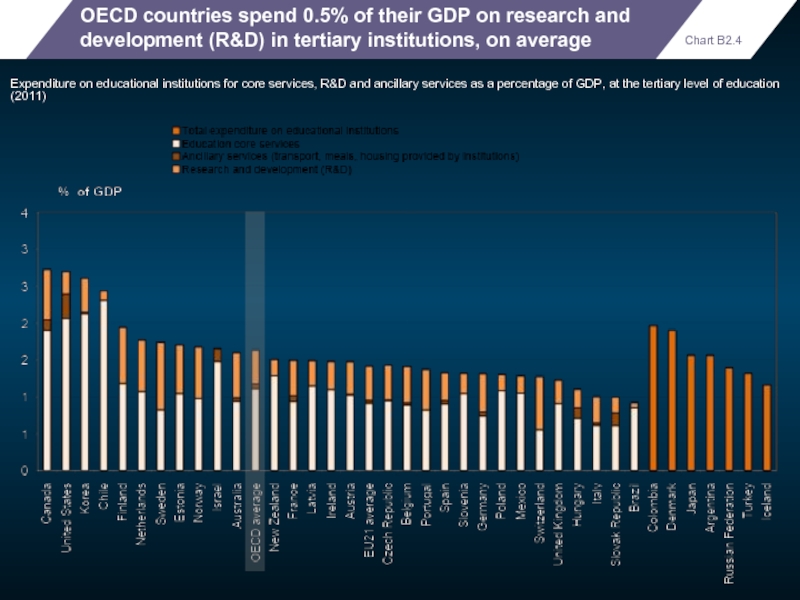
- 59. OECD countries spend 0.5% of their
- 60. Few European countries have sustainable financing for tertiary education
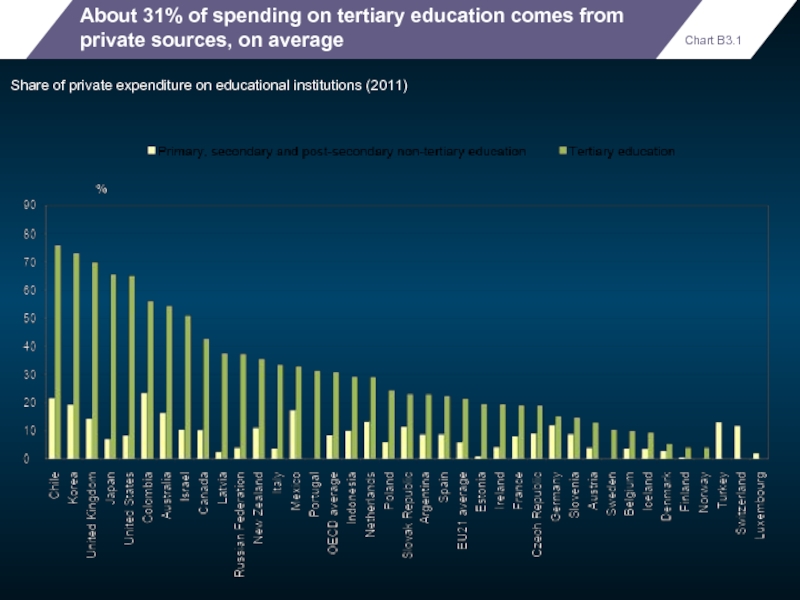
- 61. About 31% of spending on tertiary
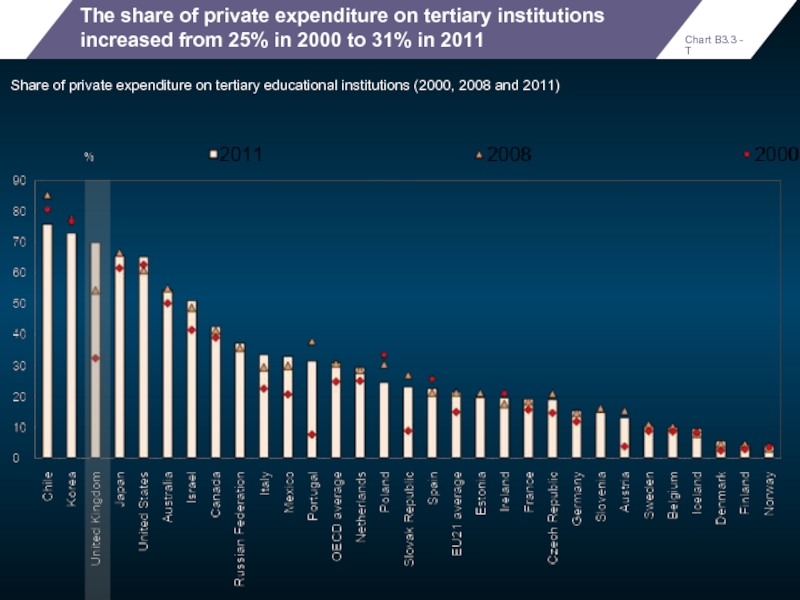
- 62. The share of private expenditure on
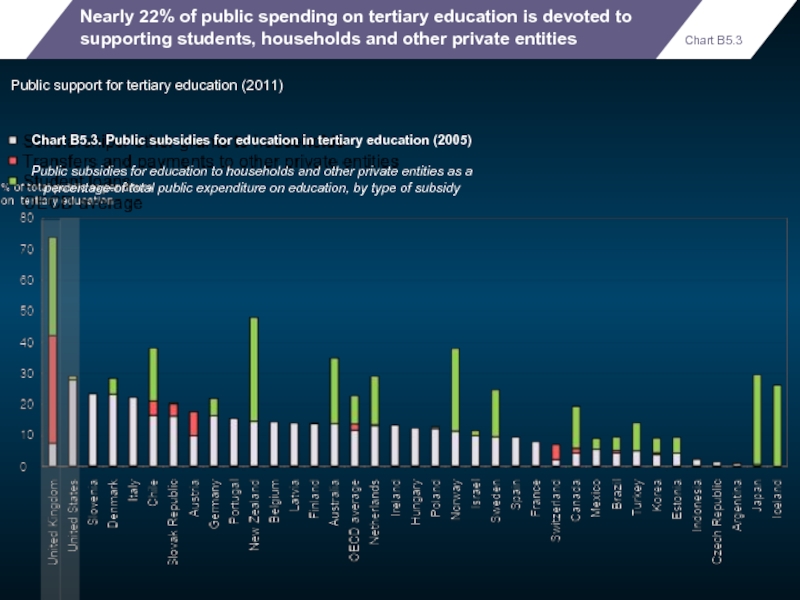
- 63. Nearly 22% of public spending on
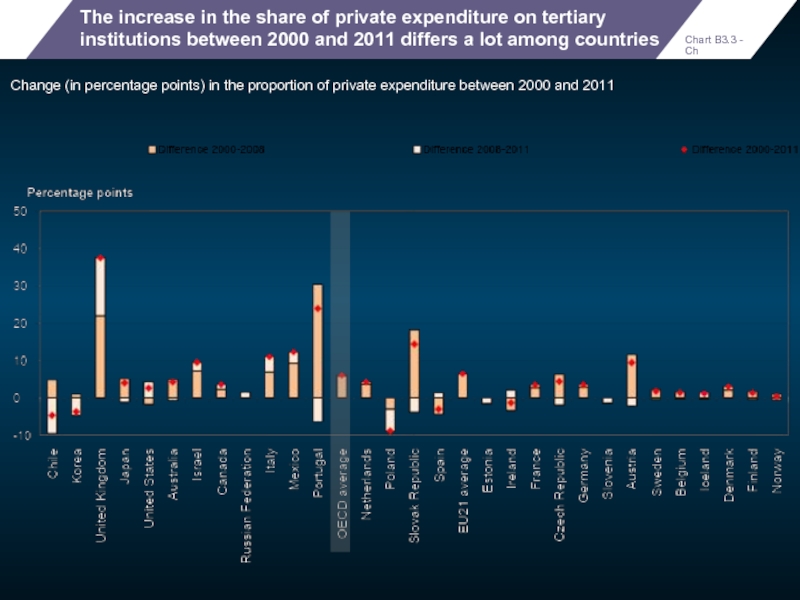
- 64. The increase in the share of
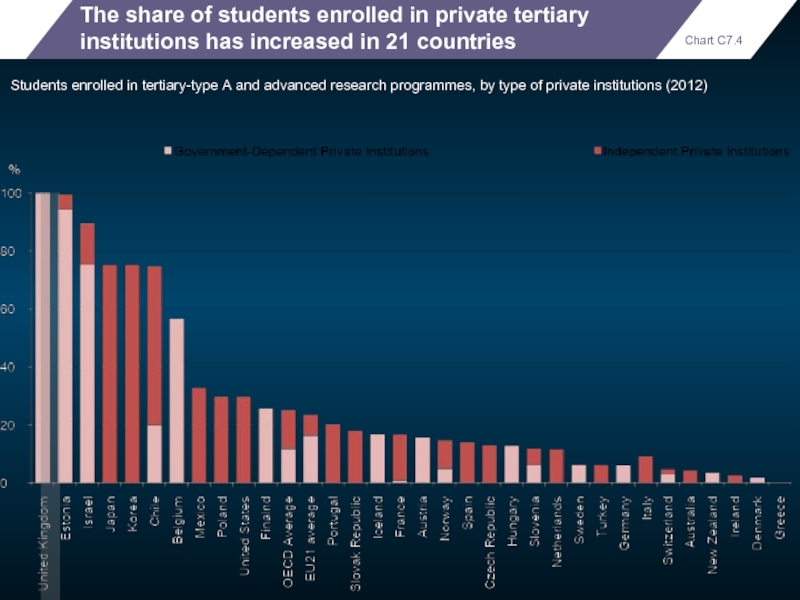
- 65. The share of students enrolled in
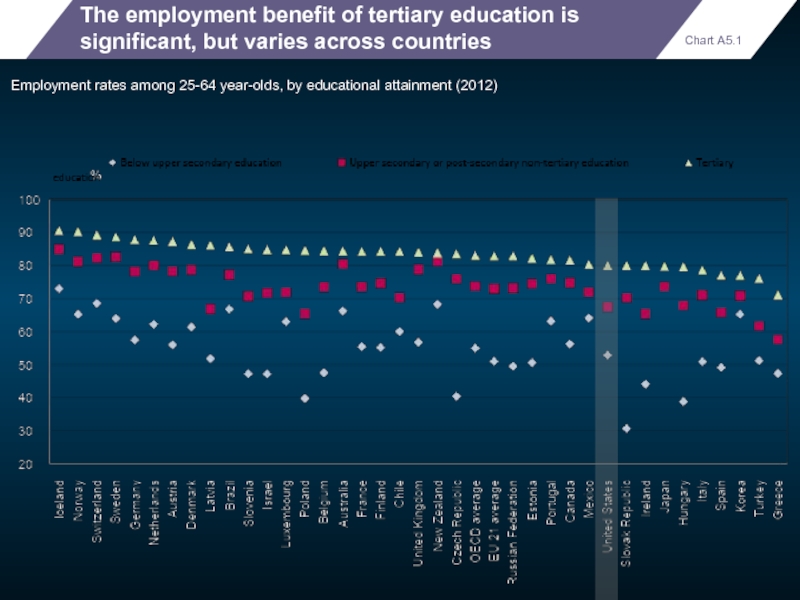
- 66. The employment benefit of tertiary education
- 67. In many countries those without an
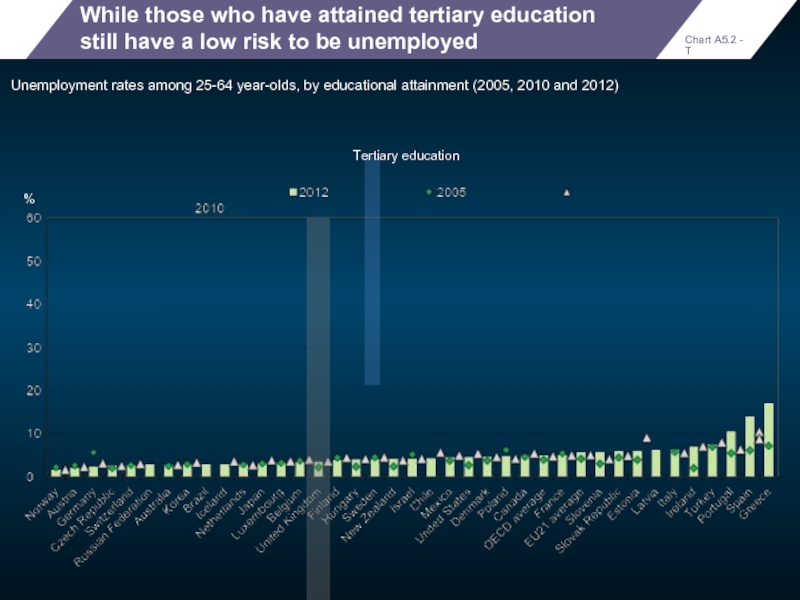
- 68. While those who have attained tertiary
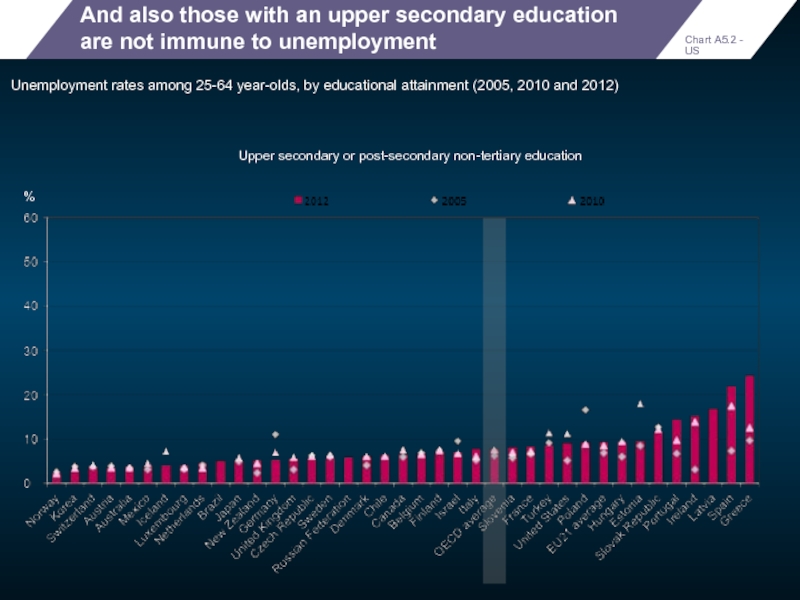
- 69. And also those with an upper
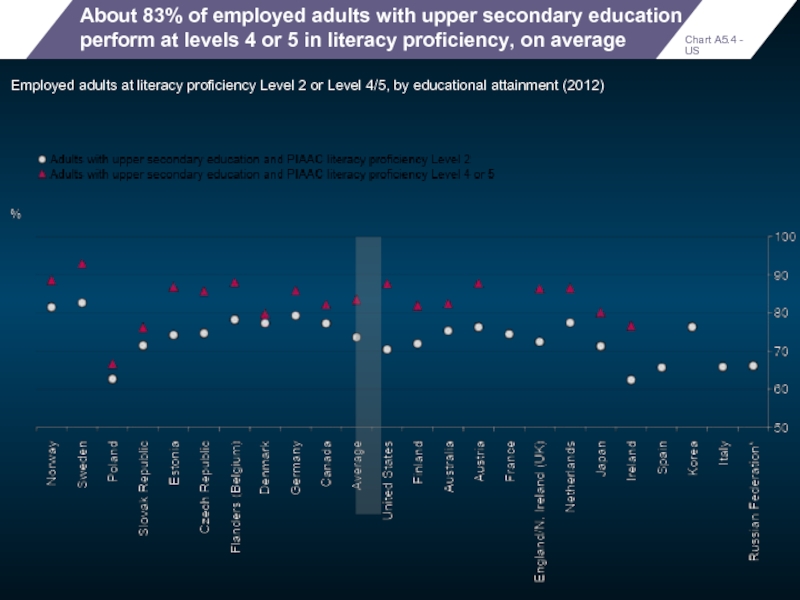
- 70. About 83% of employed adults with
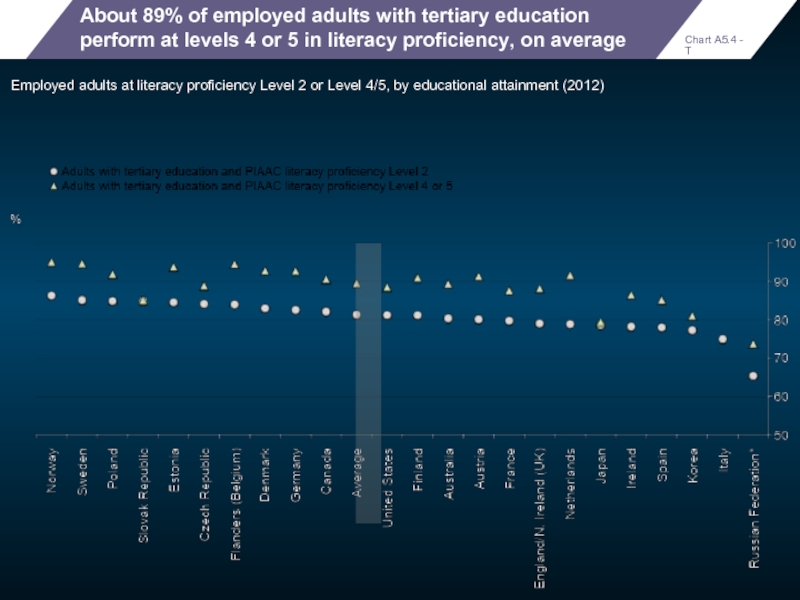
- 71. About 89% of employed adults with
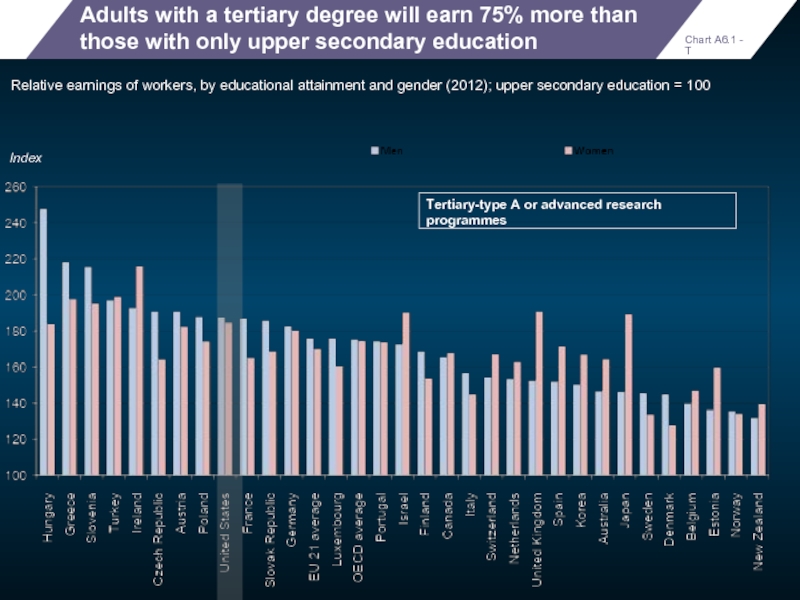
- 72. Adults with a tertiary degree will
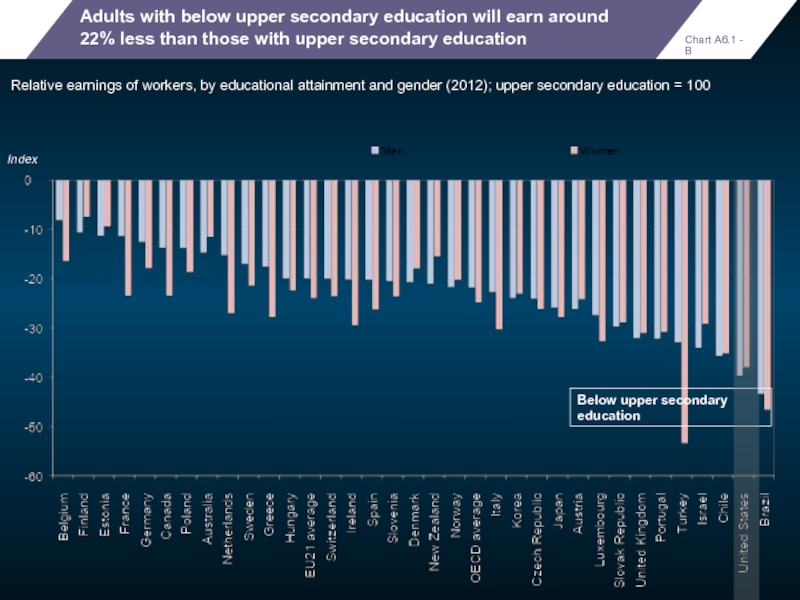
- 73. Adults with below upper secondary education
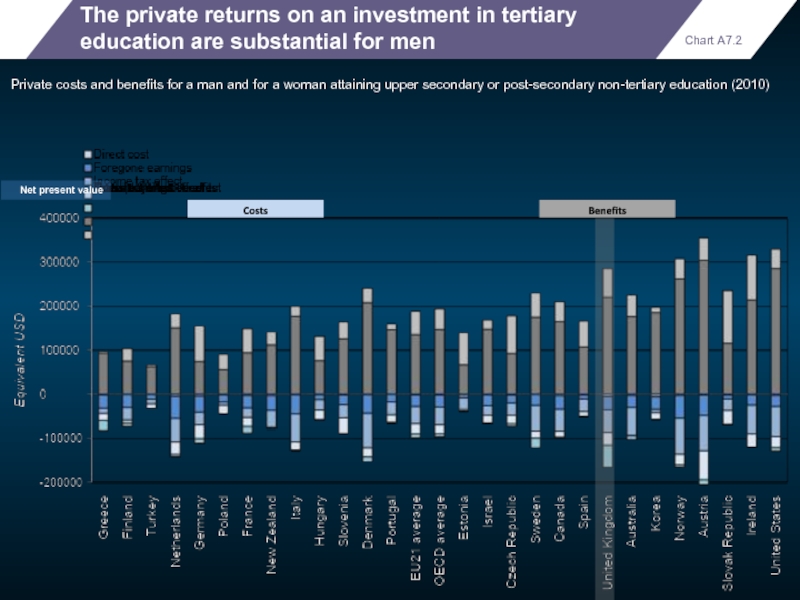
- 74. The private returns on an investment
- 75. The private returns on an investment
- 76. The earnings advantage for tertiary-educated older
- 77. Education and skills both contribute to better
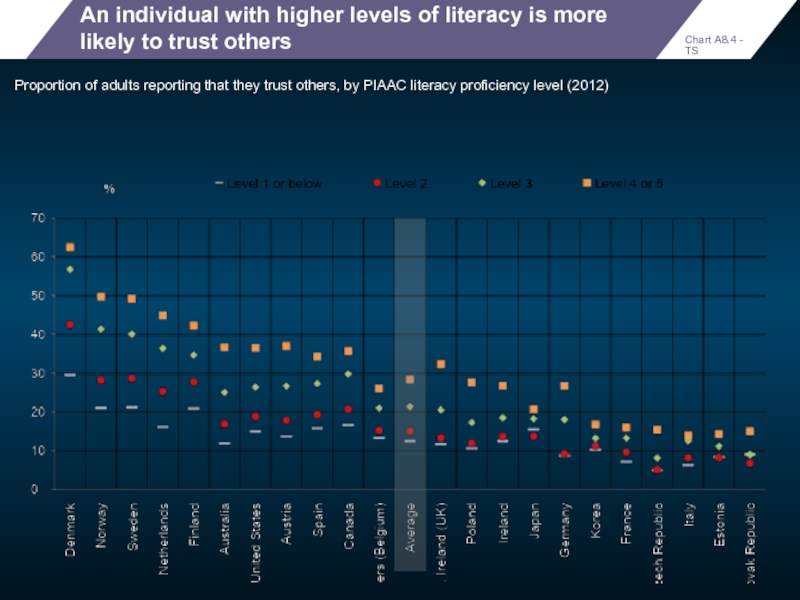
- 78. An individual with a higher level
- 79. An individual with higher levels of
- 80. An individual with a higher level
- 81. An individual with higher levels of
- 82. An individual with a higher level
- 83. An individual with higher levels of
- 84. An individual with a higher level
- 85. An individual with higher levels of
- 86. The net public return on investment
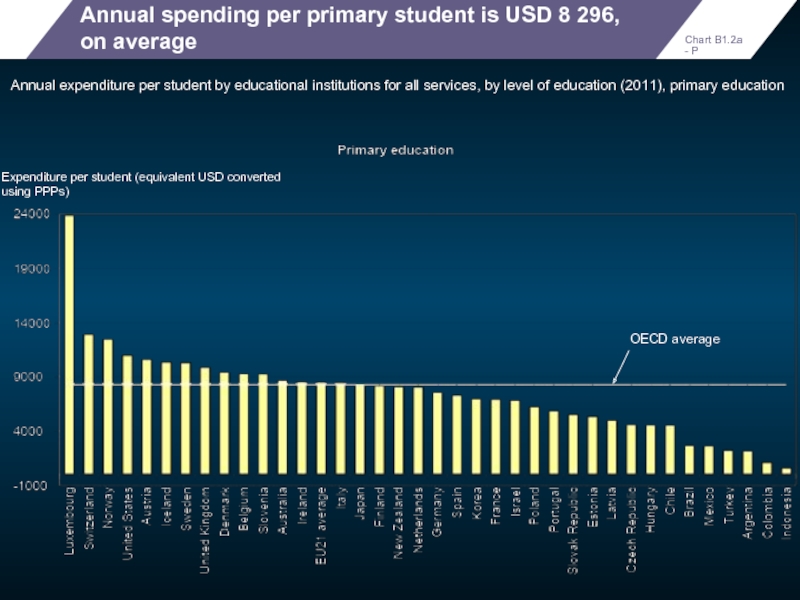
- 87. Annual spending per primary student is
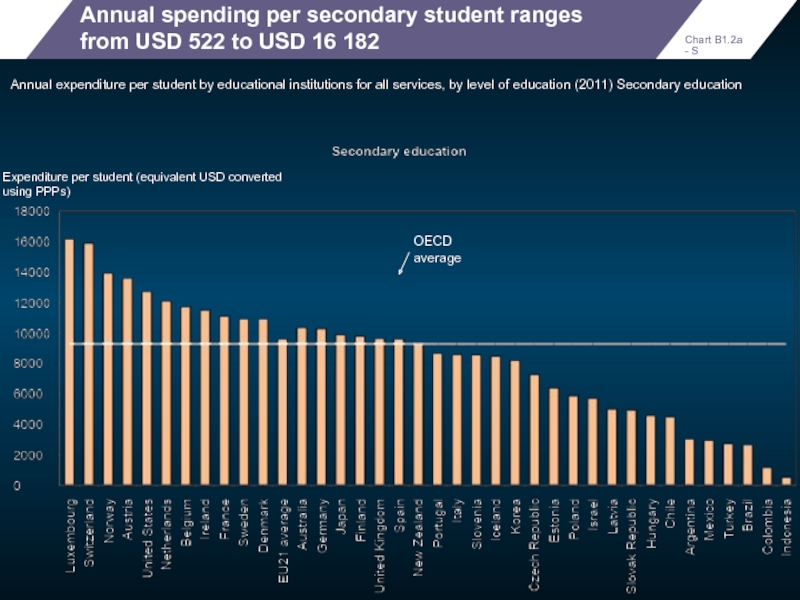
- 88. Annual spending per secondary student ranges
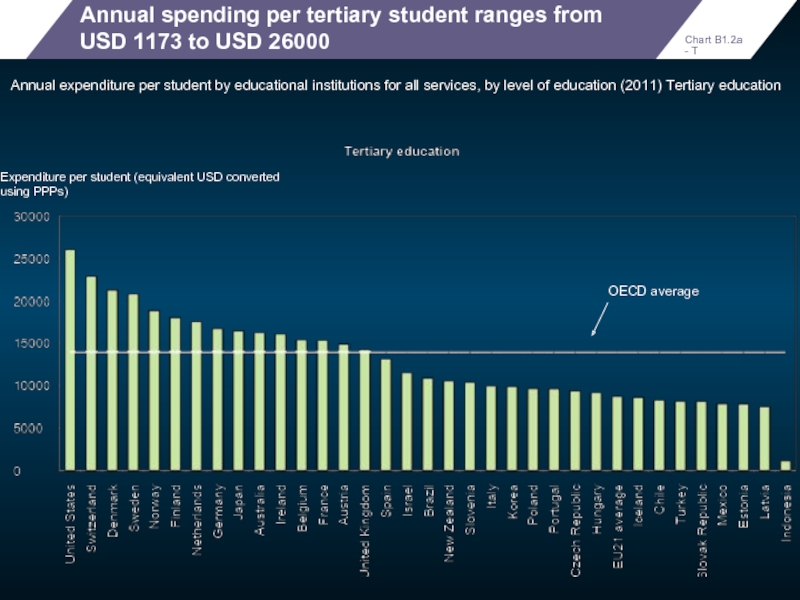
- 89. Annual spending per tertiary student ranges
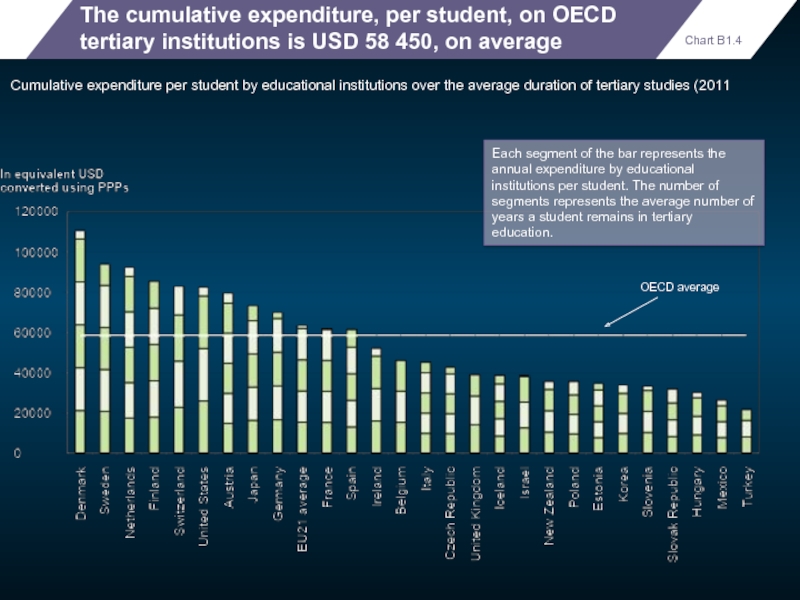
- 90. The cumulative expenditure, per student, on
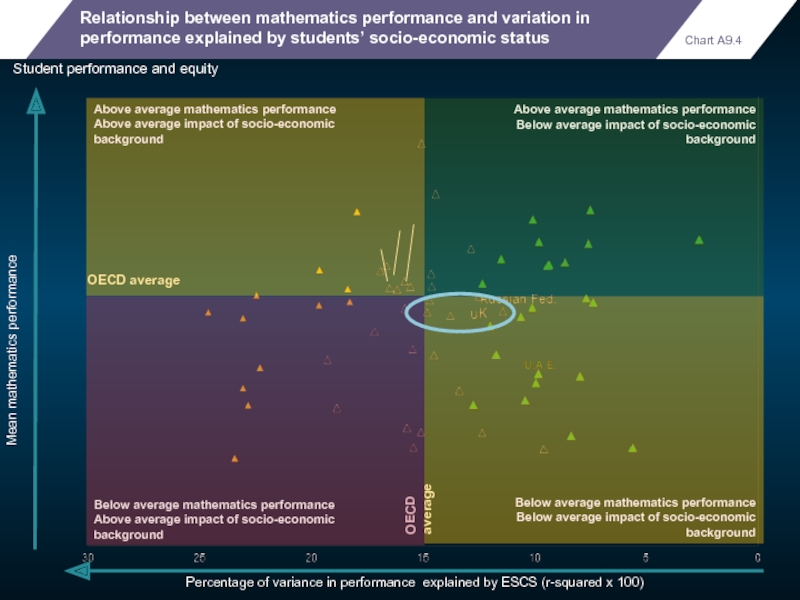
- 91. Chart A9.4 Student performance and equity
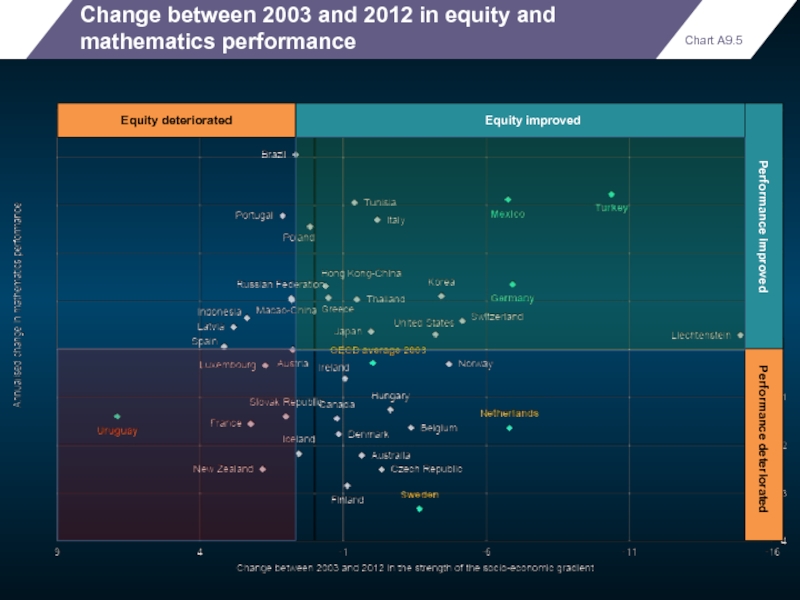
- 92. Chart A9.5 Change between 2003 and 2012
- 93. Good progress in raising early childhood participation Several EU countries have surpassed 2020 targets
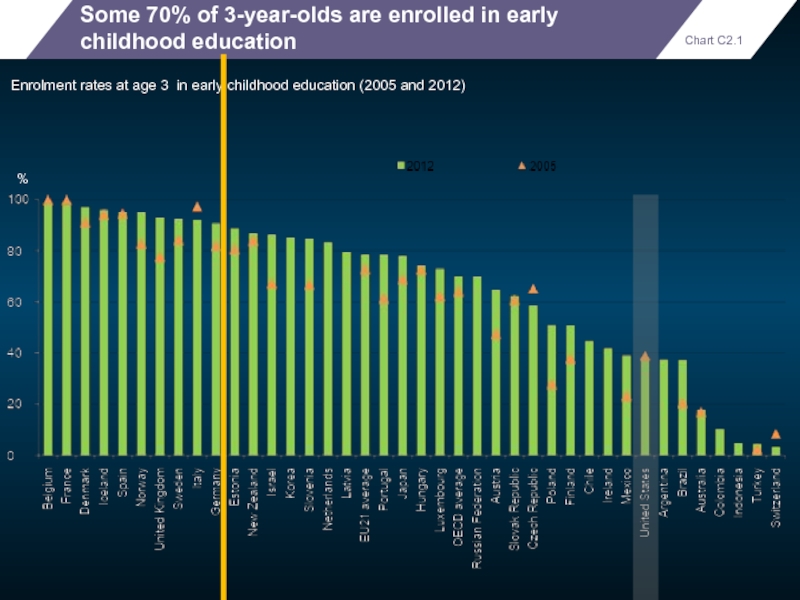
- 94. Some 70% of 3-year-olds are enrolled
- 95. The ratio of pupils to teaching
- 96. Countries spend their money differently on schools…
- 97. The salary cost of teachers per
- 98. Students in OECD countries receive an
- 99. The average size of primary school
- 100. The number of students per class
- 101. Only in 7 countries were relative
- 102. Between 2009 and 2012, teachers’ salaries
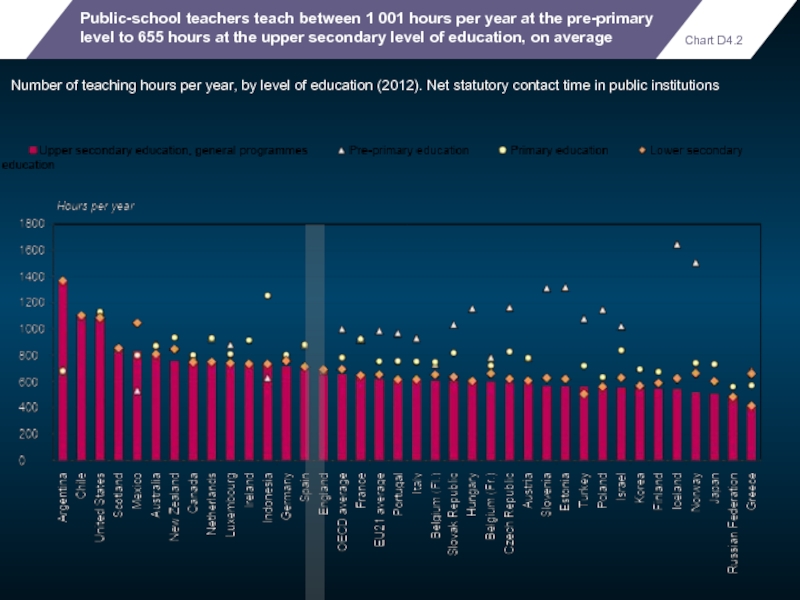
- 103. Public-school teachers teach between 1 001
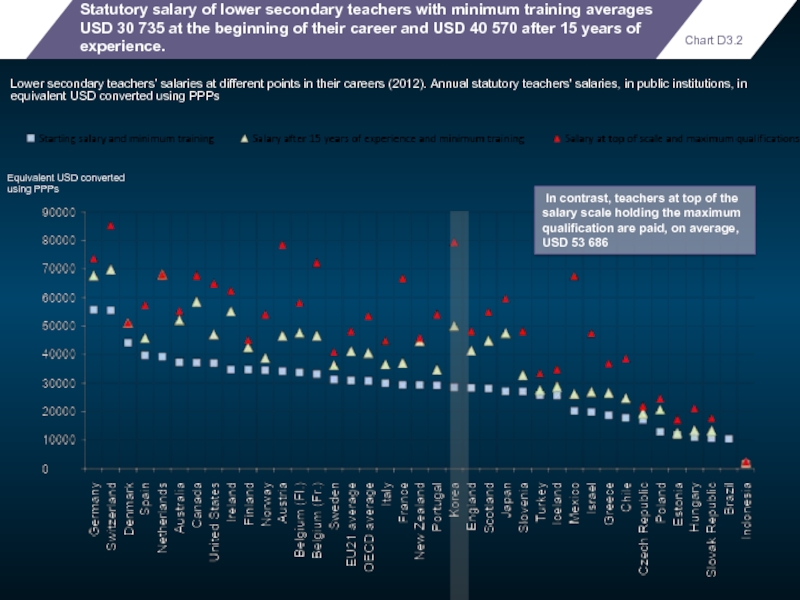
- 104. Statutory salary of lower secondary teachers
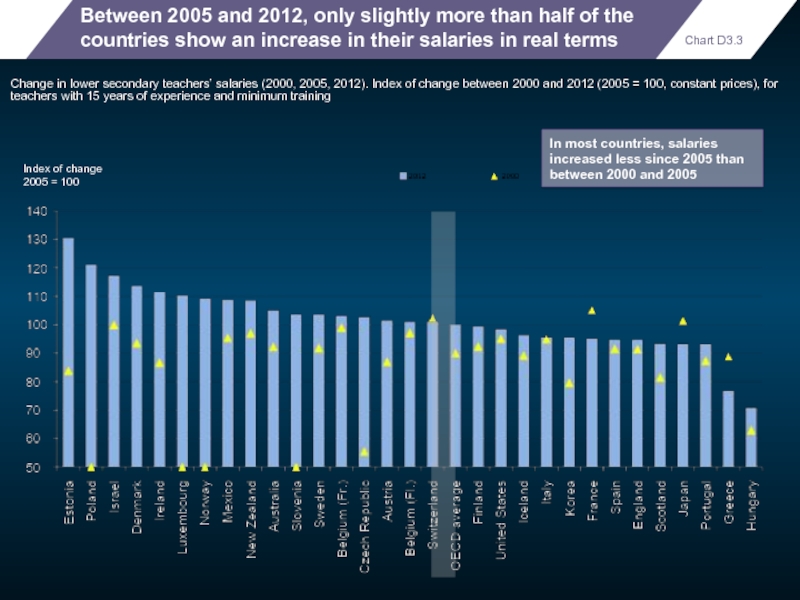
- 105. Between 2005 and 2012, only slightly
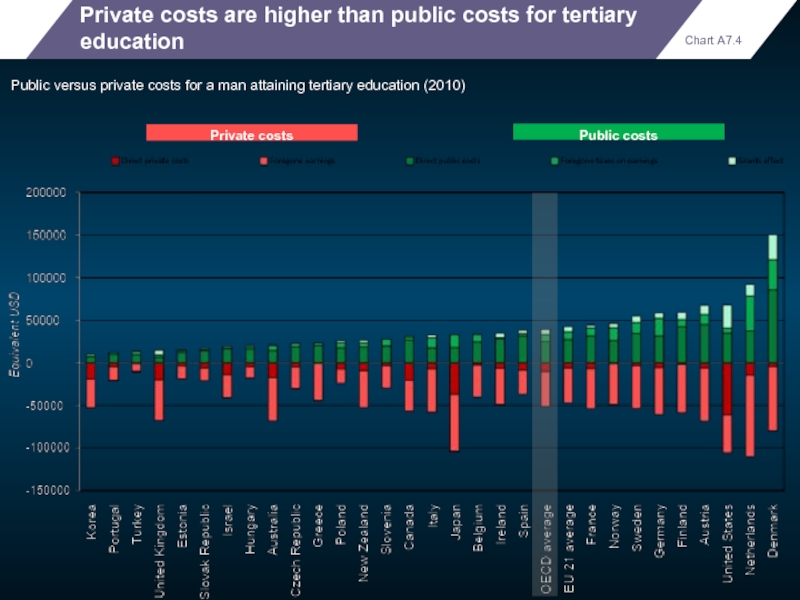
- 106. Private costs are higher than public
- 107. Thank you Find
Слайд 2Qualification levels in Europe
have risen markedly…
…but don’t always translate into
Слайд 3A world of change – higher education
Expenditure per student at tertiary
Tertiary-type A graduation rate (%)
Cost per student
Graduate supply
Слайд 4A world of change – higher education
Expenditure per student at tertiary
Tertiary-type A graduation rate (%)
Cost per student
Graduate supply
United States
Слайд 5A world of change – higher education
Expenditure per student at tertiary
Tertiary-type A graduation rate
United Kingdom
Слайд 6A world of change – higher education
Expenditure per student at tertiary
Tertiary-type A graduation rate
Слайд 7A world of change – higher education
Expenditure per student at tertiary
Tertiary-type A graduation rate
Слайд 8A world of change – higher education
Expenditure per student at tertiary
Tertiary-type A graduation rate
Слайд 9A world of change – higher education
Expenditure per student at tertiary
Tertiary-type A graduation rate
Слайд 10A world of change – higher education
Expenditure per student at tertiary
Tertiary-type A graduation rate
Слайд 11A world of change – higher education
Expenditure per student at tertiary
Tertiary-type A graduation rate
Слайд 12A world of change – higher education
Expenditure per student at tertiary
Tertiary-type A graduation rate
Слайд 13A world of change – higher education
Expenditure per student at tertiary
Tertiary-type A graduation rate
Слайд 14A world of change – higher education
Expenditure per student at tertiary
Tertiary-type A graduation rate
Слайд 15A world of change – higher education
Expenditure per student at tertiary
Tertiary-type A graduation rate
Слайд 16A world of change – higher education
Expenditure per student at tertiary
Tertiary-type A graduation rate
Слайд 17A world of change – higher education
Expenditure per student at tertiary
Tertiary-type A graduation rate
Iceland
Poland
UK
Australia
New Zealand
Слайд 18A world of change – higher education
Expenditure per student at tertiary
Tertiary-type A graduation rate
US
P
Слайд 19
More people benefit from education than ever before
25-34 and 55-64 year-olds,
%
Chart A1.3
Percentage points
Слайд 20
Many more people are expected to graduate from academically-oriented tertiary education
First-time
%
Chart A3.2 - A
Слайд 21
Nearly 60% of young adults are expected to enter university programmes
Entry
Chart C3.1
%
Слайд 22
Women and men are differently represented
in some fields of education
Percentage
Chart A.3 - Field
Слайд 23
Women are more likely than men to earn a university degree,
Percentage of graduas teawarded to women by level of educatio()
Chart A3_Gender
Слайд 24
China has almost caught up with the US in terms of
Upper secondary graduation rates (2012)
Chart A2.1
%
Слайд 25
In many countries those without an upper secondary education face an
Unemployment rates among 25-64 year-olds, by educational attainment (2005, 2010 and 2012)
Below upper secondary education
Chart A5.2 - BS
%
Слайд 27
Literacy proficiency is determined by educational attainment but not in the
Mean literacy score, by educational attainment (2012)
Chart A1.4
Слайд 28
The shares of highly literate tertiary graduates are very different across
Percentage of adults scoring at literacy proficiency Level 4/5, by educational attainment (2012)
%
Chart A1.5
Слайд 29
Younger adults perform better in literacy proficiency than older adults
Percentage of
%
Chart A1.6
Слайд 30
Graduates of vocational programmes are usually older than graduates of general
Average age of upper secondary graduation (2012)
Chart A2.2
Слайд 31
Most students complete upper secondary education in the standard time allotted,
Successful completion of upper secondary programmes (N: theoretical duration of the programmes)
%
Chart A2.4
Слайд 32
Girls are more likely than boys to complete their upper secondary
Successful completion of upper secondary programmes, by gender (N: theoretical duration of the programmes)
Chart A2.5
%
Слайд 33The rising tide has not lifted all boats…
…and in some countries
Слайд 34
Between 20% and 60% of adults are more educated than their
Percentage of 25-64 year-old non-students whose educational attainment is higher than (upward mobility) or lower than (downward mobility) that of their parents
%
Chart A4.3 - Mob
Слайд 35
Close to half of the adults have the same education as
Percentage of 25-64 year-old non-students whose educational attainment is the same as (status quo) that of their parents
%
Chart A4.3 - SQ
Слайд 36
In most countries, upward educational mobility tends to be lower in
Proportion of upward mobility across age groups
Graph Mobility A4
Слайд 37
Equitable access to tertiary education and educational mobility are not the
Relationship between the share of upward mobility among 25-34 year-olds and the likelihood of participating in tertiary education (values in reverse order)
less equitable access
low educational mobility
less equitable access
high educational mobility
more equitable access
high educational mobility
more equitable access
low educational mobility
Mobility Odds A4
Слайд 38
Those who need lifelong learning most get the least of it
Adult
%
Chart C6.3
Слайд 39
In 2012, 15% of 15-29 year-olds in OECD countries were neither
NEET population among 15-29 year-olds (2012) and change between 2011 and 2012
%
Chart C5.1
Слайд 40
Across OECD countries, about one in two 15-19 year-olds not in
Percentage of 15-19 year-olds not in education, by labour market status (2012)
Chart C5.3
%
Слайд 41
Prevalence of part-time work among young people differs significantly among countries
Proportion
Chart C5.4 - PT
%
Слайд 42
More than 50% of adults participate in formal and/or non-formal education
Adult participation in formal and/or non-formal education (2012)
%
Chart C6.1
Слайд 43Europe is now driving
international student mobility…
…the US accommodates a large
Слайд 44
In 2012, more than 4.5 million students were enrolled in tertiary
Chart C4.1
Evolution in the number of students enrolled outside their country of citizenship, by region of destination (2000 to 2012)
Million students
25% of EU target
Слайд 45
In 2012, more than one in two foreign students were enrolled
Distribution of foreign students in tertiary education, by country of destination (2012)
Chart C4.2
Слайд 46
New players are emerging in the international education market
Trends in international
Market share (%)
OECD countries
Other G20 and
non-OECD countries
2000
2012
Chart C4.3
Слайд 47
International students comprise around 8% of tertiary enrolments, on average
Student mobility
Foreign students2
%
International students
OECD average
Chart C4.4
Слайд 48
More than half of foreign students in tertiary education come from
Distribution of foreign students in tertiary education, by region of origin (2012)
Chart C4.5
Слайд 50
Between 2008 and 2011, only six countries cut public expenditure on
Impact of the economic crisis on public expenditure on education
Chart B2.3 - T
Слайд 51
OECD countries spend USD 9 252 per student per year from
Annual expenditure per student by educational institutions, by type of service (2011)
Chart B1.1
Слайд 52
Between 2000 and 2011, most countries increased public expenditure on all
Total public expenditure on all services as a percentage of GDP (2000, 2011)
% of GDP
Chart B4.2
Слайд 53
In 2011, OECD countries spent an average of 3.9% of their
Expenditure on educational institutions as a percentage of GDP (2011). From public and private sources, by level of education and source of funds
OECD average (total expenditure)
Chart B2.2 - PS
Слайд 54
In most countries, spending per primary and secondary student increased by
Change in expenditure per student by educational institutions, by level of education (2008, 2011)
Primary, secondary and post-secondary non-tertiary education
Chart B1.6. Changes in the number of students and changes in expenditure per student by educational institutions, by level of education (2005, 2010)
Index of change between 2005 and 2010 (2005 = 100, 2010 constant prices )
Chart B1.6 - PS
Слайд 55
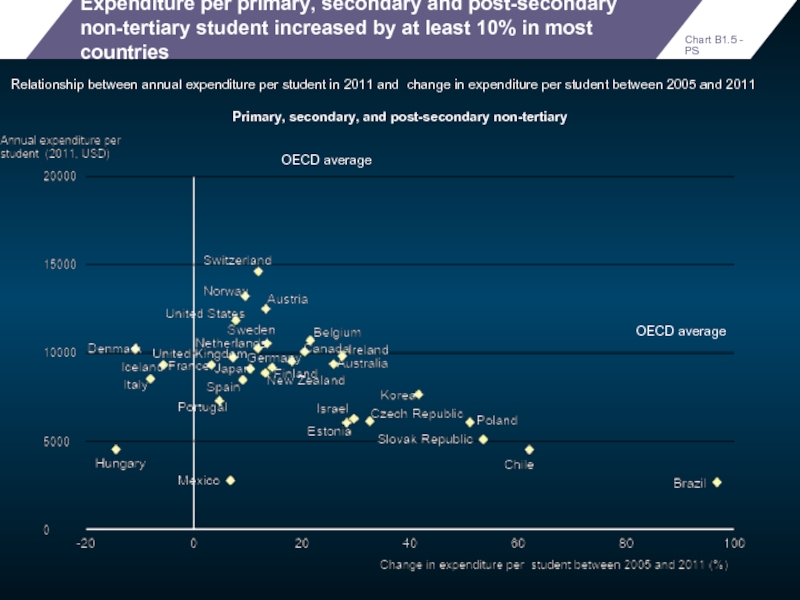
Expenditure per primary, secondary and post-secondary non-tertiary student increased by at
Relationship between annual expenditure per student in 2011 and change in expenditure per student between 2005 and 2011
OECD average
Primary, secondary, and post-secondary non-tertiary
OECD average
Chart B1.5 - PS
Слайд 56
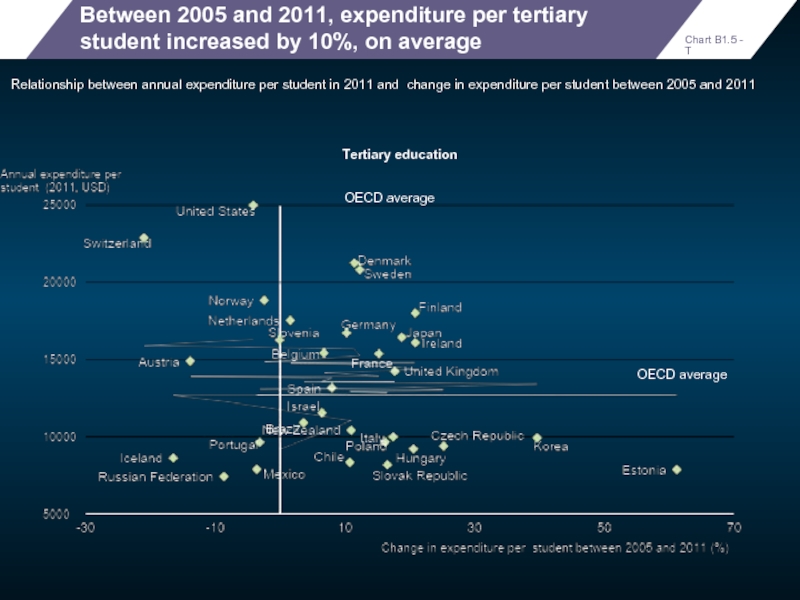
Between 2005 and 2011, expenditure per tertiary student increased by 10%,
Relationship between annual expenditure per student in 2011 and change in expenditure per student between 2005 and 2011
OECD average
Tertiary education
OECD average
Chart B1.5 - T
Слайд 57
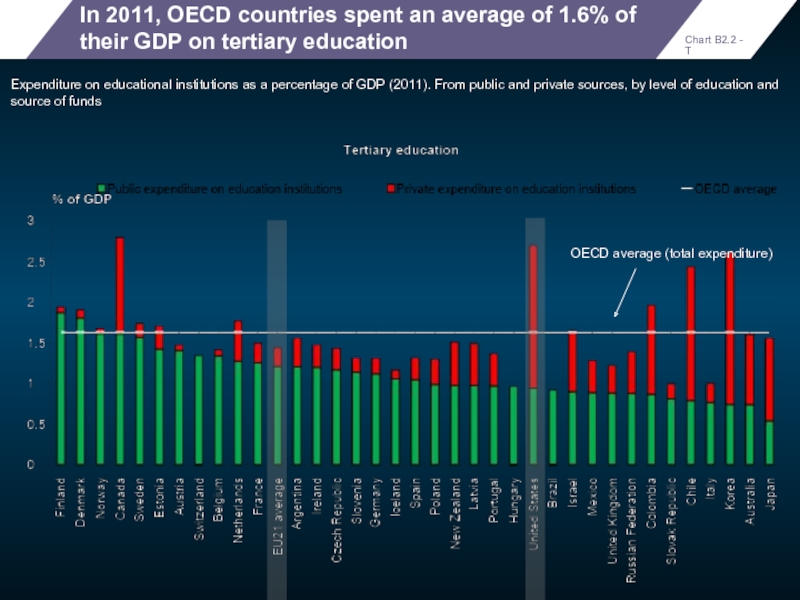
In 2011, OECD countries spent an average of 1.6% of their
Expenditure on educational institutions as a percentage of GDP (2011). From public and private sources, by level of education and source of funds
OECD average (total expenditure)
Chart B2.2 - T
Слайд 58
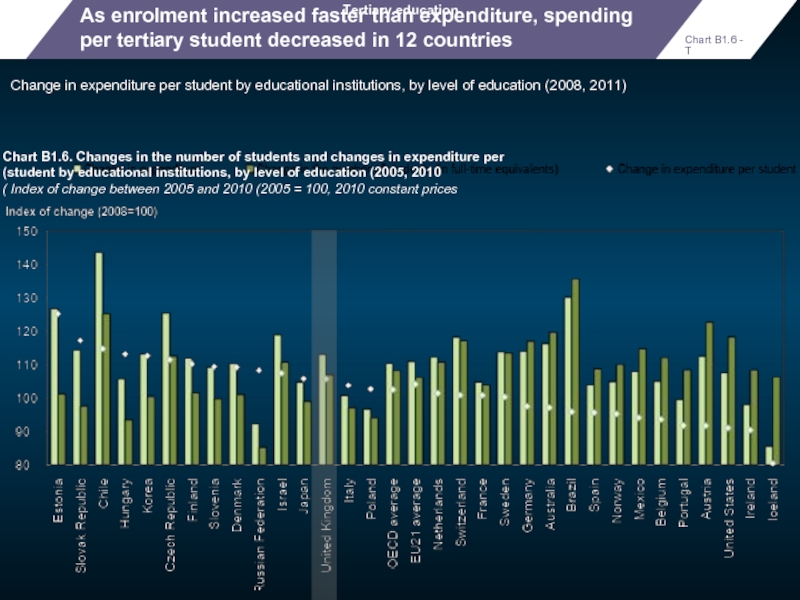
As enrolment increased faster than expenditure, spending per tertiary student decreased
Change in expenditure per student by educational institutions, by level of education (2008, 2011)
Tertiary education
Chart B1.6. Changes in the number of students and changes in expenditure per student by educational institutions, by level of education (2005, 2010)
Index of change between 2005 and 2010 (2005 = 100, 2010 constant prices )
Chart B1.6 - T
Слайд 59
OECD countries spend 0.5% of their GDP on research and development
Expenditure on educational institutions for core services, R&D and ancillary services as a percentage of GDP, at the tertiary level of education (2011)
Chart B2.4
Слайд 61
About 31% of spending on tertiary education comes from private sources,
Share of private expenditure on educational institutions (2011)
Chart B3.1
Слайд 62
The share of private expenditure on tertiary institutions increased from 25%
Share of private expenditure on tertiary educational institutions (2000, 2008 and 2011)
Chart B3.3 - T
Слайд 63
Nearly 22% of public spending on tertiary education is devoted to
Public support for tertiary education (2011)
Chart B5.3. Public subsidies for education in tertiary education (2005)
Public subsidies for education to households and other private entities as a percentage of total public expenditure on education, by type of subsidy
Chart B5.3
Слайд 64
The increase in the share of private expenditure on tertiary institutions
Change (in percentage points) in the proportion of private expenditure between 2000 and 2011
Chart B3.3 - Ch
Слайд 65
The share of students enrolled in private tertiary institutions has increased
Students enrolled in tertiary-type A and advanced research programmes, by type of private institutions (2012)
Chart C7.4
Слайд 66
The employment benefit of tertiary education is significant, but varies across
Employment rates among 25-64 year-olds, by educational attainment (2012)
Chart A5.1
Слайд 67
In many countries those without an upper secondary education face an
Unemployment rates among 25-64 year-olds, by educational attainment (2005, 2010 and 2012)
Below upper secondary education
Chart A5.2 - BS
%
Слайд 68
While those who have attained tertiary education still have a low
Chart A5.2 - T
Unemployment rates among 25-64 year-olds, by educational attainment (2005, 2010 and 2012)
%
Tertiary education
Слайд 69
And also those with an upper secondary education are not immune
Unemployment rates among 25-64 year-olds, by educational attainment (2005, 2010 and 2012)
Upper secondary or post-secondary non-tertiary education
%
Chart A5.2 - US
Слайд 70
About 83% of employed adults with upper secondary education perform at
Employed adults at literacy proficiency Level 2 or Level 4/5, by educational attainment (2012)
Chart A5.4 - US
Слайд 71
About 89% of employed adults with tertiary education perform at levels
Employed adults at literacy proficiency Level 2 or Level 4/5, by educational attainment (2012)
Chart A5.4 - T
Слайд 72
Adults with a tertiary degree will earn 75% more than those
Relative earnings of workers, by educational attainment and gender (2012); upper secondary education = 100
Tertiary-type A or advanced research programmes
Index
Chart A6.1 - T
Слайд 73
Adults with below upper secondary education will earn around 22% less
Relative earnings of workers, by educational attainment and gender (2012); upper secondary education = 100
Below upper secondary education
Index
Chart A6.1 - B
Слайд 74
The private returns on an investment in tertiary education are substantial
Private costs and benefits for a man and for a woman attaining upper secondary or post-secondary non-tertiary education (2010)
Chart A7.2
Net present value
Слайд 75
The private returns on an investment in tertiary education are also
Private costs and benefits for a man and for a woman attaining upper secondary or post-secondary non-tertiary education (2010)
Net present value
Chart A7.2 (2)
Слайд 76
The earnings advantage for tertiary-educated older adults are higher than those
Differences in relative earnings between older and younger workers, by educational attainment (2012); earnings relative to workers with upper secondary education
Relative earnings higher with age
Relative earnings lower with age
Percentage points
Chart A6.2
Слайд 77Education and skills both contribute to better social outcomes
Proportion of adults
Chart A8.1 - H
%
%
%
%
Proportion of adults reporting that they believe they have a say in government
Proportion of adults reporting that they volunteer at least once a month
Proportion of adults reporting that they can trust others
Слайд 78
An individual with a higher level of education is more likely
Proportion of adults reporting that they are in good health, by educational attainment
Chart A8.2 - HA
Слайд 79
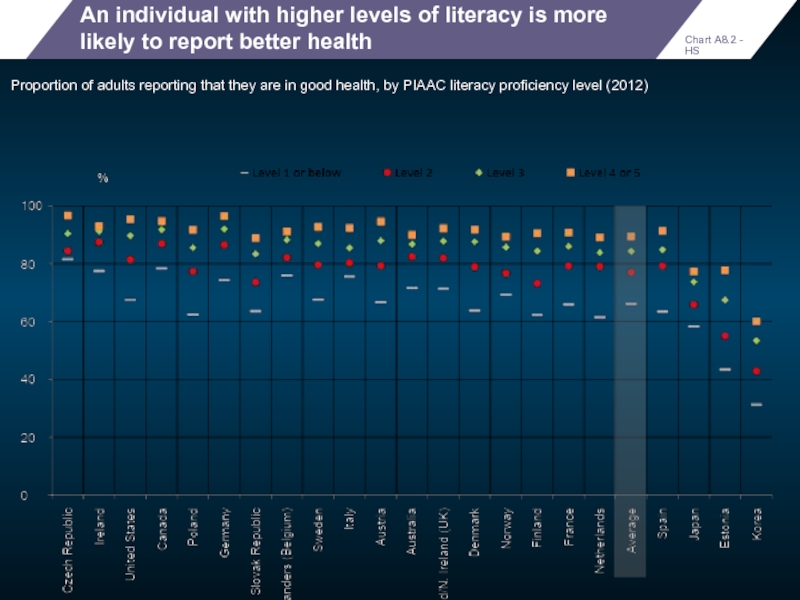
An individual with higher levels of literacy is more likely to
Proportion of adults reporting that they are in good health, by PIAAC literacy proficiency level (2012)
Chart A8.2 - HS
Слайд 80
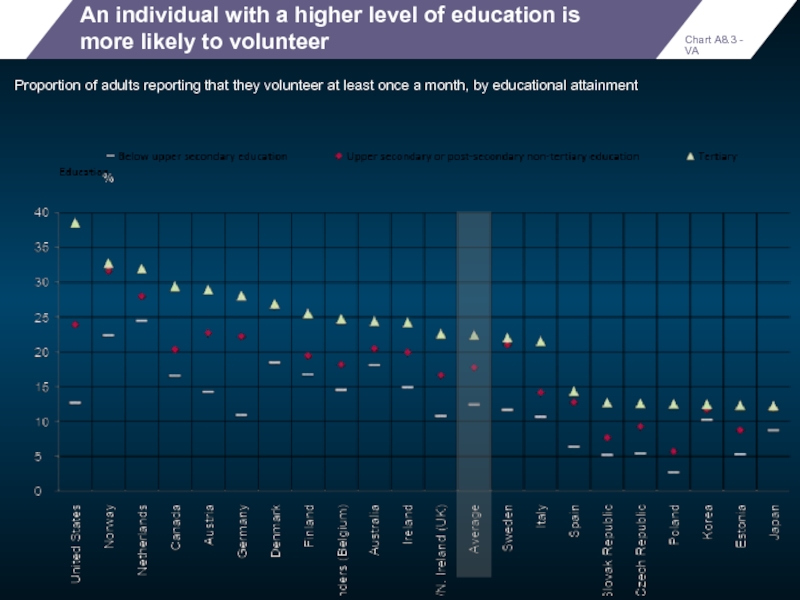
An individual with a higher level of education is more likely
Proportion of adults reporting that they volunteer at least once a month, by educational attainment
Chart A8.3 - VA
Слайд 81
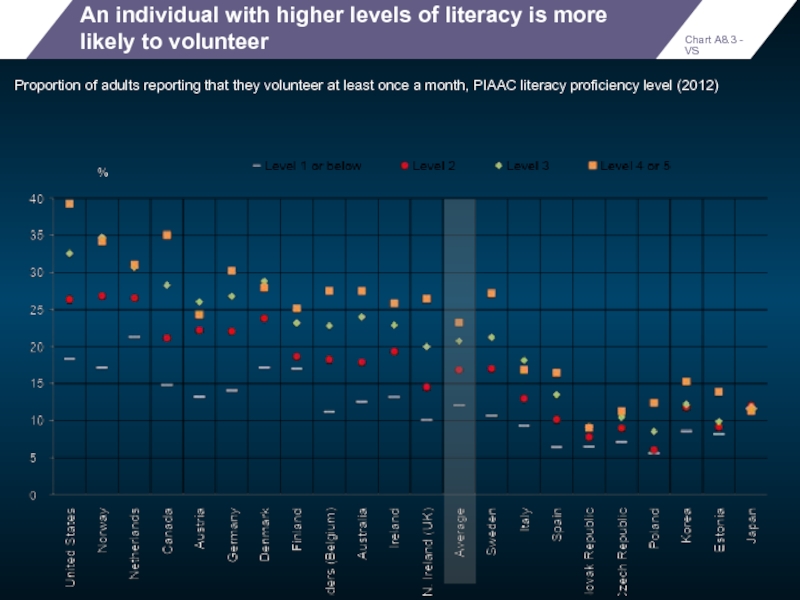
An individual with higher levels of literacy is more likely to
Proportion of adults reporting that they volunteer at least once a month, PIAAC literacy proficiency level (2012)
Chart A8.3 - VS
Слайд 82
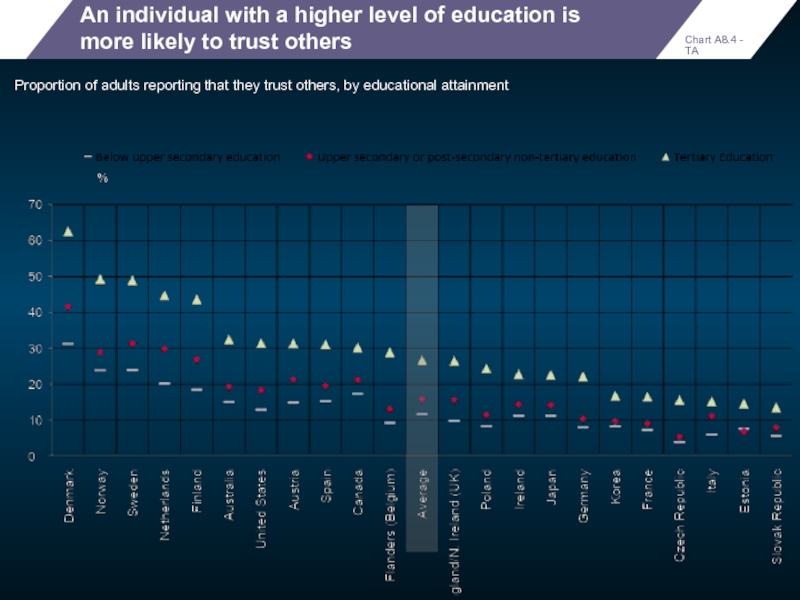
An individual with a higher level of education is more likely
Proportion of adults reporting that they trust others, by educational attainment
Chart A8.4 - TA
Слайд 83
An individual with higher levels of literacy is more likely to
Proportion of adults reporting that they trust others, by PIAAC literacy proficiency level (2012)
Chart A8.4 - TS
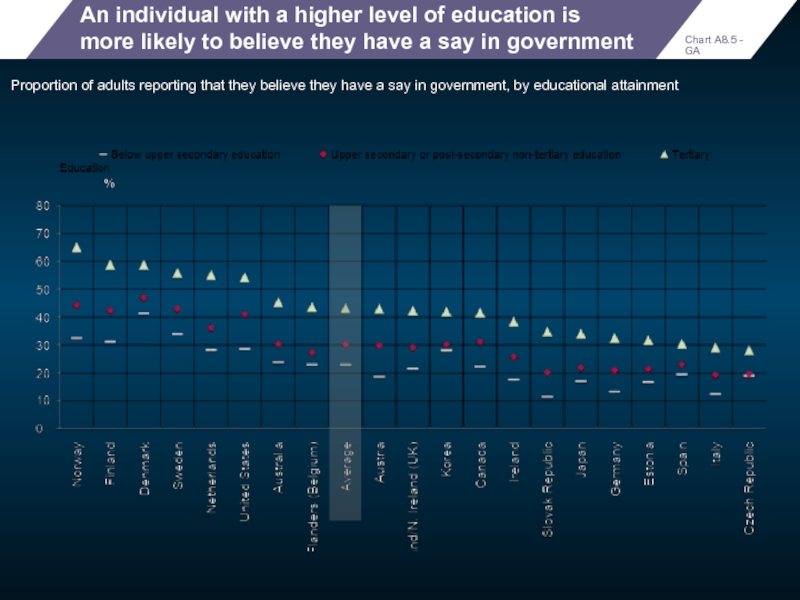
Слайд 84
An individual with a higher level of education is more likely
Proportion of adults reporting that they believe they have a say in government, by educational attainment
Chart A8.5 - GA
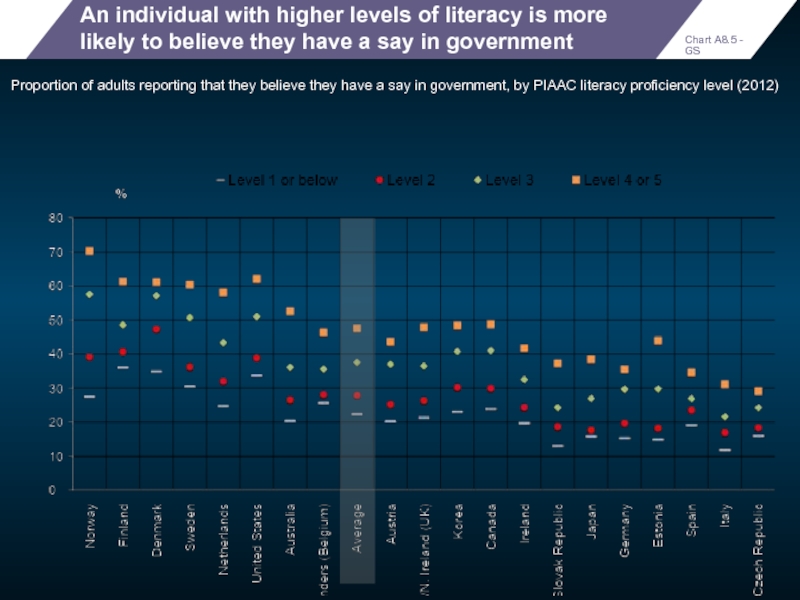
Слайд 85
An individual with higher levels of literacy is more likely to
Proportion of adults reporting that they believe they have a say in government, by PIAAC literacy proficiency level (2012)
Chart A8.5 - GS
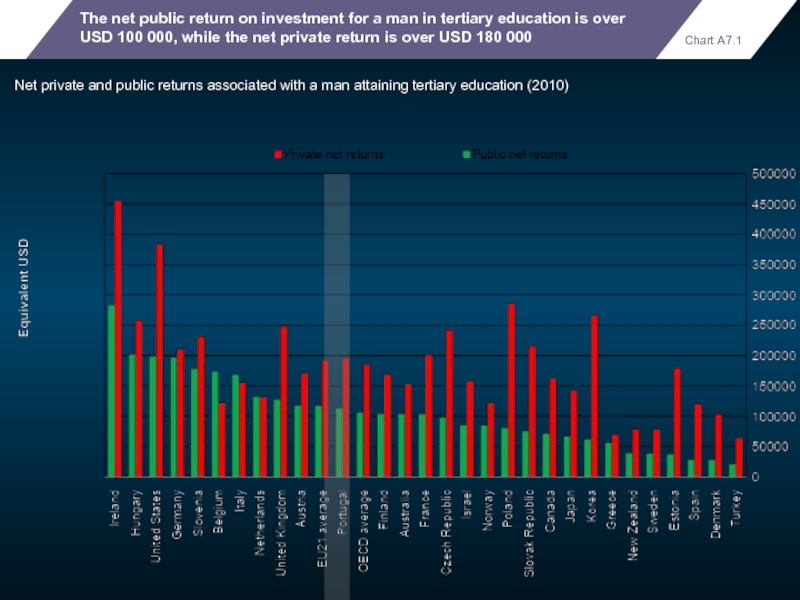
Слайд 86
The net public return on investment for a man in tertiary
Net private and public returns associated with a man attaining tertiary education (2010)
Chart A7.1
Слайд 87
Annual spending per primary student is USD 8 296, on average
Annual
Expenditure per student (equivalent USD converted using PPPs)
Chart B1.2a - P
OECD average
Слайд 88
Annual spending per secondary student ranges from USD 522 to USD
Annual expenditure per student by educational institutions for all services, by level of education (2011) Secondary education
OECD average
Expenditure per student (equivalent USD converted using PPPs)
Chart B1.2a - S
Слайд 89
Annual spending per tertiary student ranges from USD 1173 to USD
Annual expenditure per student by educational institutions for all services, by level of education (2011) Tertiary education
OECD average
Expenditure per student (equivalent USD converted using PPPs)
Chart B1.2a - T
Слайд 90
The cumulative expenditure, per student, on OECD tertiary institutions is USD
Cumulative expenditure per student by educational institutions over the average duration of tertiary studies (2011
Each segment of the bar represents the annual expenditure by educational institutions per student. The number of segments represents the average number of years a student remains in tertiary education.
Chart B1.4
Слайд 91
Chart A9.4
Student performance and equity
OECD average
OECD average
Below average mathematics performance
Below average
background
Above average mathematics performance
Below average impact of socio-economic
background
Below average mathematics performance
Above average impact of socio-economic
background
Above average mathematics performance
Above average impact of socio-economic
background
Relationship between mathematics performance and variation in
performance explained by students’ socio-economic status
Слайд 93Good progress in raising early childhood participation
Several EU countries have surpassed
Слайд 94
Some 70% of 3-year-olds are enrolled in early childhood education
Enrolment rates
%
Chart C2.1
Слайд 95
The ratio of pupils to teaching staff also indicates the level
Ratio of pupils to teaching staff in early childhood education (2012). Public and private institutions, calculation
based on full-time equivalents
Student to teaching staff ratio
Chart C2.4
Слайд 96Countries spend their money differently on schools…
…and many high-performing school systems
Слайд 97
The salary cost of teachers per student varies widely across countries
Contribution of various factors to salary cost of teachers per student, in upper secondary education (2012) in USD
Chart B7.4
Слайд 98
Students in OECD countries receive an average of 7 475 compulsory
Compulsory instruction time in general education (2014)
Duration of primary and lower secondary education, in years
Chart D1.1
Total number of compulsory instruction hours
Слайд 99
The average size of primary school classes decreased slightly between 2000
Average class size in primary education (2000, 2012)
Chart D2.1
Слайд 100
The number of students per class tends to increase between primary
Average class size in educational institutions, by level of education (2012)
Chart D2.2
Слайд 101
Only in 7 countries were relative salaries for teachers higher than
Teachers' salaries relative to earnings for tertiary-educated workers aged 25-64 (2012 or latest available year). Lower secondary teachers' salaries, in public institutions
Ratio
Chart D3.1
Слайд 102
Between 2009 and 2012, teachers’ salaries fell, for the first time
OECD average, for countries with available data for all reference years, of the index of change between 2005 and 2012 (2005 = 100, constant prices), for teachers with 15 years of experience and minimum training.
Index of change
2005 = 100
Chart Box D.3.2
Equivalent USD converted
using PPPs
Слайд 103
Public-school teachers teach between 1 001 hours per year at the
Number of teaching hours per year, by level of education (2012). Net statutory contact time in public institutions
Chart D4.2
Слайд 104
Statutory salary of lower secondary teachers with minimum training averages USD
Lower secondary teachers’ salaries at different points in their careers (2012). Annual statutory teachers' salaries, in public institutions, in equivalent USD converted using PPPs
Equivalent USD converted
using PPPs
Chart D3.2
In contrast, teachers at top of the salary scale holding the maximum qualification are paid, on average, USD 53 686
Слайд 105
Between 2005 and 2012, only slightly more than half of the
Change in lower secondary teachers’ salaries (2000, 2005, 2012). Index of change between 2000 and 2012 (2005 = 100, constant prices), for teachers with 15 years of experience and minimum training
Index of change
2005 = 100
Chart D3.3
In most countries, salaries increased less since 2005 than between 2000 and 2005
Слайд 106
Private costs are higher than public costs for tertiary education
Public versus
Private costs
Public costs
Chart A7.4
Слайд 107
Thank you
Find out more about our work at www.oecd.org/eag/eag2014
The publication
The methodologies
The
Email: Andreas.Schleicher@OECD.org
Twitter: SchleicherEDU
and remember:
Without data, you are just another person with an opinion
