- Главная
- Разное
- Дизайн
- Бизнес и предпринимательство
- Аналитика
- Образование
- Развлечения
- Красота и здоровье
- Финансы
- Государство
- Путешествия
- Спорт
- Недвижимость
- Армия
- Графика
- Культурология
- Еда и кулинария
- Лингвистика
- Английский язык
- Астрономия
- Алгебра
- Биология
- География
- Детские презентации
- Информатика
- История
- Литература
- Маркетинг
- Математика
- Медицина
- Менеджмент
- Музыка
- МХК
- Немецкий язык
- ОБЖ
- Обществознание
- Окружающий мир
- Педагогика
- Русский язык
- Технология
- Физика
- Философия
- Химия
- Шаблоны, картинки для презентаций
- Экология
- Экономика
- Юриспруденция
Cultivating Curiosity презентация
Содержание
- 1. Cultivating Curiosity
- 2. New Pedagogies for Deep Learning Michael Fullan
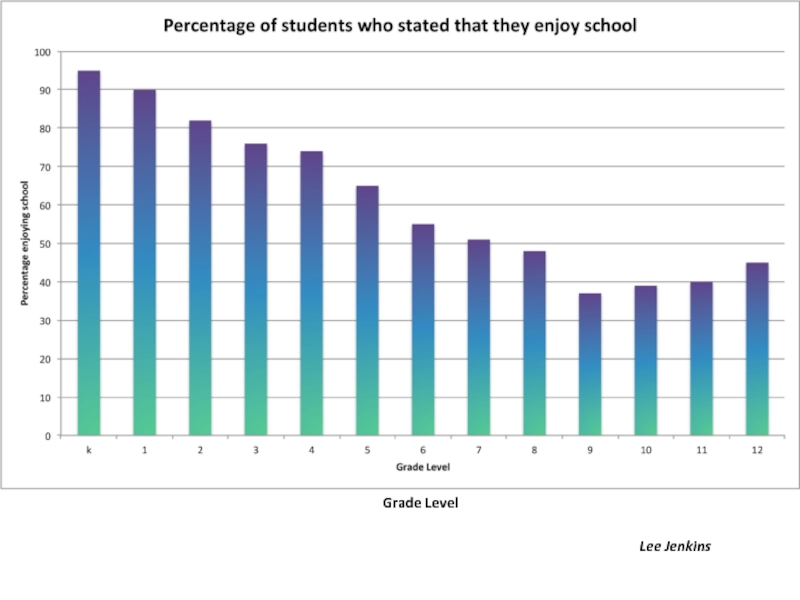
- 3. Grade Level Lee Jenkins
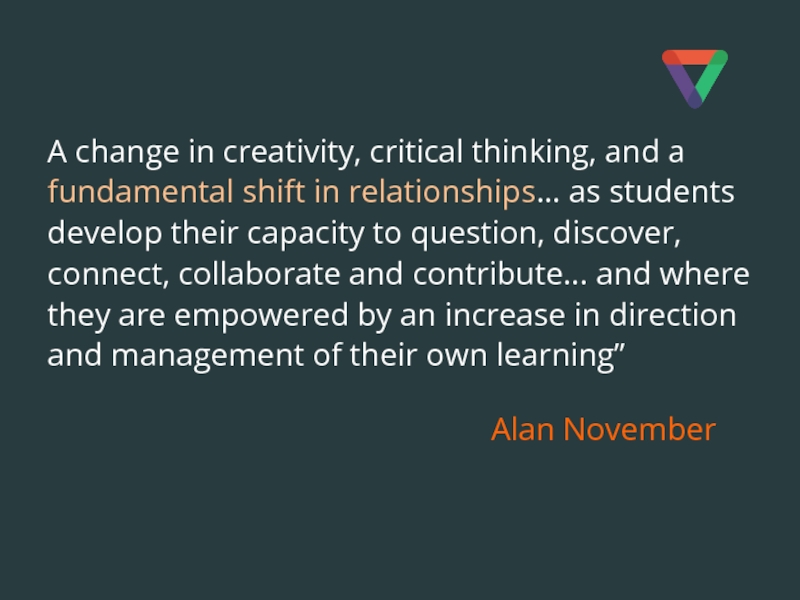
- 5. A change in creativity, critical thinking,
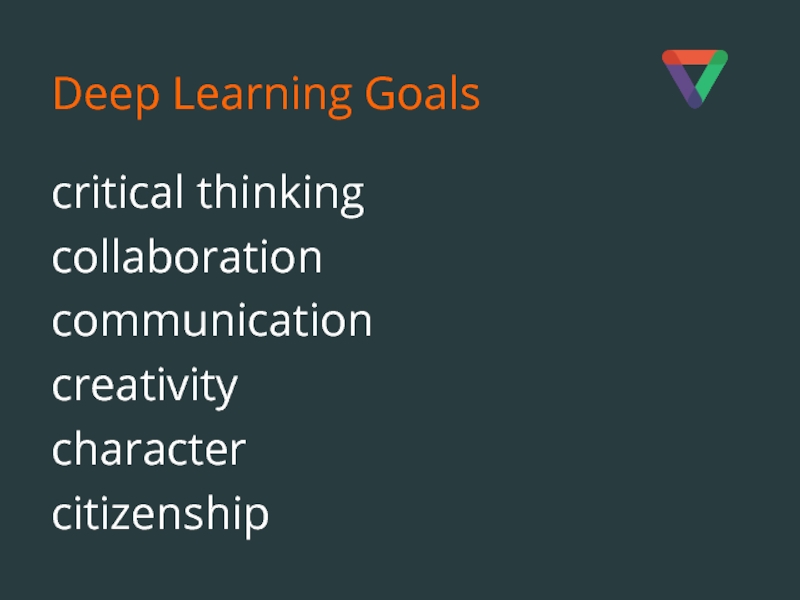
- 6. Deep Learning Goals critical thinking collaboration communication creativity character citizenship
- 7. irresistible
- 9. wonder - full
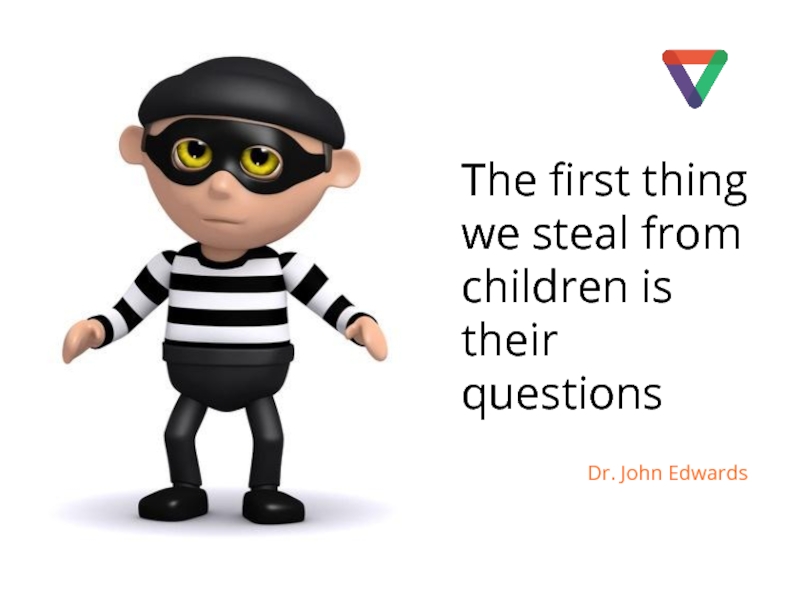
- 10. The first thing we steal from children is their questions Dr. John Edwards
- 12. eureka! moments
- 14. Wonderful = Curiosity + Inspiration
- 15. Activate Cultivate Initiate
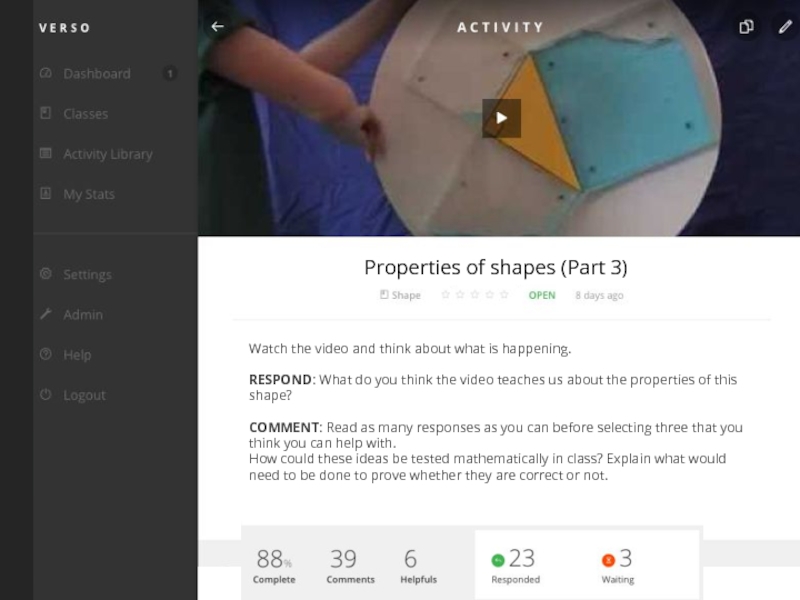
- 16. Watch the video and think about what
- 18. Toby Ng has created this superb series
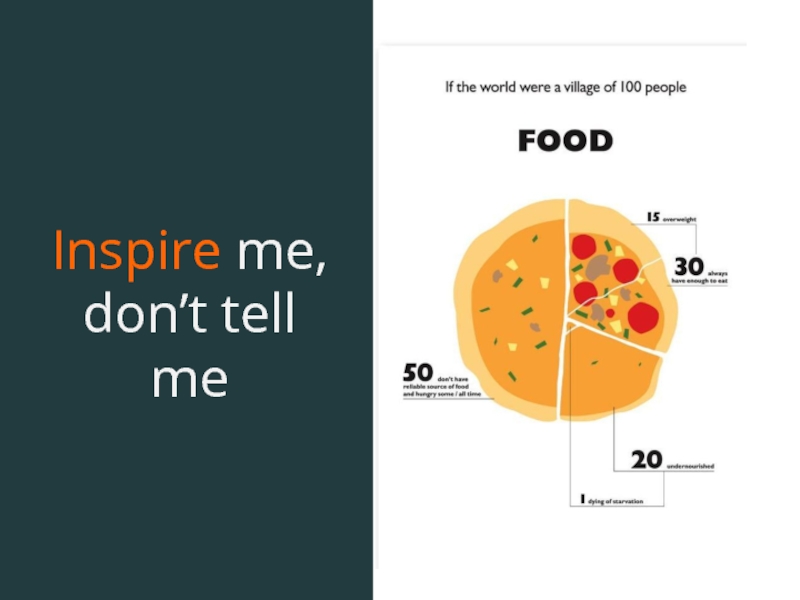
- 19. Inspire me, don’t tell me
- 23. Know your Impact
- 24. From me to we
- 25. Michael Fullan Teaching Like a
- 26. Prof. Stephen Heppell In Plain Sight
- 27. Visible Change Every student response becomes a learning experience for the entire school. Ve
- 28. www.newpedagogies.info verso Meet the team Stand 173 Thank you
Слайд 5
A change in creativity, critical thinking, and a fundamental shift in
relationships… as students develop their capacity to question, discover, connect, collaborate and contribute... and where they are empowered by an increase in direction and management of their own learning”
Alan November
Слайд 16Watch the video and think about what is happening.
RESPOND: What do
you think the video teaches us about the properties of this shape?
COMMENT: Read as many responses as you can before selecting three that you think you can help with.
How could these ideas be tested mathematically in class? Explain what would need to be done to prove whether they are correct or not.
COMMENT: Read as many responses as you can before selecting three that you think you can help with.
How could these ideas be tested mathematically in class? Explain what would need to be done to prove whether they are correct or not.
Properties of shapes (Part 3)
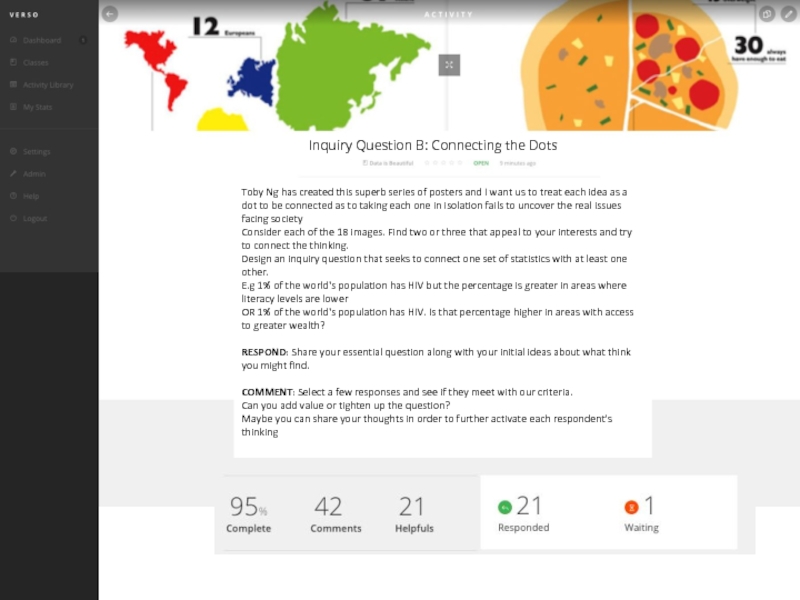
Слайд 18Toby Ng has created this superb series of posters and I
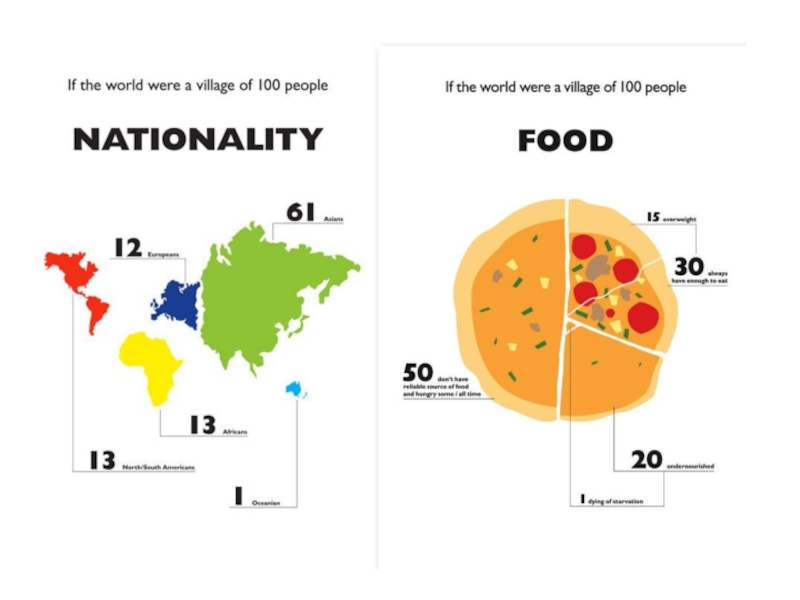
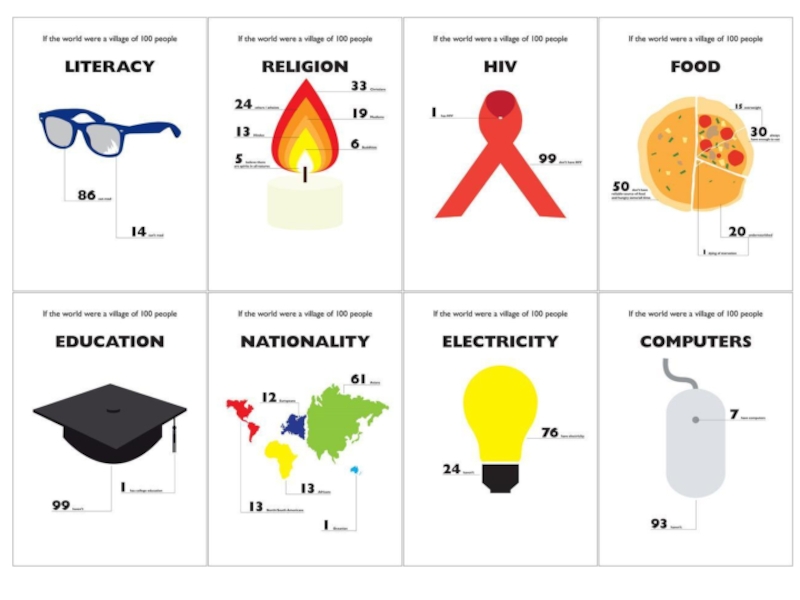
want us to treat each idea as a dot to be connected as to taking each one in isolation fails to uncover the real issues facing society
Consider each of the 18 images. Find two or three that appeal to your interests and try to connect the thinking.
Design an inquiry question that seeks to connect one set of statistics with at least one other.
E.g 1% of the world's population has HIV but the percentage is greater in areas where literacy levels are lower
OR 1% of the world's population has HIV. Is that percentage higher in areas with access to greater wealth?
RESPOND: Share your essential question along with your initial ideas about what think you might find.
COMMENT: Select a few responses and see if they meet with our criteria.
Can you add value or tighten up the question?
Maybe you can share your thoughts in order to further activate each respondent's thinking
Inquiry Question B: Connecting the Dots
Слайд 25
Michael Fullan
Teaching
Like a Pro’
Constantly trying to improve practice and working with
all the collective might and ingenuity of professional colleagues to do so.
Слайд 26
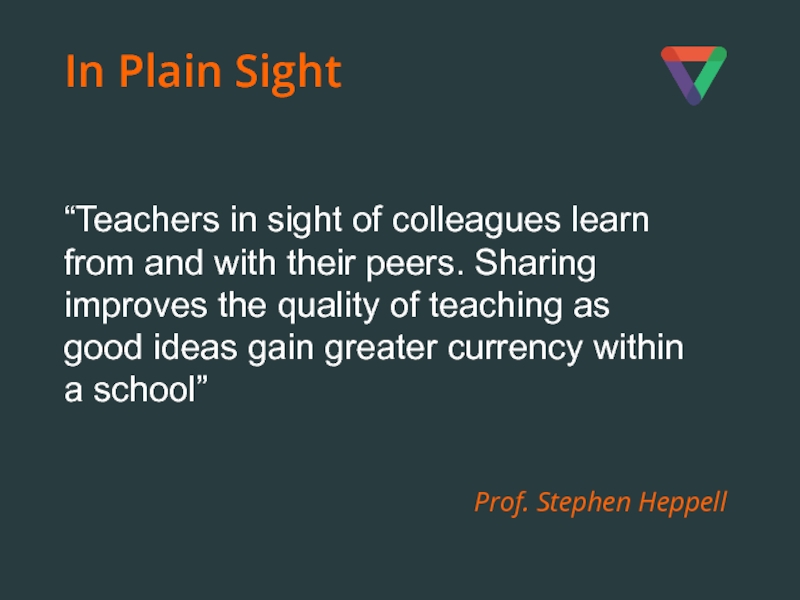
Prof. Stephen Heppell
In Plain Sight
“Teachers in sight of colleagues learn from
and with their peers. Sharing improves the quality of teaching as good ideas gain greater currency within a school”

