- Главная
- Разное
- Дизайн
- Бизнес и предпринимательство
- Аналитика
- Образование
- Развлечения
- Красота и здоровье
- Финансы
- Государство
- Путешествия
- Спорт
- Недвижимость
- Армия
- Графика
- Культурология
- Еда и кулинария
- Лингвистика
- Английский язык
- Астрономия
- Алгебра
- Биология
- География
- Детские презентации
- Информатика
- История
- Литература
- Маркетинг
- Математика
- Медицина
- Менеджмент
- Музыка
- МХК
- Немецкий язык
- ОБЖ
- Обществознание
- Окружающий мир
- Педагогика
- Русский язык
- Технология
- Физика
- Философия
- Химия
- Шаблоны, картинки для презентаций
- Экология
- Экономика
- Юриспруденция
Service Quality & Customer Experience Management презентация
Содержание
- 1. Service Quality & Customer Experience Management
- 2. CEM & SQM & NPM – Huawei’s
- 3. CEM / SQM / NPM / SOC – Huawei’s Capability
- 4. What Huawei can deliver Platform CEM SQM
- 5. CEM & SQM & NPM – Huawei’s
- 6. Savings and Earnings by Huawei CEM Platform
- 7. Savings and Earnings by Huawei CEM Platform
- 8. CEM & SQM & NPM – Huawei’s
- 9. 3V Demo Architecture & Platform First 30
- 10. CEM & SQM & NPM – Huawei’s
- 11. …delivered projects with tangible value Huawei SmartCare® is Leading the CEM Industry
- 12. Huawei CEM World Class
- 13. HUAWEI SmartCare® 3rd Party Partners
- 15. Appendix & Supportive Materials
- 16. Group C – OPEX Savings in Consumer
- 17. Consumer Operations OPEX Savings Calculation Approach Complaints
- 18. Call Centre OPEX reduction – details and
- 19. Group T – Technology Operations and Service
- 20. Technology Operations OPEX Savings Estimation (EU TT
- 21. Business Services – Efficient Operation and extra
- 22. Only OPEX savings are counted (Enterprise appreciation
- 23. Only OPEX savings are counted (Enterprise appreciation
- 24. Network Strategy and Core – Efficient Operation
- 25. Business Case Traffic / ARPU / Complaints
- 26. Approach 2G-3G-4G Users Migration – Additional Revenue Generation
- 27. Roaming Business Leakage Retention – Additional Revenue
- 28. Digital Marketing – data usage / CE
- 29. Data Query Calls Efficiency Improvement – OPEX
- 30. SmartCare® Business Value on a Customer Case
- 31. 3V Demo – Supportive Materials
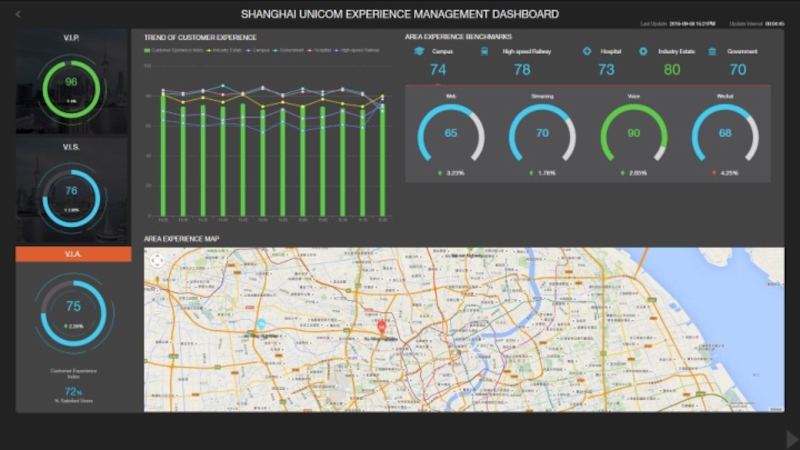
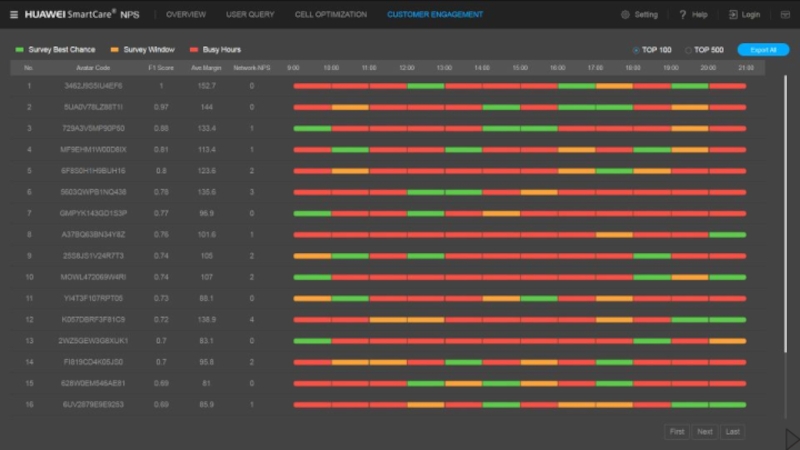
- 32. VIP / VIS / VIA Proactive Care Overview
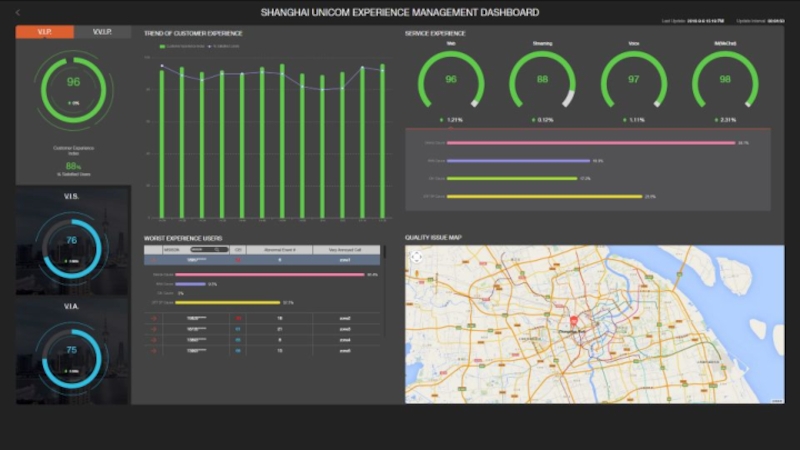
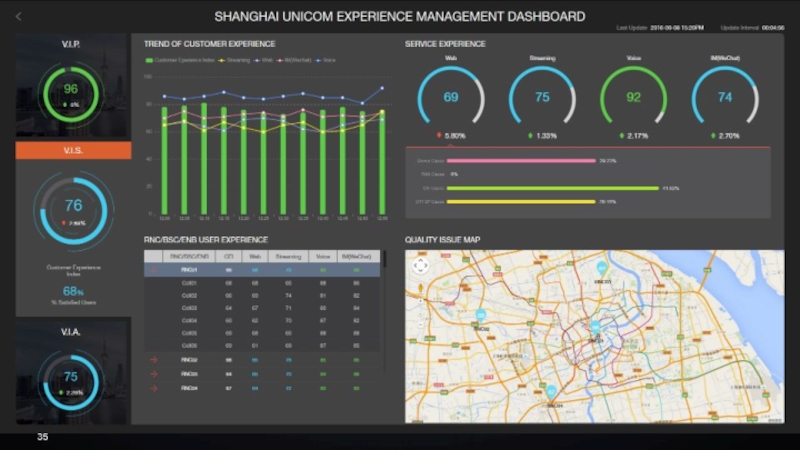
- 33. 3V Dashboard
- 37. 3V Demo – end of supportive materials
- 38. First 30 days journey – Supportive Materials
- 39. First 30-Day Journey Winner of “Best CEM Culture Transformation Program”
- 40. Complete View of the 30-day Journey
- 41. Complete View of the 30-day Journey
- 42. First 30 days journey – end of supportive materials
- 43. Architecture & Platform – Supportive Materials
- 44. S1-U SGW Network Data Sources
- 45. 500 Gbps probe capability & 1800+ protocols identification Platform Architecture
- 46. CEM Platform to deliver value through use
- 47. Architecture & Platform – end of supportive materials
- 48. ARPU Driven Network Planning – Supportive Materials
- 49. Quality Brand Experience & Value Driven Site Ranking
- 50. Value/experience Classified Model Quality Brand Experience & Value Driven Site Ranking
- 51. Quality Brand Experience & Value Driven Site Ranking
- 52. Quality Brand Experience & Value Driven Site Ranking
- 53. ARPU Driven Network Planning – end of supportive materials
- 54. 2G/3G/4G User Migration – Supportive Materials
- 55. 2G to 3G to 4G Subscriber Migration
- 56. Migration Analytics to Action Overview 2
- 57. 20X MB / Data Subscriber /
- 58. 2G/3G/4G User Migration – end of supportive materials
- 59. Roaming Service Quality Assurance – Supportive Materials
- 60. Solution Overview
- 61. Roaming Quality Monitoring Select carrier Select KPI
- 62. Inbound and outbound roaming
- 63. Identify steering status of carriers in different
- 64. Best Practice
- 65. International Roaming Issues SMC HLR
- 66. Roaming Business More Effectively
- 67. Roaming Service Quality Assurance – Supportive Materials
- 68. VVIP Service Quality Assurance – Supportive Materials
- 69. VIP Assurance 360°VIP Understanding: What application
- 70. VIP and VIP Groups Real Time Monitoring
- 71. VIP Experience Insight User 1, High revenue
- 72. VVIP Service Quality Assurance – Supportive Materials
- 73. Customer Experience from whole Customer Journey Advertisement
- 74. Journey and Touch Points – Experience is in between
- 75. Contract Prolongation Experience Pro-active care experience Selection
- 76. Snapshot to show Impact to User
- 77. How it works – Info to
- 78. See at whole and by details to
- 79. Huawei’s CEM Solution under the name SmartCare®
- 80. Service Quality Management CEM or SQM What is the difference?
- 81. Internet
- 82. SQM is a typical entity existing
- 83. Experience Service capability CEM correlates real
- 84. Objective measures Subjective measures Aggregation
- 85. CEM Summary – from traditional QoS to
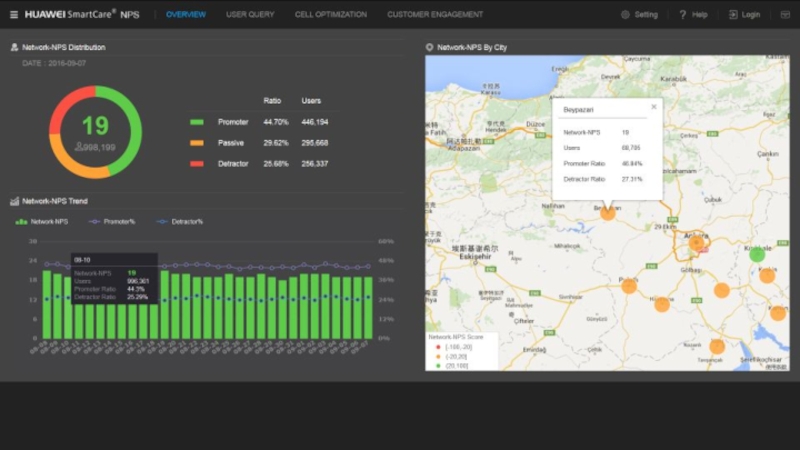
- 86. Net Promoter Score
- 87. VALIDATE POSITIVE IMPACT OF IMPROVING NPS
- 88. UNCOVER NPS INFLUENCING FACTORS PER PERSONA
- 89. PERSONA BASE NPS IMPROVEMENT APPROACH Reduce Detractors & Monetize Promoters
- 90. VALUE DELIVERED IN PRACTICE WORLD NPS Improved 10pts with $1.2 Additional Earning
- 91. NPS Detractors – not a one but
- 92. Net Promoter Score Prediction Framework 8000 DNA-pattern
- 93. Let us imagine – measured NPS is
- 94. User Centric Differentiated Quality Excellence Address Expectations
- 95. NPS Demo
- 100. Churn Prediction – Details
- 101. Why we should manage Churn? New subscriber
- 102. FORMULA OF ANTI-CHURN
- 103. Methodology Better Result by Experience Oriented Churn
- 104. Decide to leave Transition Point Real Churn
- 105. Customer Segmentation From contract
- 106. Reference Case - early predication
- 107. Achieved 2.4% Churn Rate Reduction ~49,000 Subscribers
- 108. Output
- 109. Data Explorer Demo – Churn
- 110. In this demo we monitor all
- 111. More details are available with
- 112. Churn Cause Analysis helps to identify Root Causes for churners
- 113. The group to address first
- 114. Even the most preferred communication channel identified & recommended
- 115. Customer Care Assistance Module
- 116. CCA – Call Center Agent Interface
- 117. CCA – Data Query Interface
- 119. SOC to close the loop in the whole Customer Lifecycle Journey
- 120. Service Centric Operations -> Network + Service
- 121. External Operation Driven By SOC Tools Processes Organization
- 122. Example of NOC-SOC Synergy SOC NOC Service
- 123. Huawei has delivered already 30+ SOC over
- 124. Separator
- 125. Value-Experience Matrix Migration Result in Operator X
- 126. Separator
- 127. General Description
- 128. Solution Overview User distribution User quantity
- 129. Methodology KPIs and xDR are analyzed and
- 130. Best Practice
- 131. Separator
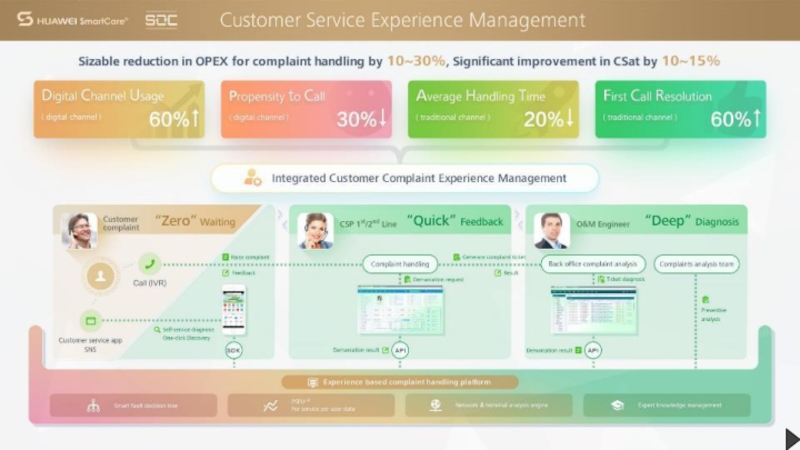
- 132. Digitizing Customer Care
- 133. Digitizing Customer Care
- 134. Digitizing Customer Care
- 135. Digitizing Customer Care
- 136. Separator
- 137. Persona–based Experience Assurance
- 138. Persona–based Experience Assurance
- 139. Persona–based Experience Assurance
- 140. Separator
- 141. Scope of Pilot – Use Case Delivery
- 142. UC 1 Implementation & Verification Milestones &
- 143. 1) Оборудование смонтировано, включено и настроено 2)
- 144. 1) Проверка полноты и целостности входных данных
- 145. Собираемые KPI

Слайд 2CEM & SQM & NPM – Huawei’s Capability
SmartCare® Business Value on
Use Cases & Demo & Moscow SQM Pilot
Global References & Why HUAWEI
Content


Слайд 4What Huawei can deliver
Platform
CEM
SQM
NPM
Geo-Location
Optimization
Tracing
Service
Set of Use Case
NPS prediction
Churn prediction
SOC Establishment
Quality Improvement
Network
Operation
Service Operation Centre
Establishment & Operation
Network Operation
Network Planning
Set of platforms / tools, services and operation support to increase Operator’s value

Слайд 5CEM & SQM & NPM – Huawei’s Capability
SmartCare® Business Value on
Use Cases & Demo & Moscow SQM Pilot
Global References & Why HUAWEI
Content

Слайд 6Savings and Earnings by Huawei CEM Platform (CCF)
Legend:
Details per stream are
Period: 5 years
5 groups – OPEX / Revenue
+ Savings on old system replacement
CCF not discounted
CCF (5th year): 20.2 Mio GBP
-0.5 Mio GBP
20.2 Mio GBP
Ramp-up period
Maximal value
Legend:Details per stream are presented in further slidesPeriod:")
Слайд 7Savings and Earnings by Huawei CEM Platform (Overview)
Estimated benefits from CEM
By additional use cases, not requested in RFP
Huawei is happy to propose / demonstrate / discuss
Estimated benefits from CEM Platform on a level")
Слайд 8CEM & SQM & NPM – Huawei’s Capability
SmartCare® Business Value on
Use Cases & Demo & Moscow SQM Pilot
Global References & Why HUAWEI
Content

Слайд 93V Demo
Architecture & Platform
First 30 days journey
Use Cases & Demo
Roaming Service
VVIP Service Quality Assurance
2G/3G/4G User Migration
NPS
Churn
CEM vs SQM
Persona Based Experience Assurance
Customer Care Assistance
Digitizing Customer Care
ARPU Driven Network Planning
Enterprise (B2B) Service Quality Assurance
Value-Experience Matrix Migration
Service Operation Centre
SQM Pilot Moscow

Слайд 10CEM & SQM & NPM – Huawei’s Capability
SmartCare® Business Value on
Use Cases & Demo & Moscow SQM Pilot
Global References & Why HUAWEI
Content


Слайд 16Group C – OPEX Savings in Consumer Operations
OPEX Savings in Consumer
Efficient CC activity and reduced number of complaints
Group
C
1.5 Mio
Detailed analysis and planning supported BC calculation for OPEX savings
Summary (details in further slides):
Reduction of AHT of massive network issues related calls by 15% (1 min savings per call)
Reduction of AHT of technical incident related calls by 10% (1.6 min per call)
Improved FCR by 20% by automated root cause analysis per End User
Improved SQ / CE leads to deduction of complaints by 20% with less complaints calls
Expected savings start from 1.5 Mio GBP per annum

Слайд 17Consumer Operations OPEX Savings Calculation Approach
Complaints
1,059,872
0.012% per User
All Calls
86 Mio per
Source
Approach
Rest Calls (Sales, Tariffs, Marketing,
Resolved at first call
FCR=70% (Benchmark)
Trouble Tickets 30%
Number of TT related Calls
Required Personnel
11.000
Staff
(CC & Retail)
Retail 8,500 (est.)
Call Centre 2,500 (est.)
AHT ~ 6.3 – 6.8 min
Marketing
Query /
Usage
Complex Issue
Incident
Call Time
6,677,196
min per year
4,928,407
min per year
+
Target
Benchmarks
Huawei expects significant savings in Call Centre by CEM Platform Implementation
Details – please see next page

Слайд 18Call Centre OPEX reduction – details and clarifications
15%
CE / SQ deterioration
Network issues calls
10%
Complaints calls
Assumed performance impact only for the 7.4% of calls
Demarcation on End User Level with pre-resolution by CEM Backend system for CC L3 will reduce technical incidents calls time by 1.6 minutes per technical incident call
How
Impacting 0.31% of all calls (only technical incidents)
20%
Network issues calls
20%
Complaints calls
Pre-automated root cause identification by CEM Backend for CC L3 helps to correlate known network issues with CE / SQ thus to reduce number of TT to NOC/SOC and to reduce time for the ticket creation
General improvement of Service Quality / Customer Experience will help to reduce potential number of complaints and will reduce number of calls
Assumed only 1.23% of all calls are related to technical
Assumed only 0.37% of all calls refer to TT creation
1.2M
0.03M
0.2M
0.07M
What
Benefits
£ 1.5 M per year

Слайд 19Group T – Technology Operations and Service Management Savings
0.4 Mio
By experience
Summary (details in further slides):
Reduction of AHT by automated demarcation within the End User TT resolution
CEM Platform allows to demarcate the issue automatically
Demarcation includes demonstration of the NE in the chain
Demarcation includes statistic and status per NE
It helps to save time and not to address to many systems within the demarcation
In BC the time reduction (for demarcation only) is counted on 50% level
Expected savings start from 0.4 Mio GBP per annum

Слайд 20Technology Operations OPEX Savings Estimation (EU TT related)
CEM shows NE chain
Applicable only for End User Trouble Tickets and reduces only demarcation time (it gives 13% of improvement time for the whole TT resolution time)
How
0.4M
Savings
£ 0.4 M per year
What
CEM shows NE chain impacting CE / SQ")
Слайд 21Business Services – Efficient Operation and extra Revenue
1.3 Mio
Extra support for
Summary (details in further slides):
Enterprise Monitoring and SLA Management
Automated operations by CEM Platform will allow to significantly save OPEX
Additional revenue / benefits were not counted here:
Huawei has a dedicated Use Case Enterprise Assurance
Estimation of extra revenue by UC Enterprise Assurance requires more input from EE
Huawei suggests to have a workshop with EE to estimate additional value for EE
New SLA offers for EE Enterprise Customers (per year)
SLA and KQI* visibility for CE will be given to Enterprises
BC calculation includes expenses for the network optimization to fulfill SLA
Expected savings start from 1.3 Mio GBP per annum
* KQI – Key Quality Indicator

Слайд 22Only OPEX savings are counted (Enterprise appreciation – is a bonus)
Enterprise
£ 0.29M per year
Platforms allows to load IMSI of Enterprise and to get all locations, NE, KPI, and KQI Indicators (otherwise it would be required to find all information, address, find cells and collect manually) – here is example for 100 Enterprises is shown
Major Savings
By CEM Platform alarms will be generated automatically for every VIP / Enterprise user. No need to monitor or to check reports on a daily basis (assumed manually it requires 20 minutes per day per Enterprise – so 4 people in parallel work)
CEM Platform will generate reports automatically on a weekly / monthly with minimal efforts per employee
Enterprise Monitoring and SLA Management£")
Слайд 23Only OPEX savings are counted (Enterprise appreciation – is a bonus)
Enterprise
£ 0.98M per year
Approach:
Enterprise gets SQ reports
Either automated reports or online portal can be given*
Enterprise pays 5% more on a monthly basis
Assumed – 10% of customers would go for it
* CEA – Customer Experience Assurance
Outcome:
Accumulated income will be completely spent for dedicated optimization
So it will become a Service Quality Assurance approach
or
No price increase – optimization costs to be covered by benefits (See above)
Benefits:
CEA* is a strong differentiation factor for Enterprises
Such an approach can help to secure business
Either to reduce churn or to increase market share
Assumed 0.1% market share increase
Enterprise Monitoring and SLA Management£")
Слайд 24Network Strategy and Core – Efficient Operation and extra Revenue
2.5 Mio
Extra
Summary (details in further slides):
Smart Investments Planning Approach (Traffic / ARPU / Complaints driven)
Analysis and setting up priorities for Cell Planning / Expansion
Analysis done by ARPU, Complaints, VIP, etc
Only OPEX savings for ARPU driven Planning Process are counted
2G-3G-4G Users Migration (per year)
Identification of the users having LTE capable handset and not using LTE network
Analysis can be done either to identify users with no subscription or wrong configuration
Potential revenue increase (by 5% for 0.5% of only postpaid subscribers)
Roaming Customers Traffic-Churn reduction
Analysis of the location / hotspots where EE lose their roamers (due to insufficient coverage)
Recovery of 1.5% of roamers is considered as a benefit for the use case
Expected savings start from 2.5 Mio GBP per annum
Efficient Operations in Network Strategy and Core Support
Efficient planning, roaming support, LTE users migration
Group
N

Слайд 25Business Case
Traffic / ARPU / Complaints Planning driven – OPEX Savings
583
60
Manually
By Huawei CEM Platform
VS
Man days
Man days
£ 0.17M per year
By ARPU / Complaints driven Planning EE can achieve better ROI and generate new revenue streams – all those will bring extra benefits for EE, which are not presented in BC at the moment (extra bonus)


Слайд 27Roaming Business Leakage Retention – Additional Revenue
Assumed: due optimized network the
This is expected to bring min 1 Mio GBP per year
Huawei CEM Platform can demonstrate areas with last roamers activity – areas of roamers losing

Слайд 28Digital Marketing – data usage / CE / SQ Info via
Digital and Marketing Impact to OPEX Savings
Digital channels reduce Customer Care Support efforts
Group
D
0.9 Mio
This case requires more detailed analysis dependant on number of queries
Summary (details in further slides):
Data usage and network experience details to customers via MyEE and online:
Ability for end users to query / see data usage via EE online or App
Customer Care efforts reduction due to digital channels migration
Simplification of the data queries by CC Agent by only one tool (instead of existing three)
Assumed agent can query information from IT system by 2 minutes shorter than before
Applicable only for the data query calls (assumed 1.7% of all calls)
Expected savings start from 0.9 Mio GBP per annum
* As there is no specific technical requirement in RFP for CEM tool to support MyEE or online complaint, MyEE or online complaint support is out of the proposal scope and needs further discuss with EE

Слайд 29Data Query Calls Efficiency Improvement – OPEX savings
2 min
Data Query Calls
CC
How
Impacting 2% of all calls (only data usage queries)
10%
Data Query Calls
Online Portal or / and APP integrated to CEM Platform (to get query results) may help to reduce up to 10% of data usage requests
Impacting 2% of all calls (only data usage queries)
0.6M
0.29M
What
Benefits
£ 0.9 M per year

Слайд 30SmartCare® Business Value on a Customer Case
Use Cases Set
Global References &
Appendix & Supportive Materials


Слайд 46CEM Platform to deliver value through use cases
SEQ Analyst
Report
Engine
Data Mediation
Web-based Application Presentation Layer
KQI/KPI
Definition
Alarm Management
Role & Auth Management
Log
System
Dashboards
Value through Use Cases for Operator’s needs


Слайд 552G to 3G to 4G Subscriber Migration Matrix
2G/3G Terminal
4G Terminal
4G
Network
2G/3G
Network
1
4G subscriber
No 4G contract subscriber
4
4G fall back subscriber
2
4G terminal locked in 2/3G subscriber
3
2/3G high traffic subscriber
5
2/3G high APRU subscriber
6
3G fall back subscriber
7
3G terminal locked
in 2G subscriber
8
No 3G contract subscriber
9
2/3G low traffic subscriber
10
3G Subscriber
11
Network optimization
Customer contact
Marketing activities

Слайд 56
Migration Analytics to Action Overview
2
4G fall back subscriber
7
3G fall back
A
Fall back subscriber : 4G device terminal using 2/3G network
3
4G terminal locked in 2/3G subscriber
8
3G terminal locked in 2G subscriber
B
Terminal locked subscriber: 4G device model terminal locked in 2/3G network
4
No 4G contract subscriber
5
2/3G high traffic subscriber
6
2/3G high APRU subscriber
9
No 3G contract subscriber
C
Potential subscriber:Need marketing support
User Segmentation
Influence factors
Action
Network
Marketing
Terminal
Contract
Package
Terminal sales
promotion
Customer care & marketing
Package adjustment
Others

Слайд 57
20X
MB / Data Subscriber / day
2014/4/3
2014/8/21
8% in 2013
2014/4/3
2014/8/21
30%
Natural Growth
( 2013)
1.7M
20X Traffic Uplift of Migrated Subscriber
66% More Traffic Increase
PSPU capability
Device type correlated with traffic type
Segmentation base on subscriber behavior
G byte / day
36%
By Migration
800
1000
1.7 million of 2G subscribers migrated to 3G
Operator has 0 cost
Best Practice in Operator U
1.7M 2G Subscriber Migrated to")


Слайд 61Roaming Quality Monitoring
Select carrier
Select KPI
Configure threshold
Perform monitoring
Key Monitored Contents:
Number of inbound
Historical trend for the number of inbound and outbound roamers
Specified KPIs and carrier
Top poor-quality carriers ranking
Supports drilldown to trend analysis.
Interfaces include MAP, CAP, ISUP, Gp, IuPS, S1MME, S8, and S6a.
KPIs of LU, Voice, SMS, and Data services

Слайд 62
Inbound and outbound roaming KPI ranking
Failure analysis and detail record analysis
Performance
Ranking
Performance
Trend
Problem
Demarcation
Performance Analysis

Слайд 63Identify steering status of carriers in different countries
Steering identification
Steering failure analysis
Steering
Steering detail record analysis
Steering Analysis


Слайд 65
International Roaming Issues
SMC
HLR
RNC
Node B
3G
Iub
BTS
BSC
Abis
GRX
SGSN
(PCU)
2G
SS7
GGSN
ISTP
VMSC
ISTP
GGSN
HLR
Local
Visit Network
A
IuCS
Gb
IuPS
CD
E
MAP
CAP
ISUP
Gr
Gp
Gp
KPI Monitoring
GRQ Reporting
Traffic Distribution
Gain & Lost Report
Background:
The right partnerships are critical for optimal roaming revenues(Best Roaming Experience and Appropriate Rate);
The operator need detailed, prioritized and actionable information to avoid roaming revenues lost;
The operator need finely solution to optimize network for increase roaming traffic
Value Proposition:
Increase roaming traffic
Fast fine and locate inbound roaming barriers
Indentify the outbound roaming destination gaps
Avoid roaming revenue lost
Detect roaming fraud behaviors
Provide proofs for controversial roaming billing settlement
Reduce MTTR of roaming issue
Real-time roaming traffic and performance monitoring
Deeply root cause analyze base on per roamers
Gain new business opportunity
Provide competitive SLA to gain more roaming partners
Up-sell promotion base on rich roaming service analysis
SEQ Analyst Platform
International Roaming Analysis
2GSS7GGSNISTPVMSCISTPGGSNHLRLocal networkVisit NetworkAIuCSGbIuPSCDEMAPCAPISUPGrGpGpKPI MonitoringGRQ ReportingTraffic DistributionGain & Lost")


Слайд 69VIP Assurance
360°VIP Understanding:
What application the VIP is using.
Where the VIP is.
What handset the VIP using.
What network assets are being using.
What errors the customer experiencing.
Used to:
Understand the VIP Failure in real-time.
Fast analyze any problem of VIP.
Measure the impact of service decline to VIP.
Provide data source to evaluate the QOE of VIP.
Steer the optimization to improve VIP experience.
VIP Report
VIP Analysis
VIP Tracing
SQM
VIP Care
Customer Care
Churn Predict
NPS Analysis
CEI

Слайд 70VIP and VIP Groups Real Time Monitoring
VIP Management :
1 000 VVIPs
2 000 VIP Groups Under Real-Time Care
Voice service and packet service.
Drill down analysis to call trace
Customer Group Management:
Grouping customer by data consumption volume, spending characteristics, device, etc.
Analysis by distribution, terminal, root cause
VIP Subscriber
Location Map
VIP Subscriber
Failure Alert
CS Service : Voice, SMS
PS Service : MMS, Web, WAP, Streaming, Email …
VIP Group CS and PS Service Quality monitoring

Слайд 71VIP Experience Insight
User 1, High revenue generator
Like surfing in internet and
Real-time KQI alarm triggered
Device Analysis
Experience Insight
Discover VIP’s service abnormity within 1 minute


Слайд 73Customer Experience from whole Customer Journey
Advertisement
Product Information
Product Comparison
Subscribing
Activating
Using
Paying
Requesting for Help
Resolving
Prolonging /
Here are touch points within a complete Customer Journey


Слайд 75Contract Prolongation Experience
Pro-active care experience
Selection Experience
Trouble Resolution Experience
Use
Experience
Response Experience
Activation Experience
Churn Experience
Billing
KPI from each Point to create CEI of End User
CEI – Customer Experience Indicator
Do you already cover complete Customer Journey for your CEM?
Some Touch Points examples

Слайд 76
Snapshot to show Impact to User Experience
Using
Sharing
Trouble resolution request
Getting resolution
Change Request
Experiencing
User
User BBB
User CCC
User DDD
User XXX
User YYY
User ZZZ
User DDD
User GGG
User HHH
User PPP
User AAA
How many users at this moment stuck in Activation or waiting for Trouble Resolution?
What is the real most concerned factor for majority of Users?
Have you got a system to see CEI for all Touch Points?

Слайд 77
How it works – Info to be gathered from whole ICT
Using
Sharing
Trouble
Getting resolution
Change Request
Experiencing
Report Example:
Response Rate
Response Time
Best Response Time Window
etc
Report Example:
First Page visit
Purchase rate
Abandoning page
etc

Слайд 78See at whole and by details to improve by Influencer
CEI (or
Marketing
Billing
Network
Customer Care
Operation
Unhappy customers:
User AAA
User BBB
User CCC
User DDD
Happy customers:
User XXX
User YYY
User ZZZ
User XYZ
MarketingBillingNetworkCustomer CareOperationUnhappy customers:User AAAUser")


Слайд 81
Internet
WAP / MMS
M2M
Voice
Facebook?
Instagram?
SMS
It is hard to manage quality of
What kind of service we manage quality for?
YouTube?

Слайд 82
SQM is a typical entity existing almost in all network operators
From

Слайд 83
Experience
Service
capability
CEM correlates real Experience and Customer Expectations
From Service Quality to Customer
(Committed) Quality
 Quality")
Слайд 84
Objective measures
Subjective measures
Aggregation in all journeys
and in the user level
Aggregation in
Aggregation in the touch point level and in the user level
Merge of subjective and objective to have real CEI

Слайд 85CEM Summary – from traditional QoS to QoE driven CEM
Enhanced SQM
Objective (experience) + Subjective (expectations)
Business driven by Customer Experience
Service
Centricity
User
CEM is a new way of Business in Digital Telco World
Enhanced operation + Traditional SOC
User Experience
Oriented operation


Слайд 88UNCOVER NPS INFLUENCING FACTORS PER PERSONA
Factors Where The Customer Expectation
Factors Where The Customer Expectation is Low Offer an Opportunity to Delight. Good Performance Creates Promoters and Positive WoM.


Слайд 91NPS Detractors – not a one but many different groups
All Users
We cannot simply improve NPS by same / one action(s) for all users
What to do and where to start?
What to do?
Detailed view on Promoters and Detractors with particular step(s) for every group
Why I cannot make a call?
Why tariffs are so complex?
Why Web loading time is so long?
How can I check my balance?
≠
≠

Слайд 92Net Promoter Score Prediction Framework
8000 DNA-pattern maps
Source: 24 countries
Approach: Individual User
…
Setup
Surveyed Focus Group
DNA Patterns learned from Global NPS Experience
Pattern Recognition
Mass Application
Predictive NPS Score
Outcome
Geo-Map, Table, Top users / cells

Слайд 93Let us imagine – measured NPS is 10 (%)
10
Shall we use
10Shall we use same improvement mechanism for")
Слайд 94User Centric
Differentiated
Quality Excellence
Address Expectations of every NPS Score Group
Benchmarking
Best capability
Newest technologies
Exceeding
VMOS
Video Quality
CDR
Integrity &
Service Quality
Coverage
Call SSR
Billing
Availability / Accessibility
Fast response
Pro-active care
Digital Channels
Communication & Resolution
Personalized services
Omni Channels
Innovative
Personalization &
Empathy
0 - 2
Actions
NPS Group
3 - 4
5 - 6
7 - 8
9-10
From Stable Performance
to Excellent Quality
User Oriented Operation
Best Network &
Best Operator


Слайд 101Why we should manage Churn?
New subscriber attraction cost is 3..10 times
Loyalty decrease of 5% causes 25% revenue loss
Packages/tariffs promotion success rate is only 15% for new subscribers, while for existing subscribers it's 50%
Annual churn decrease of 5% might increase revenue by 25-85%


Слайд 103Methodology
Better Result by Experience Oriented Churn Detection
SmartCare Churn Prediction Model
Based on
Traditional Churn Prediction Model
Based on BSS Data)
Usage
Time
Transition
Point
Real Churn
Point
Churn Point
Recognized
By System
User decides to leave
Golden Period
Transition Period
Fake Living Period
Experience
Attitude
Behavior
Traditional")
Слайд 104Decide to leave
Transition Point
Real Churn Point
Customer usage based analytics from BSS
2-4 weeks advanced
4 Months advanced
Change operator
Source: China Unicom SH
HUAWEI Churn Prediction Solution Highlight

Слайд 105
Customer Segmentation
From contract based segmentation
MOT Design 1: 6 types of
Retention Offer
From one-offer-fits-all
MOT Design 2: Various personalized retention offers for personas
Channel & Time
Inside-out Channel & Timing Allocation
MOT design 3: Outside-in preferred channel & time allocation
Current Value
Potential Value
Influence
Value Chaser
Entertainer
Socializer
Business Elite
Family Focused
Heavy User
persona
root cause
*IPR apply processing
Marketing Closed Loop
- Retention Process Consulting Enriched By Analytics

Слайд 106Reference Case - early predication & MOT improve retention effect
The churn rate of “Retention Group” is much lower than the ones of “Base Case” and “Control Group” based on accurate & 4 months ahead churn predication with MOT designed retention offer
Source: China Unicom SH

Слайд 107Achieved 2.4% Churn Rate Reduction
~49,000
Subscribers successfully retained
during 7 months (Jun-Dec 2015)
2.4
Churn Rate Reduction in 24 Months
136 USD
Subscriber CLV captured
Precision Rate : 77.0%
Recall Rate : 49.1%
Warning Period : 4 Months advance
Network
Closed loop
Marketing
Closed loop
2.4 Pct.Churn Rate Reduction in")


Слайд 113
The group to address first
Different value groups show customers that bring


Слайд 120Service Centric Operations -> Network + Service
NOC
SOC
Network
KPI
SLA
MTTR
Experience
KQI
CSAT
NPS
Service
Content
+
Benefits
Service Quality Monitoring
Service
Closed-loop complaint handling
KQI Demarcation for Data Service
VIP Care
Partner with Customer Care
Fast Response to New Service launch
…..


Слайд 122Example of NOC-SOC Synergy
SOC
NOC
Service Quality Monitoring & Reporting
Service Problem Demarcation
Troubleshooting &
SQDT Related Service Alarms
SQDT
SQDT
(User & Service Impact)
User & Service Impact Request
Verification
Override TT with Service Impact information from SQDT
Create new TT and correlate with SQDT
Ticket Exists
No
Yes
Prioritize Ticket based on Service Impact

Слайд 123Huawei has delivered already 30+ SOC over the world
Service Operation Centre


Слайд 125Value-Experience Matrix Migration Result in Operator X
1X.x% improvement in revenue
Subscriber are
Before
After


Слайд 128Solution Overview
User distribution
User quantity trend
Traffic trend
Application-based traffic distribution
Range-based traffic distribution
User-based traffic
KQI trend
Failure cause distribution
TOP VAPs
Traffic model
Abnormal user identification

Слайд 129Methodology
KPIs and xDR are analyzed and problem scenarios are reproduced to


Слайд 141Scope of Pilot – Use Case Delivery
5 Use Cases supporting operation

Слайд 142UC 1 Implementation & Verification
Milestones & Progress
Feb
Apr
Mar
Jan
03.01
04.0
02.01
01.01
Platform Installation, Commissioning
Use Case Delivery
Complaint
Real-time Monitoring of super VIP customers
B2B clients SLA Monitoring
Proactive monitoring and problem resolution for own and roaming subscribers
Analysis of Terminal
11.01
12.01
Nov
Sep
Oct
01.13
09.01
May
05.01
We Are Here
10.01
Training
MGF Test
Dec
Cutover
Cutover got started on Apr 18, almost done, data check work didn’t start before project got stopped
Power-on & 3.1 Upgrade
Suspended
Jan
Feb
01.01
MegaFon requested to have preliminary trial results by end of Oct. 2016
It’s proposed to focus on Use Case 1 Complaint Handling delivery for phase 1, due to limited time left for delivery
3.1 upgrade is completed
UC 2 Implementation & Verification
MGF Test
UC 3 Implementation & Verification
MGF Test
UC 4 Implementation & Verification
MGF Test
UC 5 Implementation & Verification
MGF Test
Data Check
02.01

Слайд 1431) Оборудование смонтировано, включено и настроено
2) Программное обеспечение установлено
3) Произведены отладочные
4) Завершена интеграция с различными IS/IT системами (CC, NRI, TT)
5) Сформирована и русифицирована экспертная система рекомендаций для L1/L2
6) Настроена и русифицирована система root cause analysis для L3
7) Проведено обучение сотрудников МегаФон
8) Предоставлен доступ к решению сотрудникам МегаФон
Выполненные работы
 Оборудование смонтировано, включено и настроено 2) Программное обеспечение установлено3) Произведены отладочные работы4) Завершена интеграция")
Слайд 1441) Проверка полноты и целостности входных данных 2) Калибровка KPI/KQI, установка пороговых
3) Реализация, имплементация и демонстрация пяти юзкейсов
4) Расширение проб-серверов и установка TDM-конвертеров
5) Передача системы в пользование
6) Подготовка и реализация юзкейсов по анализу NPS и оттока абонентов
7) Интеграция с Metricell Agent
Текущие и запланированные работы
 Проверка полноты и целостности входных данных 2) Калибровка KPI/KQI, установка пороговых значений аварий3) Реализация,")