- Главная
- Разное
- Дизайн
- Бизнес и предпринимательство
- Аналитика
- Образование
- Развлечения
- Красота и здоровье
- Финансы
- Государство
- Путешествия
- Спорт
- Недвижимость
- Армия
- Графика
- Культурология
- Еда и кулинария
- Лингвистика
- Английский язык
- Астрономия
- Алгебра
- Биология
- География
- Детские презентации
- Информатика
- История
- Литература
- Маркетинг
- Математика
- Медицина
- Менеджмент
- Музыка
- МХК
- Немецкий язык
- ОБЖ
- Обществознание
- Окружающий мир
- Педагогика
- Русский язык
- Технология
- Физика
- Философия
- Химия
- Шаблоны, картинки для презентаций
- Экология
- Экономика
- Юриспруденция
Pharmaceutical monitoring and evaluation презентация
Содержание
- 1. Pharmaceutical monitoring and evaluation
- 2. Topics Concepts on pharmaceutical assessment/monitoring The
- 3. Pharmaceutical monitoring/ evaluation Monitoring Review of the
- 4. Who can use the results from assessment
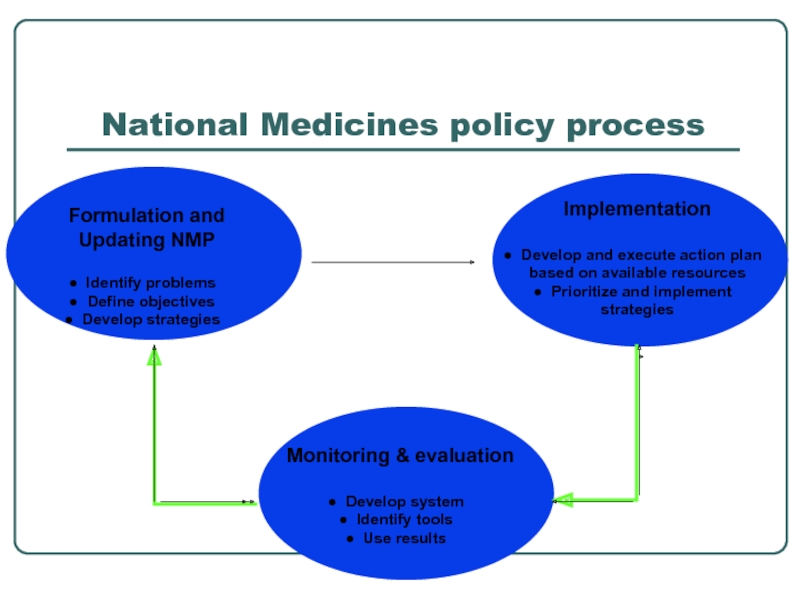
- 5. Develop implementation plans and identify strategies &
- 6. National Medicines policy process
- 7. WHO hierarchical approach to monitoring and assessing
- 8. Level I indicators: structure and process indicators
- 9. Level II- facility outcome and impactindicators: WHO
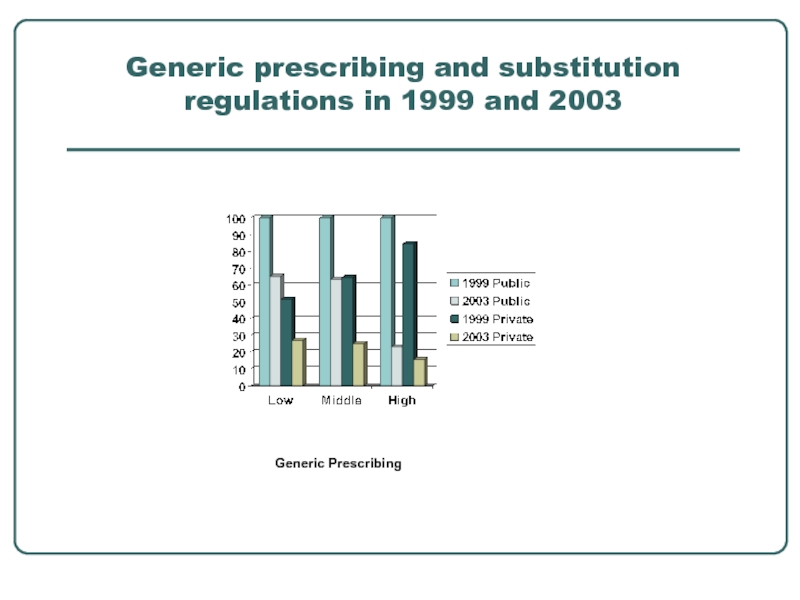
- 10. Generic prescribing and substitution regulations in 1999 and 2003 Generic Prescribing
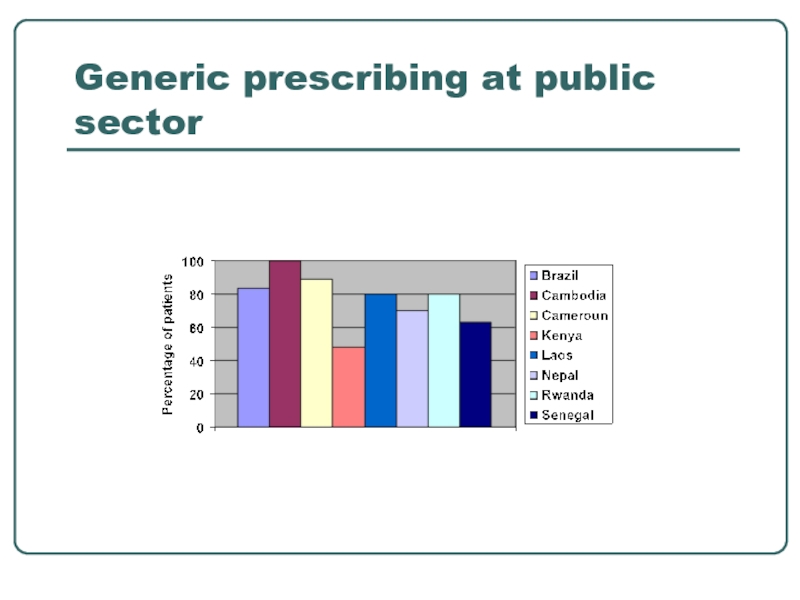
- 11. Generic prescribing at public sector
- 12. Measuring access to essential medicines ( Household
- 13. Importance of household survey
- 14. Indicators: (few examples) Affordability Average
- 15. Indicators: (few examples) Rational Use
- 16. Current issues on household survey
- 17. Level III Indicators Systematic survey and monitoring
- 18. Sampling issues for systematic survey Follow specific
- 19. Sampling Recommendation for Level II facility survey
- 20. The household survey sampling scheme
- 21. Is the sampling frame valid? (clustering in
- 22. Error due to simple random sampling
- 23. Who can be trained to do the
- 24. Preparing and implementing systematic survey Administrative
- 25. Pharmaceutical indicators Variables that measure situations and
- 26. Why is it important to use indicators?
- 27. Indicator allows comparison
- 28. Monitoring if there is progress or none
- 29. Setting target
- 30. Indicator measure: group norm Example: % antibiotic prescribing (logical value is
- 31. Summarizing indicator measures Percentage: yes or no
- 32. Indicator measure: Ideal/logical values Logical value exist
- 33. Connecting Survey Results and Interventions
- 34. The way forward on country monitoring Evidence
- 35. THANK YOU THANK YOU
Слайд 1Pharmaceutical monitoring and evaluation
Dr. Edelisa D. Carandang
Medicines Policy & Supply Management
Department
World Health Organization, Geneva
Oct 2007
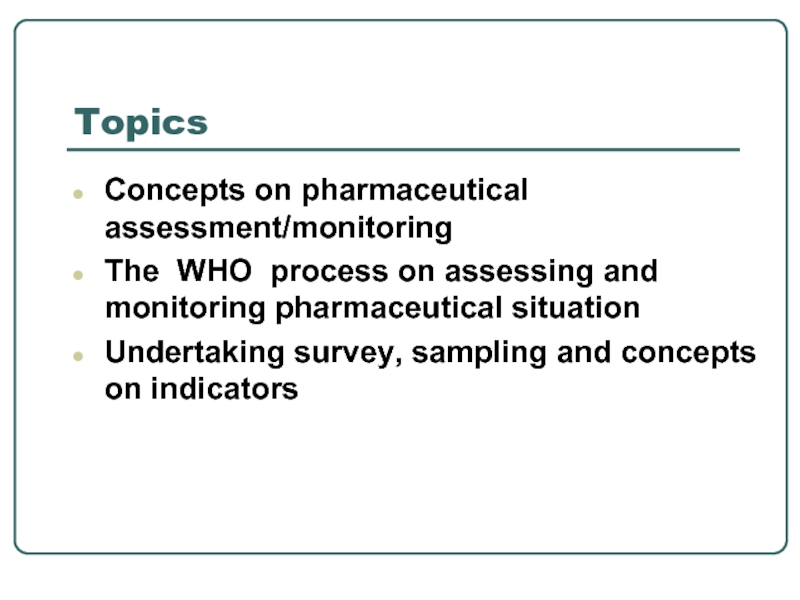
Слайд 2Topics
Concepts on pharmaceutical assessment/monitoring
The WHO process on assessing and monitoring
Undertaking survey, sampling and concepts on indicators
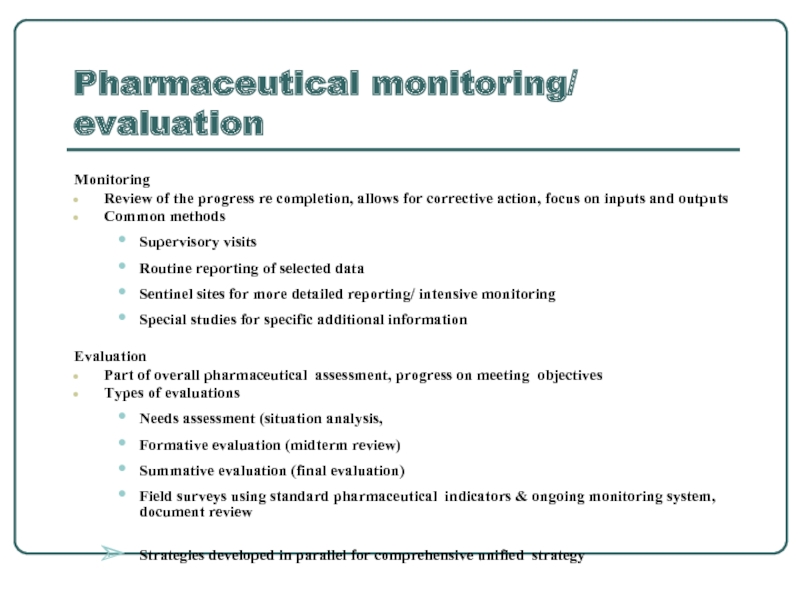
Слайд 3Pharmaceutical monitoring/ evaluation
Monitoring
Review of the progress re completion, allows for corrective
Common methods
Supervisory visits
Routine reporting of selected data
Sentinel sites for more detailed reporting/ intensive monitoring
Special studies for specific additional information
Evaluation
Part of overall pharmaceutical assessment, progress on meeting objectives
Types of evaluations
Needs assessment (situation analysis,
Formative evaluation (midterm review)
Summative evaluation (final evaluation)
Field surveys using standard pharmaceutical indicators & ongoing monitoring system, document review
Strategies developed in parallel for comprehensive unified strategy
Слайд 4Who can use the results from assessment and monitoring?
Countries - focus
National policy-makers
synchronise policies
data and information to donors and other governmental agencies
International agencies
to assess the structure and capability of countries, assess the progress, accomplishment and impact of aid
Professional groups, NGOs and academia
to focus advocacy activities and information campaigns
Health facilities to be aware of institutional problems & improve situations
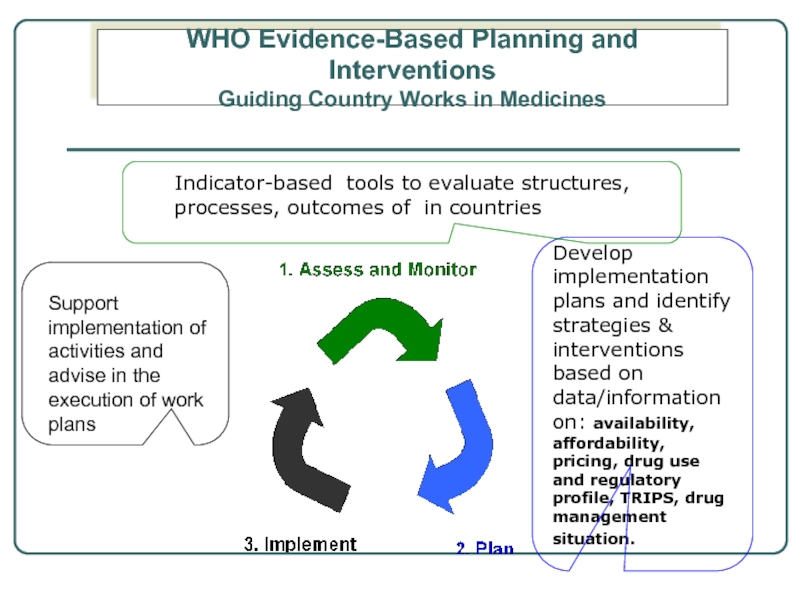
Слайд 5Develop implementation plans and identify strategies & interventions based on data/information
Support implementation of activities and advise in the execution of work plans
Indicator-based tools to evaluate structures, processes, outcomes of in countries
WHO Evidence-Based Planning and Interventions
Guiding Country Works in Medicines
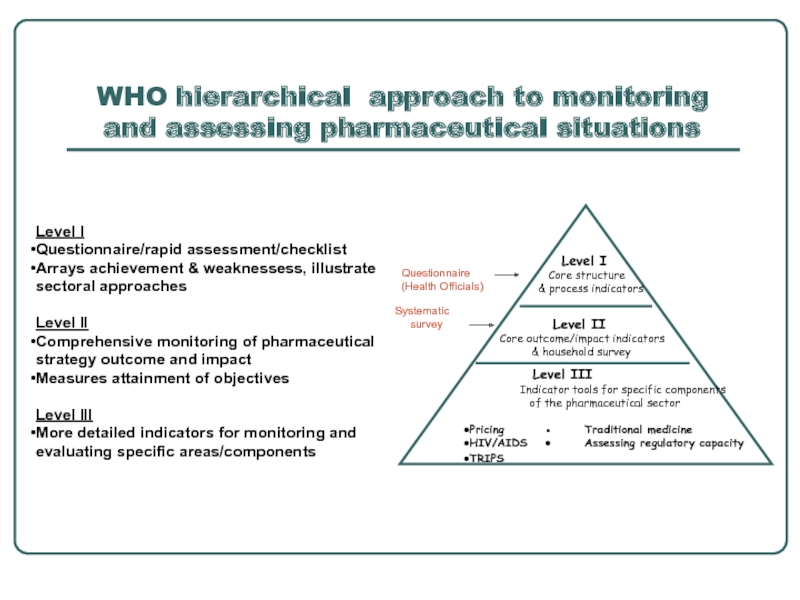
Слайд 7WHO hierarchical approach to monitoring and assessing pharmaceutical situations
Level I
Core
& process indicators
Level II
Core outcome/impact indicators
& household survey
Level III
Indicator tools for specific components
of the pharmaceutical sector
Pricing ● Traditional medicine
HIV/AIDS ● Assessing regulatory capacity
TRIPS
Systematic
survey
Questionnaire
(Health Officials)
Level I
Questionnaire/rapid assessment/checklist
Arrays achievement & weaknessess, illustrate sectoral approaches
Level II
Comprehensive monitoring of pharmaceutical strategy outcome and impact
Measures attainment of objectives
Level III
More detailed indicators for monitoring and evaluating specific areas/components
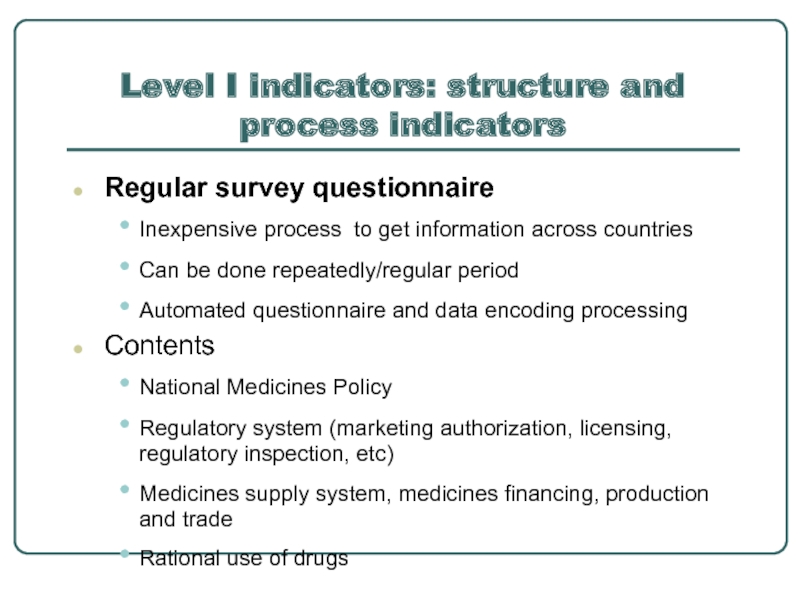
Слайд 8Level I indicators: structure and process indicators
Regular survey questionnaire
Inexpensive process to
Can be done repeatedly/regular period
Automated questionnaire and data encoding processing
Contents
National Medicines Policy
Regulatory system (marketing authorization, licensing, regulatory inspection, etc)
Medicines supply system, medicines financing, production and trade
Rational use of drugs
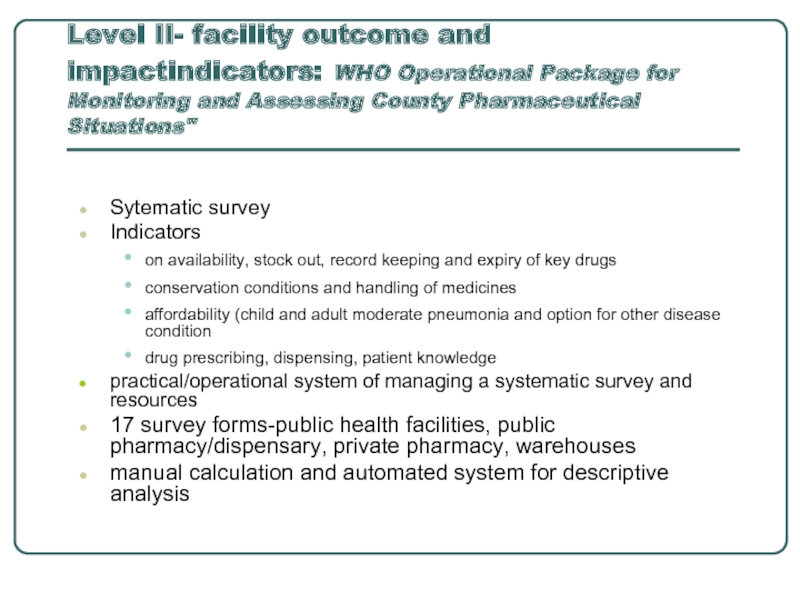
Слайд 9Level II- facility outcome and impactindicators: WHO Operational Package for Monitoring
Sytematic survey
Indicators
on availability, stock out, record keeping and expiry of key drugs
conservation conditions and handling of medicines
affordability (child and adult moderate pneumonia and option for other disease condition
drug prescribing, dispensing, patient knowledge
practical/operational system of managing a systematic survey and resources
17 survey forms-public health facilities, public pharmacy/dispensary, private pharmacy, warehouses
manual calculation and automated system for descriptive analysis
Слайд 12Measuring access to essential medicines ( Household Survey)
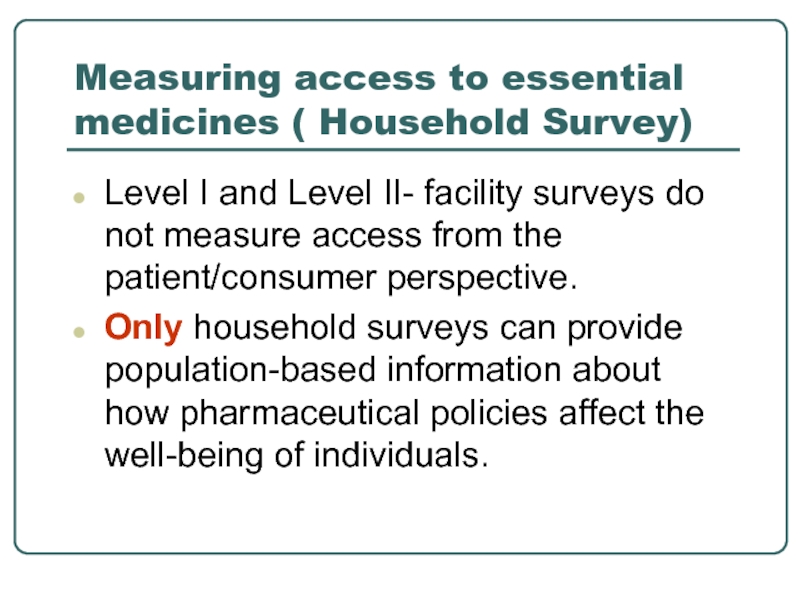
Level I and Level
Only household surveys can provide population-based information about how pharmaceutical policies affect the well-being of individuals.
Слайд 13
Importance of household survey
Household situations
How they access their medicines,
How much they pay
Identify access and affordability in relation to socio economic indicators, barriers
Examine use of medicines (acute and chronic diseases)
Perceptions on access, use and quality; handling of medicines
Слайд 14
Indicators: (few examples)
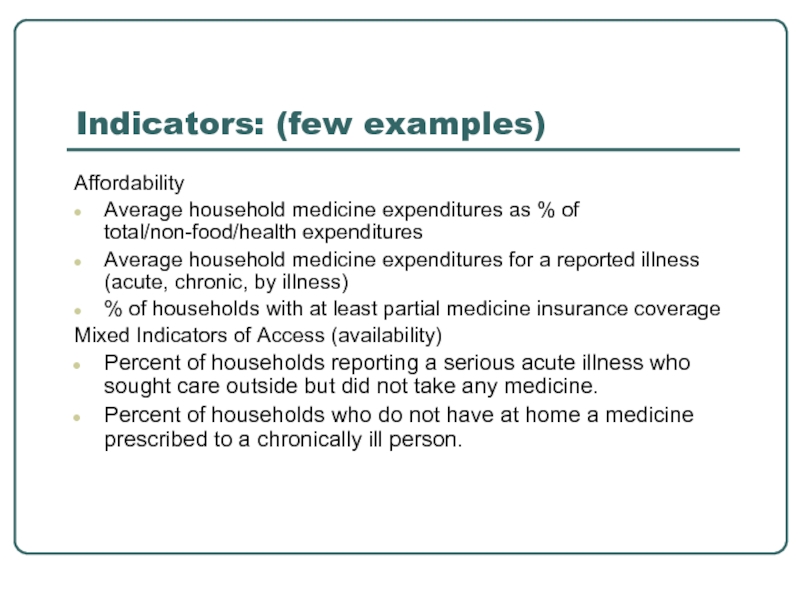
Affordability
Average household medicine expenditures as % of total/non-food/health expenditures
Average
% of households with at least partial medicine insurance coverage
Mixed Indicators of Access (availability)
Percent of households reporting a serious acute illness who sought care outside but did not take any medicine.
Percent of households who do not have at home a medicine prescribed to a chronically ill person.
Слайд 15
Indicators: (few examples)
Rational Use of Medicines
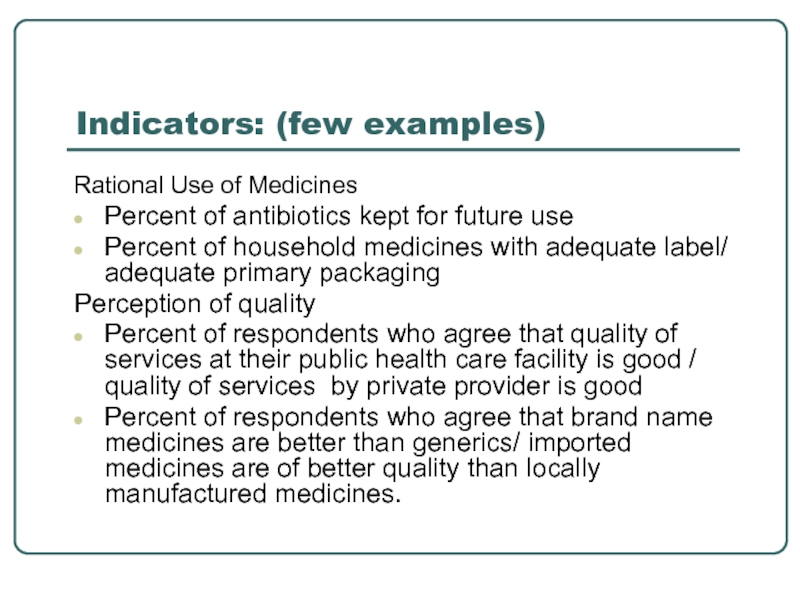
Percent of antibiotics kept for future
Percent of household medicines with adequate label/ adequate primary packaging
Perception of quality
Percent of respondents who agree that quality of services at their public health care facility is good / quality of services by private provider is good
Percent of respondents who agree that brand name medicines are better than generics/ imported medicines are of better quality than locally manufactured medicines.
Слайд 16
Current issues on household survey process
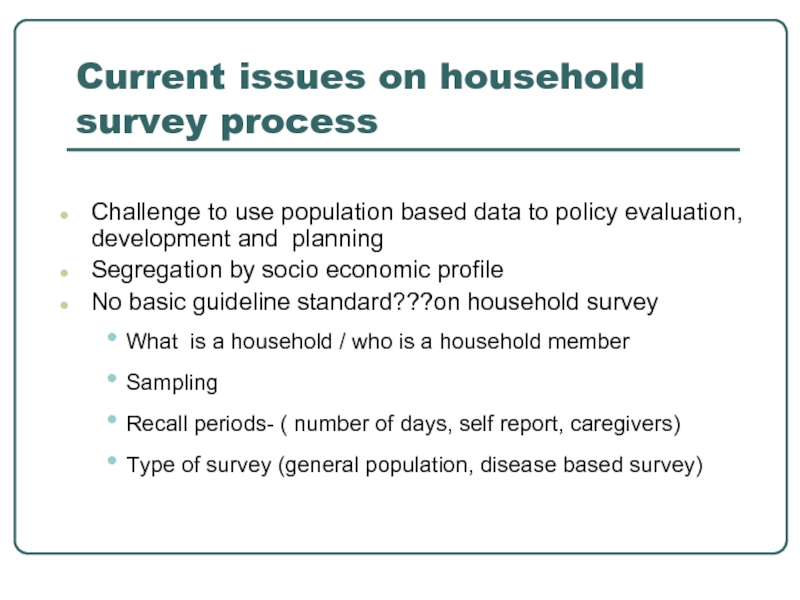
Challenge to use population based data
Segregation by socio economic profile
No basic guideline standard???on household survey
What is a household / who is a household member
Sampling
Recall periods- ( number of days, self report, caregivers)
Type of survey (general population, disease based survey)
Слайд 17Level III Indicators
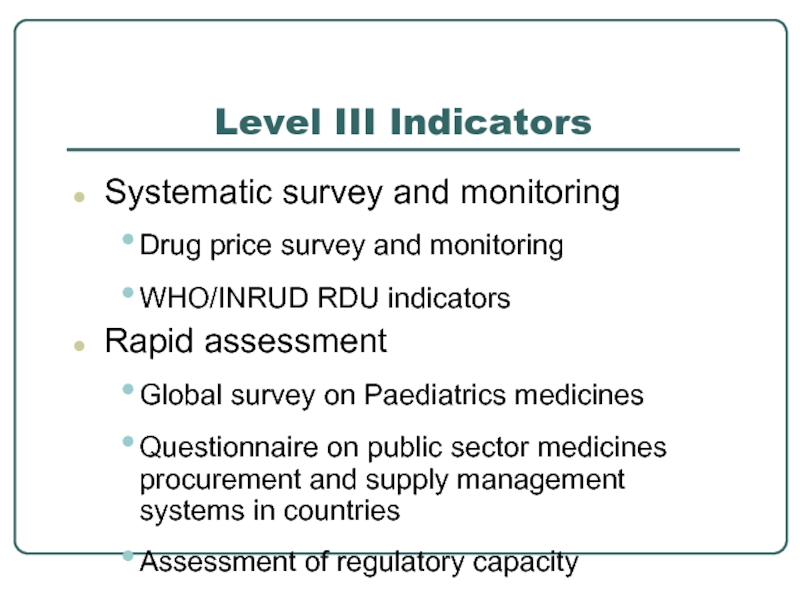
Systematic survey and monitoring
Drug price survey and monitoring
WHO/INRUD RDU
Rapid assessment
Global survey on Paediatrics medicines
Questionnaire on public sector medicines procurement and supply management systems in countries
Assessment of regulatory capacity
Слайд 18Sampling issues for systematic survey
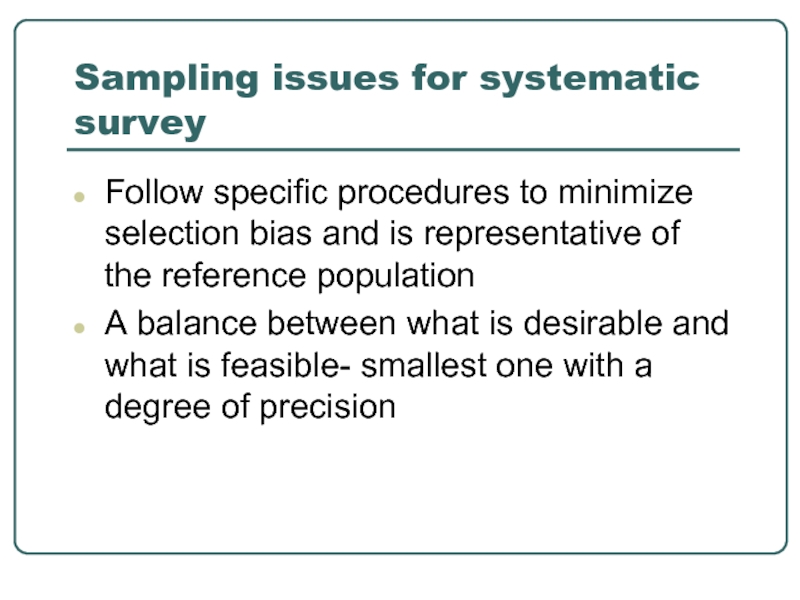
Follow specific procedures to minimize selection bias
A balance between what is desirable and what is feasible- smallest one with a degree of precision
Слайд 19Sampling Recommendation for Level II facility survey
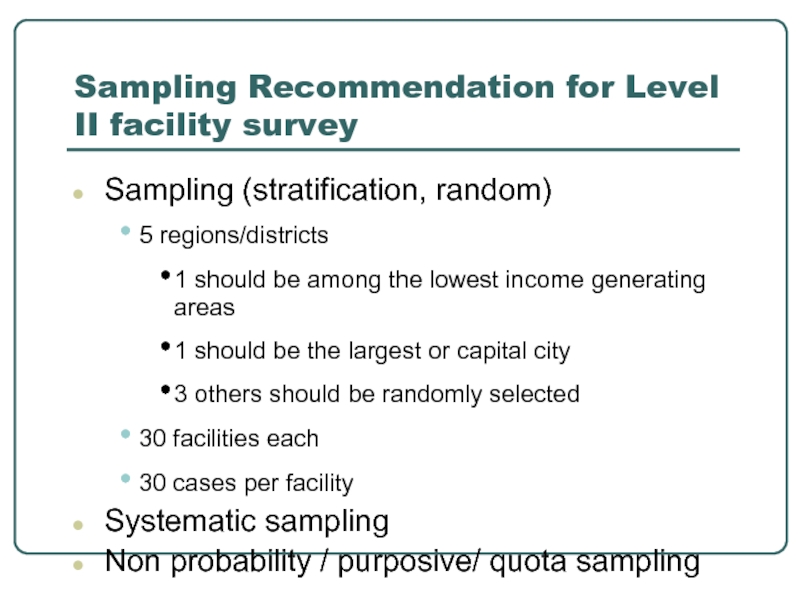
Sampling (stratification, random)
5 regions/districts
1
1 should be the largest or capital city
3 others should be randomly selected
30 facilities each
30 cases per facility
Systematic sampling
Non probability / purposive/ quota sampling
Слайд 20
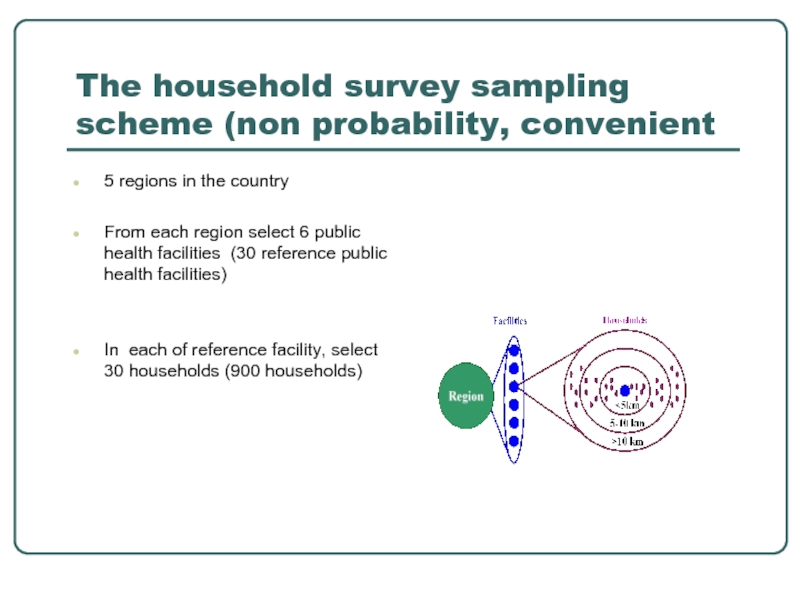
The household survey sampling scheme (non probability, convenient
5 regions in
From each region select 6 public health facilities (30 reference public health facilities)
In each of reference facility, select 30 households (900 households)
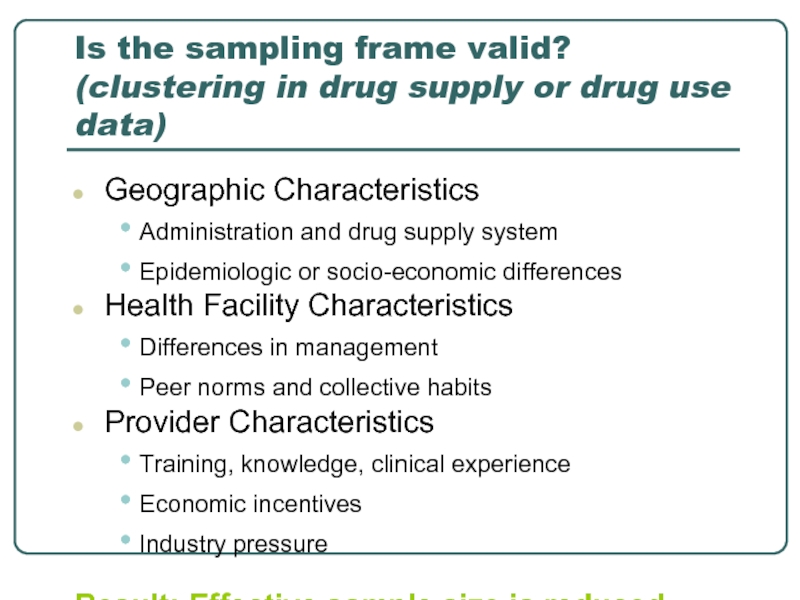
Слайд 21Is the sampling frame valid? (clustering in drug supply or drug
Geographic Characteristics
Administration and drug supply system
Epidemiologic or socio-economic differences
Health Facility Characteristics
Differences in management
Peer norms and collective habits
Provider Characteristics
Training, knowledge, clinical experience
Economic incentives
Industry pressure
Result: Effective sample size is reduced
Слайд 23Who can be trained to do the survey?
Physicians, nurses, pharmacists or
Health ministry/department staff and temporary employees (health related background and experience)
data collectors from different parts of the country (language differences)
Слайд 24Preparing and implementing systematic survey
Administrative preparation:
Coordinating with WHO, ministry/department
Making logistic arrangements and budget allocations
Technical requirements:
Tailoring the tool-specific items of the survey forms, e.g. key basket of medicines, treatment guidelines, etc.
Training data collectors to carry out the survey and use the survey and summary forms
Analyzing and computing the data
Preparing a report and using result
Слайд 25Pharmaceutical indicators
Variables that measure situations and change
Numerical ( numbers, percentage, or
Binomials (yes” and “no)”
Linked to an important input, process, or outcome
Well-established indicators can be adapted/ modified to reflect the realities
Field test
Слайд 26Why is it important to use indicators?
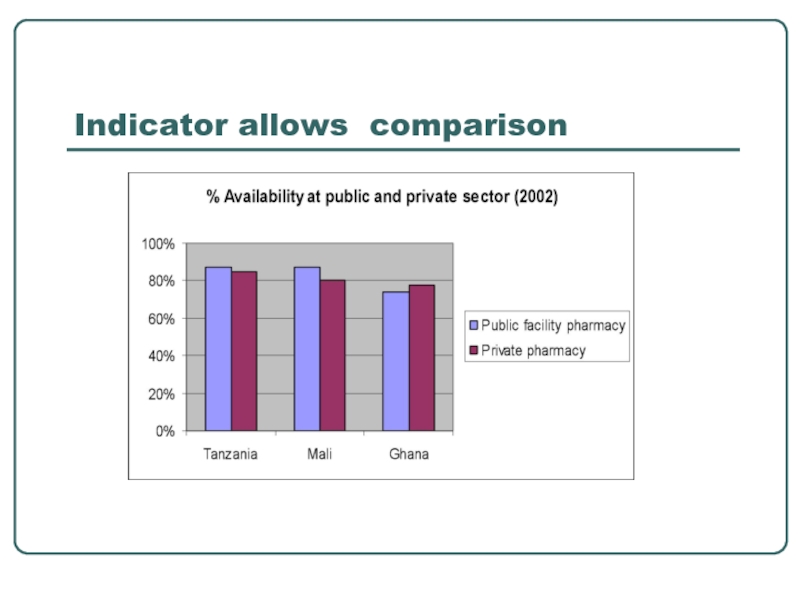
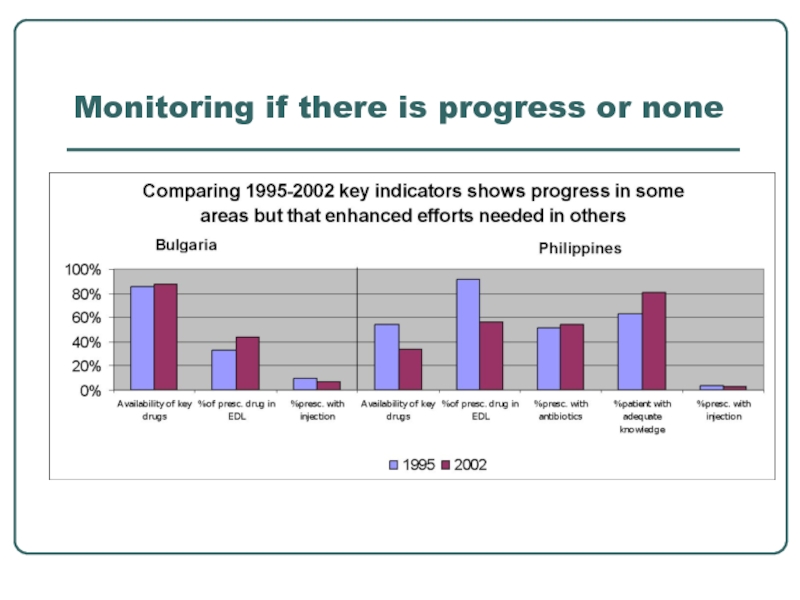
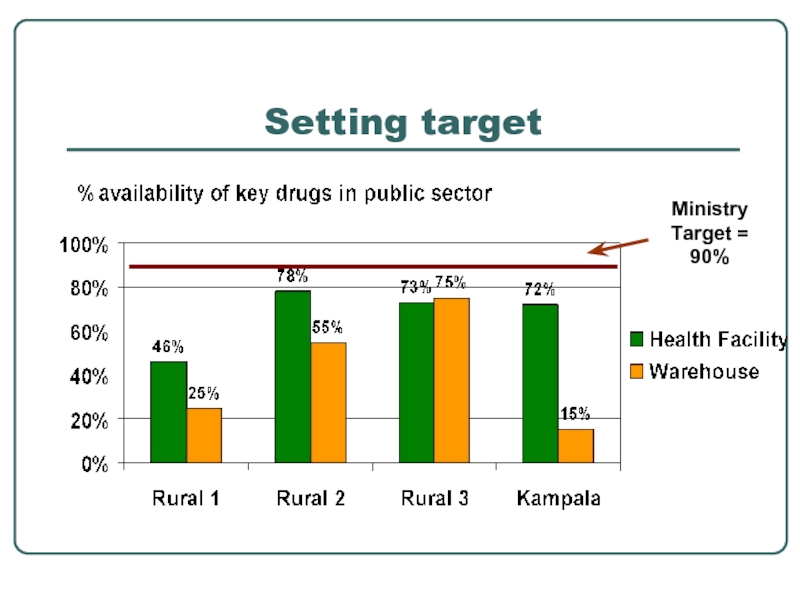
Standard indicators facilitates:
comparing the performance
seeing trends over time
setting target
Слайд 30Indicator measure: group norm
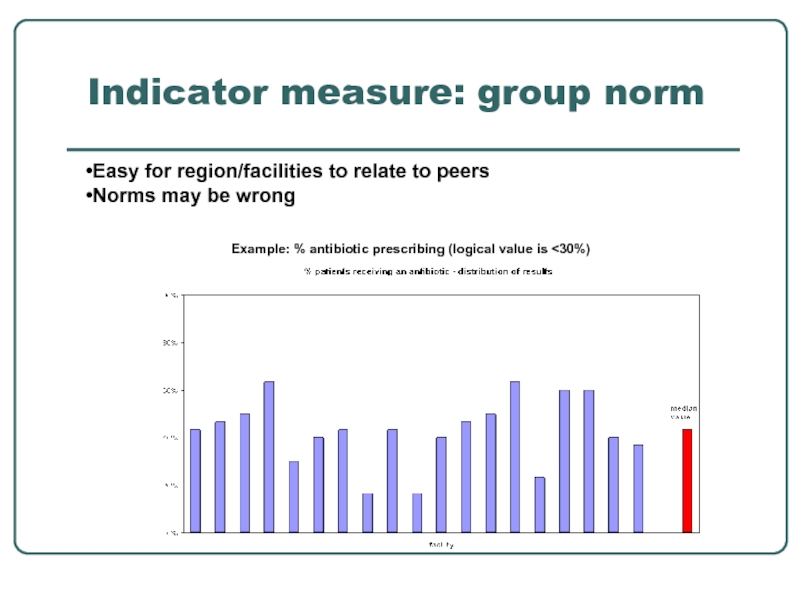
Example: % antibiotic prescribing (logical value is
Easy for region/facilities to relate to peers
Norms may be wrong
Слайд 31Summarizing indicator measures
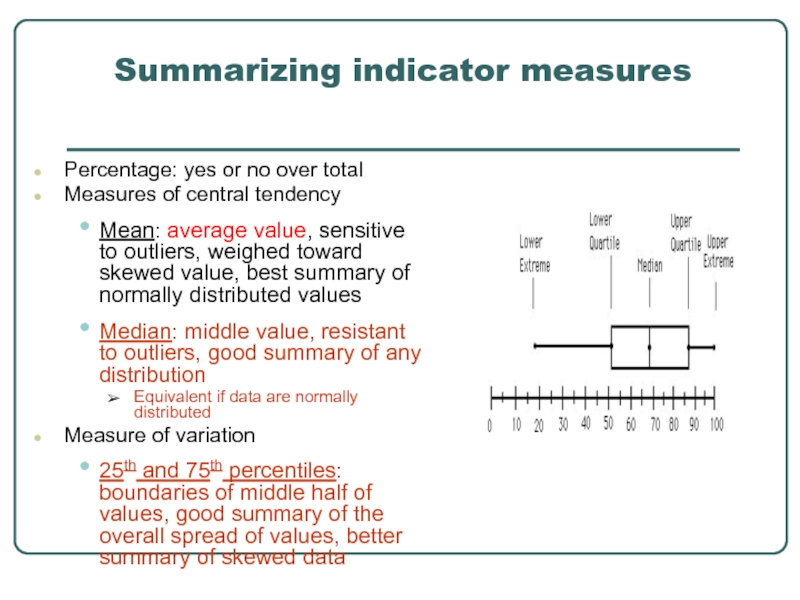
Percentage: yes or no over total
Measures of central
Mean: average value, sensitive to outliers, weighed toward skewed value, best summary of normally distributed values
Median: middle value, resistant to outliers, good summary of any distribution
Equivalent if data are normally distributed
Measure of variation
25th and 75th percentiles: boundaries of middle half of values, good summary of the overall spread of values, better summary of skewed data
Слайд 32Indicator measure: Ideal/logical values
Logical value exist for some
Logical value (100%-adequate labelling,
Others need further studies
affordability ( economic profile)
Antibiotic use and injection, meds prescribes are more complex- are (<30, <20 and < 2 and can be controversial)
Optimal value largely depend on disease pattern, policies and treatment G/L and vary from country to country
These values can be calculated empirically
Слайд 34The way forward on country monitoring
Evidence through systematic but feasible data
Should demonstrate that in the long run regular monitoring and evaluation is not difficult and can be done in a cost efficient manner
Portion of country support budget and project grants should be allotted to monitoring and evaluation using indicators
Timely report and information/data sharing
