- Главная
- Разное
- Дизайн
- Бизнес и предпринимательство
- Аналитика
- Образование
- Развлечения
- Красота и здоровье
- Финансы
- Государство
- Путешествия
- Спорт
- Недвижимость
- Армия
- Графика
- Культурология
- Еда и кулинария
- Лингвистика
- Английский язык
- Астрономия
- Алгебра
- Биология
- География
- Детские презентации
- Информатика
- История
- Литература
- Маркетинг
- Математика
- Медицина
- Менеджмент
- Музыка
- МХК
- Немецкий язык
- ОБЖ
- Обществознание
- Окружающий мир
- Педагогика
- Русский язык
- Технология
- Физика
- Философия
- Химия
- Шаблоны, картинки для презентаций
- Экология
- Экономика
- Юриспруденция
Correlation and regression презентация
Содержание
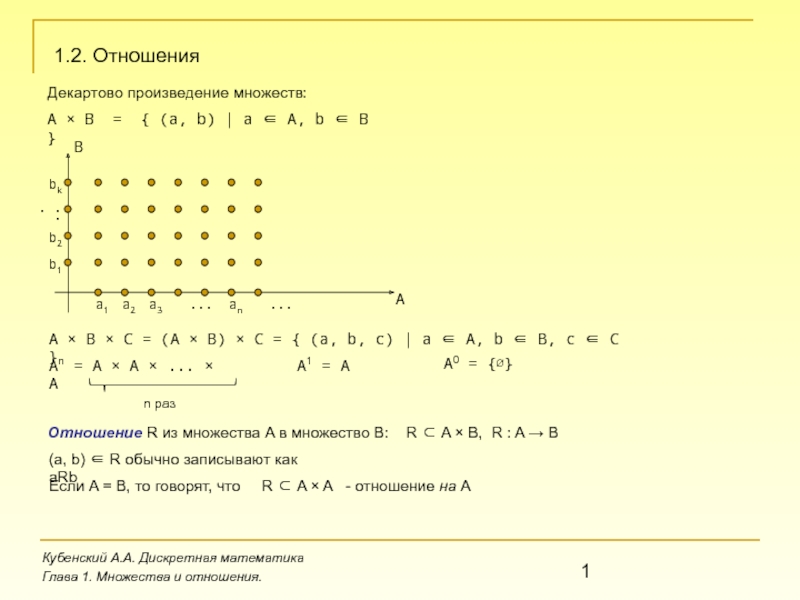
- 1. Correlation and regression
- 2. Chapter Outline 9.1 Correlation 9.2 Linear Regression
- 3. Correlation Section 9.1
- 4. Section 9.1 Objectives Introduce linear correlation, independent
- 5. Correlation Correlation A relationship between two
- 6. Correlation A scatter plot can be used
- 7. Types of Correlation Negative Linear Correlation Positive
- 8. Example: Constructing a Scatter Plot A marketing
- 9. Solution: Constructing a Scatter Plot Appears to
- 10. Example: Constructing a Scatter Plot Using Technology
- 11. Solution: Constructing a Scatter Plot Using Technology
- 12. Correlation Coefficient Correlation coefficient A measure of
- 13. Correlation Coefficient The range of the correlation
- 14. Linear Correlation Strong negative correlation Weak positive
- 15. Calculating a Correlation Coefficient Find the sum
- 16. Calculating a Correlation Coefficient Square each x-value
- 17. Example: Finding the Correlation Coefficient Calculate the
- 18. Solution: Finding the Correlation Coefficient 540 294.4
- 19. Solution: Finding the Correlation Coefficient Σx =
- 20. Example: Using Technology to Find a Correlation
- 21. Solution: Using Technology to Find a Correlation
- 22. Using a Table to Test a Population
- 23. Using a Table to Test a Population
- 24. Using a Table to Test a Population
- 25. Using a Table to Test a Population
- 26. Example: Using a Table to Test a
- 27. Solution: Using a Table to Test a
- 28. Hypothesis Testing for a Population Correlation Coefficient
- 29. Hypothesis Testing for a Population Correlation Coefficient
- 30. The t-Test for the Correlation Coefficient Can
- 31. Using the t-Test for ρ State the
- 32. Using the t-Test for ρ Find the
- 33. Example: t-Test for a Correlation Coefficient Previously
- 34. Solution: t-Test for a Correlation Coefficient H0:
- 35. Correlation and Causation The fact that two
- 36. Correlation and Causation Is there a reverse
- 37. Section 9.1 Summary Introduced linear correlation, independent

Слайд 2Chapter Outline
9.1 Correlation
9.2 Linear Regression
9.3 Measures of Regression and Prediction Intervals
9.4


Слайд 4Section 9.1 Objectives
Introduce linear correlation, independent and dependent variables, and the
Find a correlation coefficient
Test a population correlation coefficient ρ using a table
Perform a hypothesis test for a population correlation coefficient ρ
Distinguish between correlation and causation

Слайд 5Correlation
Correlation
A relationship between two variables.
The data can be represented
x is the independent (or explanatory) variable
y is the dependent (or response) variable

Слайд 6Correlation
A scatter plot can be used to determine whether a linear
Example:
 correlation exists")
Слайд 7Types of Correlation
Negative Linear Correlation
Positive Linear Correlation
Nonlinear Correlation
As x increases, y
As x increases, y tends to increase.

Слайд 8Example: Constructing a Scatter Plot
A marketing manager conducted a study to

Слайд 9Solution: Constructing a Scatter Plot
Appears to be a positive linear correlation.

Слайд 10Example: Constructing a Scatter Plot Using Technology
Old Faithful, located in Yellowstone

Слайд 11Solution: Constructing a Scatter Plot Using Technology
Enter the x-values into list
Use Stat Plot to construct the scatter plot.
From the scatter plot, it appears that the variables have a positive linear correlation.

Слайд 12Correlation Coefficient
Correlation coefficient
A measure of the strength and the direction of
The symbol r represents the sample correlation coefficient.
A formula for r is
The population correlation coefficient is represented by ρ (rho).
n is the number of data pairs

Слайд 13Correlation Coefficient
The range of the correlation coefficient is -1 to 1.
If
If r = 1 there is a perfect positive correlation
If r is close to 0 there is no linear correlation

Слайд 14Linear Correlation
Strong negative correlation
Weak positive correlation
Strong positive correlation
Nonlinear Correlation
r = −0.91
r
r = 0.42
r = 0.07

Слайд 15Calculating a Correlation Coefficient
Find the sum of the x-values.
Find the sum
Multiply each x-value by its corresponding y-value and find the sum.
In Words In Symbols

Слайд 16Calculating a Correlation Coefficient
Square each x-value and find the sum.
Square each
Use these five sums to calculate the correlation coefficient.
In Words In Symbols

Слайд 17Example: Finding the Correlation Coefficient
Calculate the correlation coefficient for the advertising

Слайд 18Solution: Finding the Correlation Coefficient
540
294.4
440
624
252
294.4
372
473
5.76
2.56
4
6.76
1.96
2.56
4
4.84
50,625
33,856
48,400
57,600
32,400
33,856
34,596
46,225
Σx = 15.8
Σy = 1634
Σxy = 3289.8
Σx2
Σy2 = 337,558

Слайд 19Solution: Finding the Correlation Coefficient
Σx = 15.8
Σy = 1634
Σxy = 3289.8
Σx2
Σy2 = 337,558
r ≈ 0.913 suggests a strong positive linear correlation. As the amount spent on advertising increases, the company sales also increase.

Слайд 20Example: Using Technology to Find a Correlation Coefficient
Use a technology tool

Слайд 21Solution: Using Technology to Find a Correlation Coefficient
STAT > Calc
To calculate
r ≈ 0.979 suggests a strong positive correlation.

Слайд 22Using a Table to Test a Population Correlation Coefficient ρ
Once the
Use Table 11 in Appendix B.
If |r| is greater than the critical value, there is enough evidence to decide that the correlation coefficient ρ is significant.

Слайд 23Using a Table to Test a Population Correlation Coefficient ρ
Determine whether
If |r| > 0.959, the correlation is significant. Otherwise, there is not enough evidence to conclude that the correlation is significant.
Number of pairs of data in sample
level of significance

Слайд 24Using a Table to Test a Population Correlation Coefficient ρ
Determine the
Specify the level of significance.
Find the critical value.
Determine n.
Identify α.
Use Table 11 in Appendix B.
In Words In Symbols

Слайд 25Using a Table to Test a Population Correlation Coefficient ρ
Decide if the correlation is significant.
Interpret the decision in the context of the original claim.
If |r| > critical value, the correlation is significant. Otherwise, there is not enough evidence to support that the correlation is significant.

Слайд 26Example: Using a Table to Test a Population Correlation Coefficient ρ
Using

Слайд 27Solution: Using a Table to Test a Population Correlation Coefficient ρ
n
|r| ≈ 0.979 > 0.396
There is enough evidence at the 5% level of significance to conclude that there is a significant linear correlation between the duration of Old Faithful’s eruptions and the time between eruptions.

Слайд 28Hypothesis Testing for a Population Correlation Coefficient ρ
A hypothesis test can
A hypothesis test can be one-tailed or two-tailed.

Слайд 29Hypothesis Testing for a Population Correlation Coefficient ρ
Left-tailed test
Right-tailed test
Two-tailed test
H0:
H0: ρ ≤ 0 (no significant positive correlation)
Ha: ρ > 0 (significant positive correlation)
H0: ρ = 0 (no significant correlation)
Ha: ρ ≠ 0 (significant correlation)

Слайд 30The t-Test for the Correlation Coefficient
Can be used to test whether
The test statistic is r
The standardized test statistic
follows a t-distribution with d.f. = n – 2.
In this text, only two-tailed hypothesis tests for ρ are considered.

Слайд 31Using the t-Test for ρ
State the null and alternative hypothesis.
Specify the
Identify the degrees of freedom.
Determine the critical value(s) and rejection region(s).
State H0 and Ha.
Identify α.
d.f. = n – 2.
Use Table 5 in Appendix B.
In Words In Symbols

Слайд 32Using the t-Test for ρ
Find the standardized test statistic.
Make a decision
Interpret the decision in the context of the original claim.
In Words In Symbols
If t is in the rejection region, reject H0. Otherwise fail to reject H0.

Слайд 33Example: t-Test for a Correlation Coefficient
Previously you calculated
r ≈ 0.9129.

Слайд 34Solution: t-Test for a Correlation Coefficient
H0:
Ha:
α =
d.f. =
Rejection
Test Statistic:
-2.447
2.447
5.478
Decision:
At the 5% level of significance, there is enough evidence to conclude that there is a significant linear correlation between advertising expenses and company sales.
Reject H0

Слайд 35Correlation and Causation
The fact that two variables are strongly correlated does
If there is a significant correlation between two variables, you should consider the following possibilities.
Is there a direct cause-and-effect relationship between the variables?
Does x cause y?

Слайд 36Correlation and Causation
Is there a reverse cause-and-effect relationship between the variables?
Does
Is it possible that the relationship between the variables can be caused by a third variable or by a combination of several other variables?
Is it possible that the relationship between two variables may be a coincidence?

Слайд 37Section 9.1 Summary
Introduced linear correlation, independent and dependent variables and the
Found a correlation coefficient
Tested a population correlation coefficient ρ using a table
Performed a hypothesis test for a population correlation coefficient ρ
Distinguished between correlation and causation