task for groups
Questions -
Research Hypotheses –
Null hypotheses -
Alternate hypotheses-
Your topic -
ecology of water bodies
- Главная
- Разное
- Дизайн
- Бизнес и предпринимательство
- Аналитика
- Образование
- Развлечения
- Красота и здоровье
- Финансы
- Государство
- Путешествия
- Спорт
- Недвижимость
- Армия
- Графика
- Культурология
- Еда и кулинария
- Лингвистика
- Английский язык
- Астрономия
- Алгебра
- Биология
- География
- Детские презентации
- Информатика
- История
- Литература
- Маркетинг
- Математика
- Медицина
- Менеджмент
- Музыка
- МХК
- Немецкий язык
- ОБЖ
- Обществознание
- Окружающий мир
- Педагогика
- Русский язык
- Технология
- Физика
- Философия
- Химия
- Шаблоны, картинки для презентаций
- Экология
- Экономика
- Юриспруденция
Area Ecosystem Population презентация
Содержание
- 1. Area Ecosystem Population
- 2. You are a scientist in the field
- 3. Data collection and analysis Methods of mathematical
- 4. Types of statistical test T-test (Student’s
- 5. T-test 2 test groups Determining the differences
- 6. Example of research question Which species of
- 7. Examples of Hypotheses Research Hypotheses
- 8. Methods of ecological research Laboratory method Experimental
- 9. Objectives of field researches Determine (определить) the
- 10. Methods of field research Lay out and
- 12. Example Question: Which part of the school
- 13. Method of research (squares method or key
- 14. Data collection Number of dandelions on the school garden
- 15. Step 1 Calculate the mean value
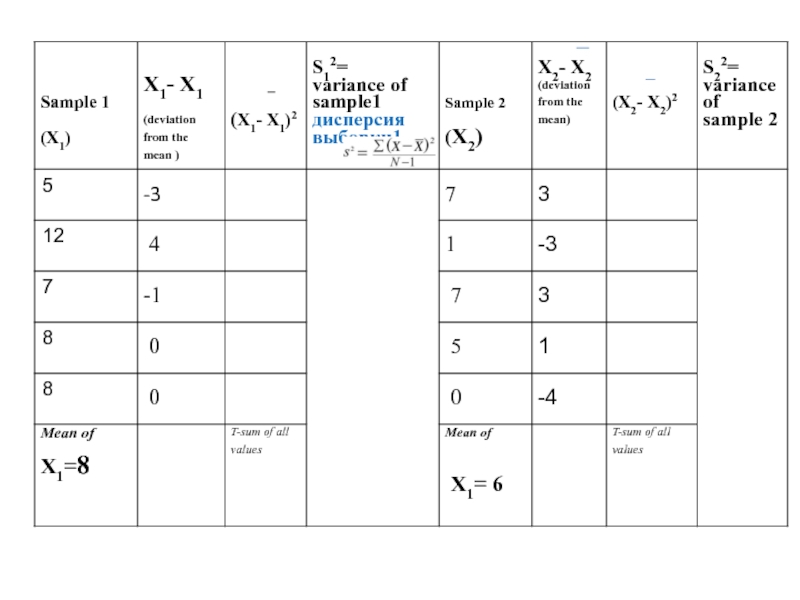
- 17. Step 2 Calculate the deviation from
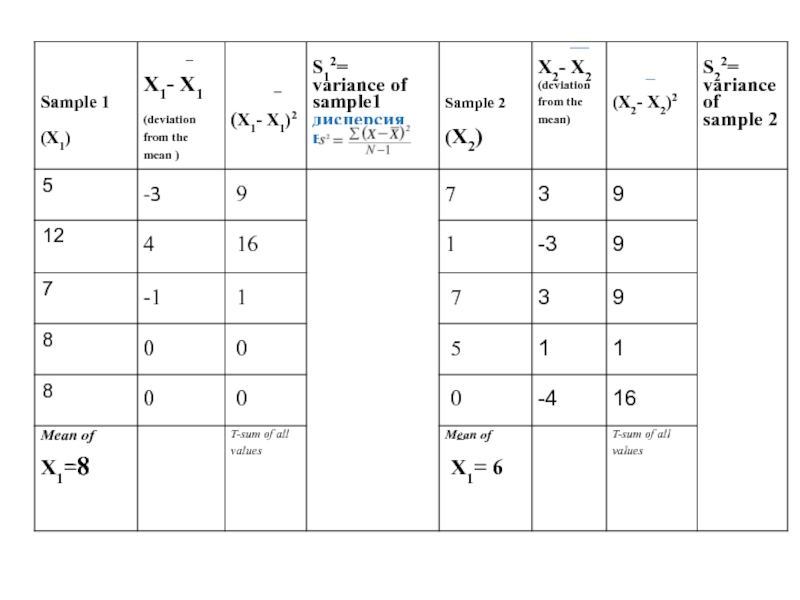
- 19. Step 3 Square the deviation from the mean for both the samples
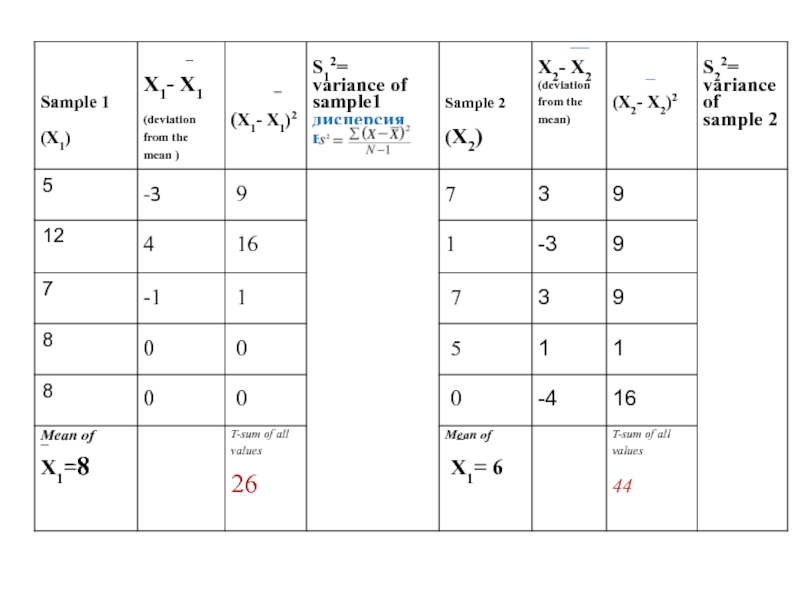
- 21. Step 4 Calculate the sum of the squares
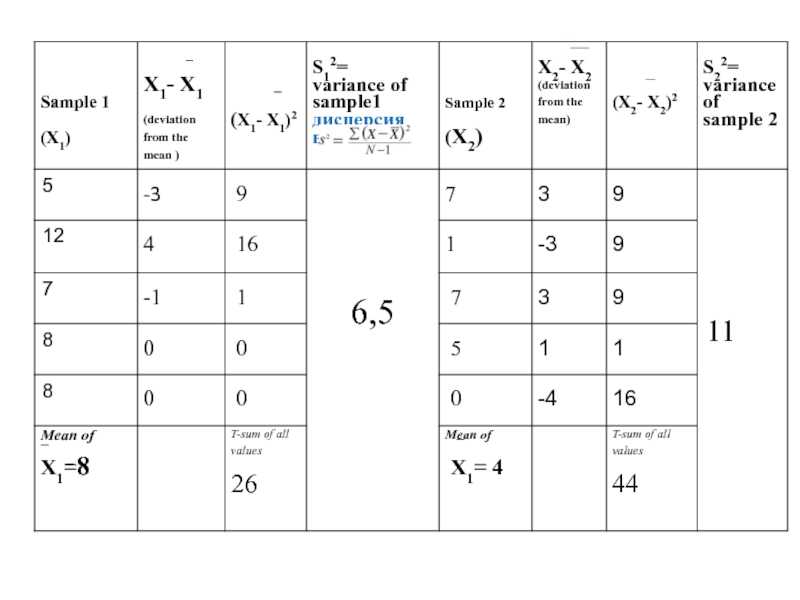
- 23. Step 5 Calculate the variance for both the samples
- 25. Step 6 calculate the value of T using the formula provided in the Table
- 26. T –value Х1 - среднее значение
- 27. Answer 2,14
- 28. Step 7 Calculate the degree of freedom
- 29. Step 8 Find the critical value using the t- table
- 30. Degree of freedom 2,31
- 31. Data analysis If the T-value is less
- 32. Analysis of results If the null hypothesis
- 33. Conclusion There is no significant difference in

Слайд 2You are a scientist in the field of ecology and you
were given the task to determine the population of squirrels in a pine forest.
How do you do that?

Слайд 3Data collection and analysis
Methods of mathematical statistics
The application of these methods
makes it possible to get an objective view on a particular (определённая) population

Слайд 4Types of statistical test
T-test (Student’s T-test)
Use to test the equality of
the average values in two samples
(проверка равенства средних значений в двух выборках)
(проверка равенства средних значений в двух выборках)
Chi- squared test (X2).
Use if using categorical variables (if you are evaluating the differences between experimental data and expected or hypothetical data)… Example: expected distribution of organisms
(оценка различий между экспериментальными данными и ожидаемыми данными)
Use to test the equality of the average values in")
Слайд 5T-test
2 test groups
Determining the differences between the two groups
One or more
samples per group are made

Слайд 6Example of research question
Which species of pine (Scotch or Kulunda) are more
common in Kazakhstan?
Scotch pine (сосна обыкновенная)
Kulunda pine (сосна Кулундинская)
 are more common in Kazakhstan? Scotch")
Слайд 7Examples of Hypotheses
Research Hypotheses
In Kazakhstan the Kulunda pine is
more common
Statistical hypotheses
Null hypotheses (Ho)
Ho – there is no difference in the prevalence of Scots pine or Kulunda pine
Alternate hypotheses
Ha – there IS a difference in the predominance of Scots pine or Kulunda pine
Statistical hypotheses
Null hypotheses (Ho)
Ho – there is no difference in the prevalence of Scots pine or Kulunda pine
Alternate hypotheses
Ha – there IS a difference in the predominance of Scots pine or Kulunda pine

Слайд 8Methods of ecological research
Laboratory method
Experimental and experimental method
Field method
The objects of
field research can be living organisms, populations, species and their natural communities

Слайд 9Objectives of field researches
Determine (определить)
the distribution (распространение), abundance (численность) and quality
of the species, population, biocenosis, ecosystem of lakes, rivers and other objects
the influence of abiotic, biotic, anthropogenic factors on organisms
the influence of abiotic, biotic, anthropogenic factors on organisms
the distribution (распространение), abundance (численность) and quality of the species, population,")
Слайд 10Methods of field research
Lay out and describe a sample area (закладка
и описание пробных площадей (ключевых участков))
The sizes of sample areas (squares) for groups of plants are 1, 10, 100 m², for forests - an area of 100 - 5000 m²
The main indicator of the research is the quantitative registration of organisms
The sizes of sample areas (squares) for groups of plants are 1, 10, 100 m², for forests - an area of 100 - 5000 m²
The main indicator of the research is the quantitative registration of organisms

Слайд 12Example
Question: Which part of the school garden has more dandelions?
Research hypothesis:
Null
hypothesis:
Alternate hypothesis:
Alternate hypothesis:

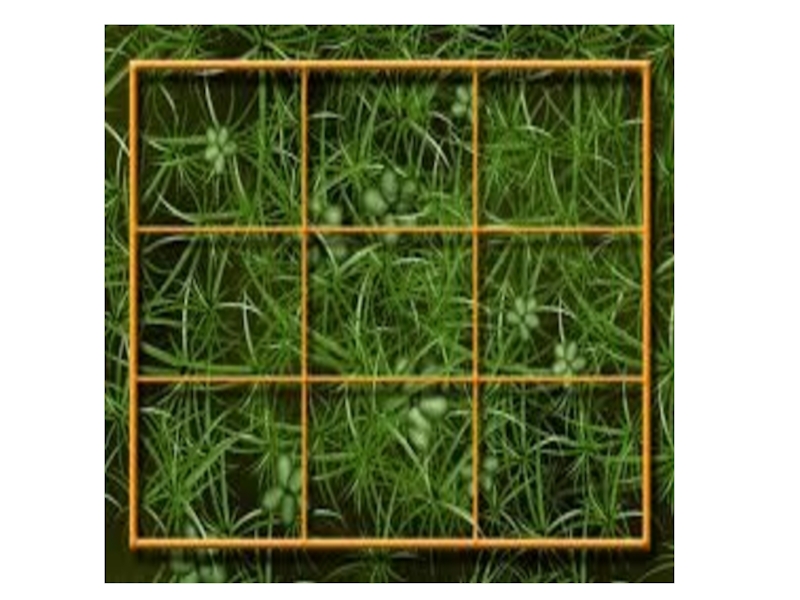
Слайд 13Method of research (squares method or key sites) метод квадратов или
ключевых участков
Select the sample area.
Lay out a square grid of known size.
Count the dandelions in each grid.
Repeat this 5 times for both the locations.
Tabulate the data.
Analyze the data.
 метод квадратов или ключевых участковSelect the sample")


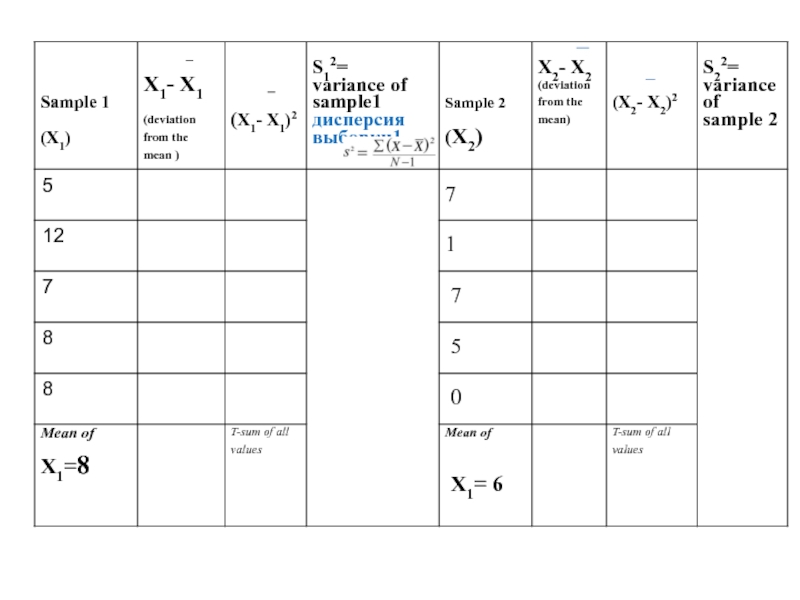
Слайд 17Step 2
Calculate the deviation from mean by subtracting the mean from
the value of X for both the samples
Рассчитать отклонение от среднего значения путем вычитания среднего по величине X для обоих образцов.
Рассчитать отклонение от среднего значения путем вычитания среднего по величине X для обоих образцов.


Слайд 26T –value
Х1 - среднее значение выборки 1
Х2 - среднее значение
выборки 2
S1²- дисперсия выборки 1
S2²- дисперсия выборки 2
N₁ - частота выборки 1
N₂ - частота выборки 2
S1²- дисперсия выборки 1
S2²- дисперсия выборки 2
N₁ - частота выборки 1
N₂ - частота выборки 2


 – 2= 8")


Слайд 31Data analysis
If the T-value is less than the critical value, then
accept the null hypothesis Если Т-значение меньше критического значения, то следует принять нулевую гипотезу
If the T-value is bigger than the critical value, the null hypothesis should be rejected Если Т-значение больше, чем критическое значение следует отклонить нулевую гипотезу
Null hypothesis: There are no differences in the number of dandelions on the western and eastern sides of the school garden
2,14 2,31

Слайд 32Analysis of results
If the null hypothesis is accepted, then there was
NO significant difference in the distribution of dandelions in the school garden
If the null hypothesis is rejected, then there was a significant difference in the distribution of dandelions in the school garden
If the null hypothesis is rejected, then there was a significant difference in the distribution of dandelions in the school garden

Слайд 33Conclusion
There is no significant difference in the distribution of dandelions in
the school garden on the western and eastern territories