Walkable Streets
@danielequercia @rschifan @lajello @walkonomics
- Главная
- Разное
- Дизайн
- Бизнес и предпринимательство
- Аналитика
- Образование
- Развлечения
- Красота и здоровье
- Финансы
- Государство
- Путешествия
- Спорт
- Недвижимость
- Армия
- Графика
- Культурология
- Еда и кулинария
- Лингвистика
- Английский язык
- Астрономия
- Алгебра
- Биология
- География
- Детские презентации
- Информатика
- История
- Литература
- Маркетинг
- Математика
- Медицина
- Менеджмент
- Музыка
- МХК
- Немецкий язык
- ОБЖ
- Обществознание
- Окружающий мир
- Педагогика
- Русский язык
- Технология
- Физика
- Философия
- Химия
- Шаблоны, картинки для презентаций
- Экология
- Экономика
- Юриспруденция
The Digital Life of Walkable Streets презентация
Содержание
- 1. The Digital Life of Walkable Streets
- 2. We cannot afford to leave architecture to architects
- 3. We cannot afford to leave computers to engineers
- 4. Neil Gershenfeld Director of MIT’s Center
- 6. U C L
- 7. U C L daniele quercia
- 8. U C L
- 9. U C L
- 10. U C L
- 11. U C L
- 14. offline & online
- 17. Jane Jacob Kevin Lynch
- 18. Quiet Happy Beauty Google for “Happy Maps”
- 19. The shortest Path to Happiness
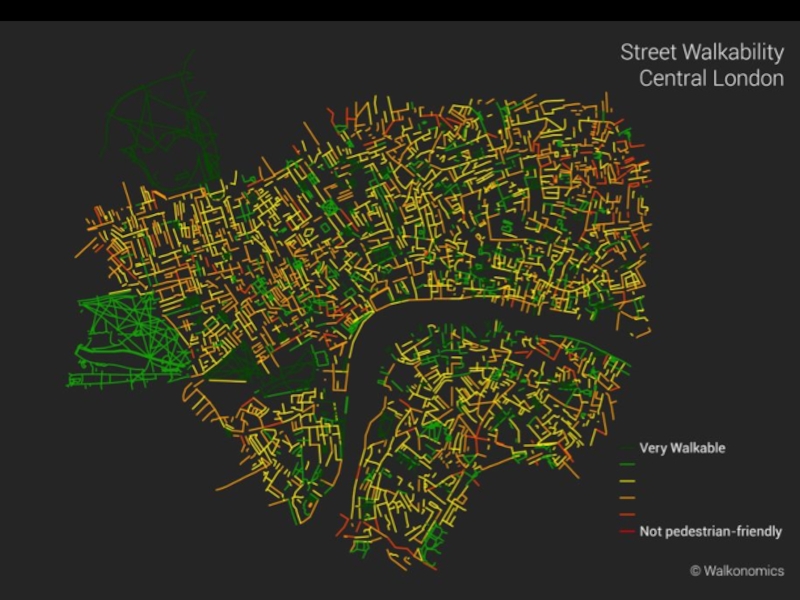
- 20. Walkability
- 21. Why Walkability? Adds 5-10 % to
- 22. Public space surrendered to cars ...
- 23. The commuting Paradox
- 24. “The General Theory of Walkability explains how,
- 26. Walkonomics is a composite score of
- 29. Hypothesis A street’s vitality is captured in
- 30. Method 1. Theoretically derive hypotheses concerning
- 31. Reliability Measurement error borrow measurement
- 32. Time of Day
- 33. Jane Jacobs
- 34. The Rockefeller Foundation gave grants for urban
- 35. The Death and Life of Great American
- 36. Death caused by elimination of pedestrian activity
- 37. nothing is safer than a city street
- 38. 253 patterns of good urban design (1977)
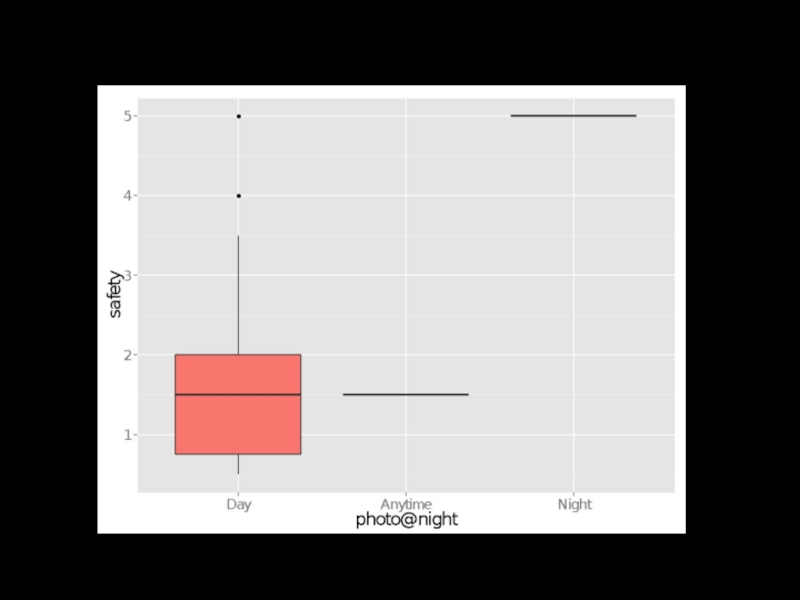
- 39. “At night, street crimes are most
- 40. Question 1 Can safe streets be identified by night activity?
- 41. ni (oi) is the fraction
- 42. r(safe,night)= 0.60 safe street tend to be visited at night as well
- 44. streets with 30+ photos = stable correlations of r > 0.6
- 45. What about making “it worth a thief’s
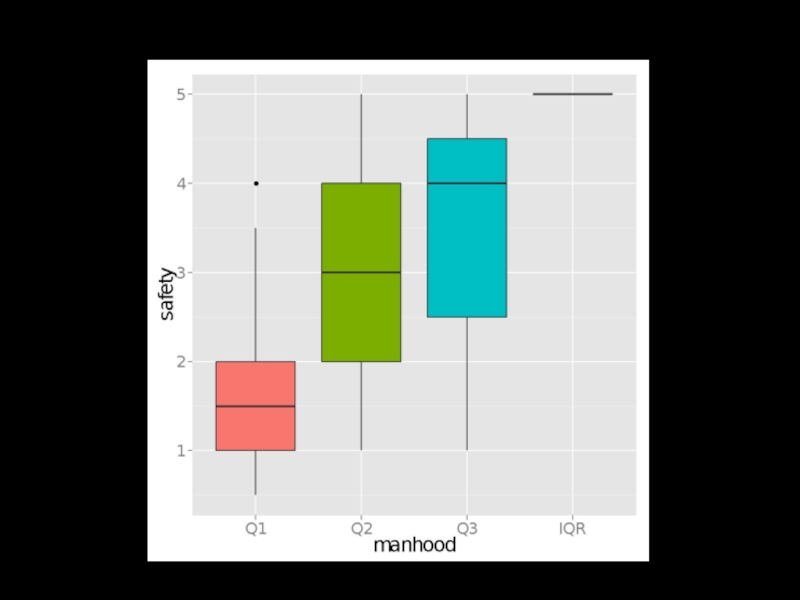
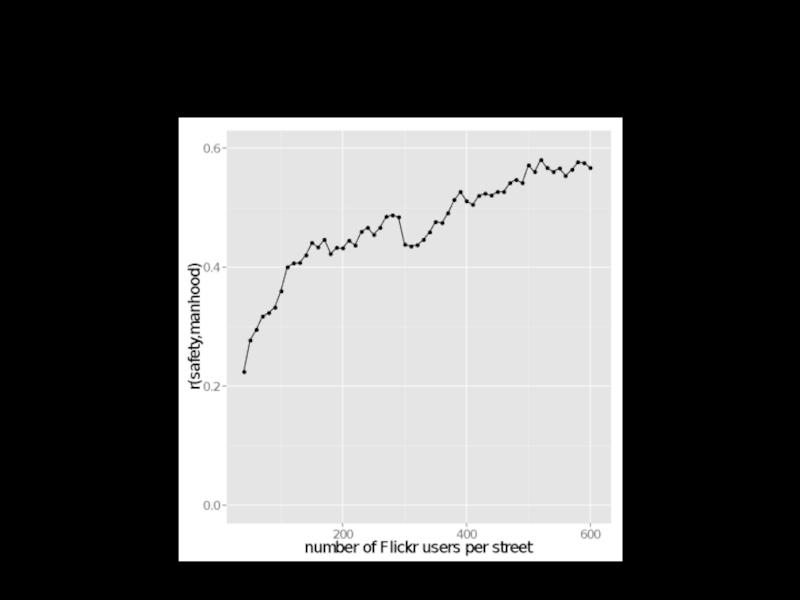
- 46. Question 2 Can safe streets be identified by gender or age?
- 47. Gender
- 48. mi (fi) = fraction
- 49. r(manhood,safety)=0.58 Safe streets tend to be visited by a predominantly male population
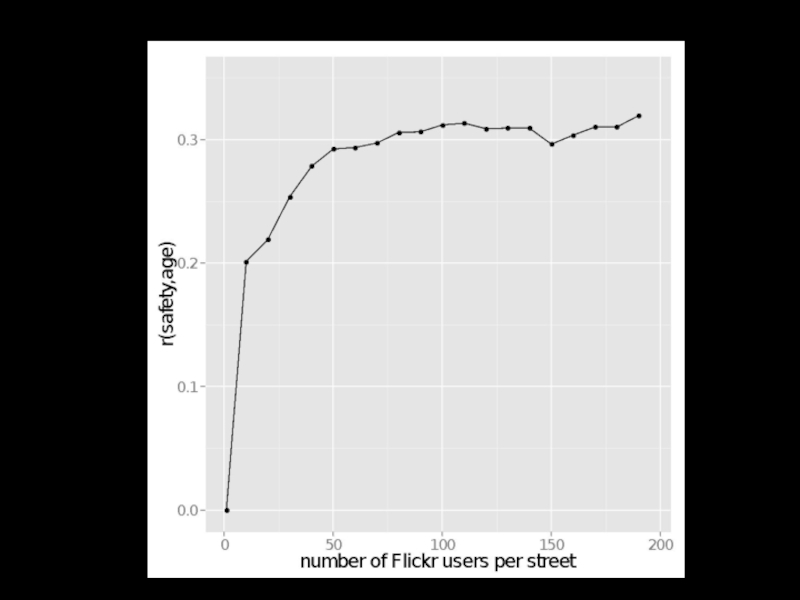
- 52. Age
- 53. r(age,safety)=0.32 unsafe streets tend to be visited by a younger population
- 55. Crime prevention through environmental design
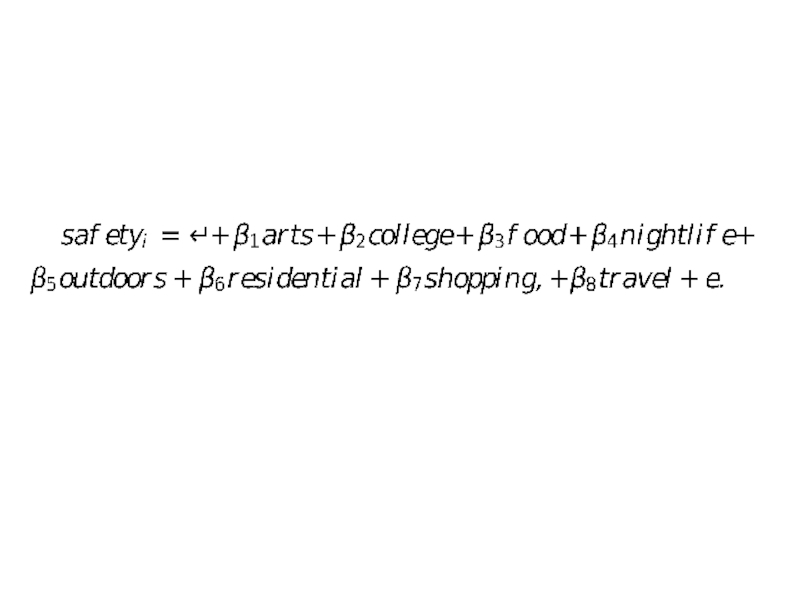
- 56. Questions 3 & 4 Can safe (walkable)
- 58. R2= 74% (safety from crime) safe
- 59. R2= 33% (walkability) the presence of
- 60. Text we gather the literature on walkability
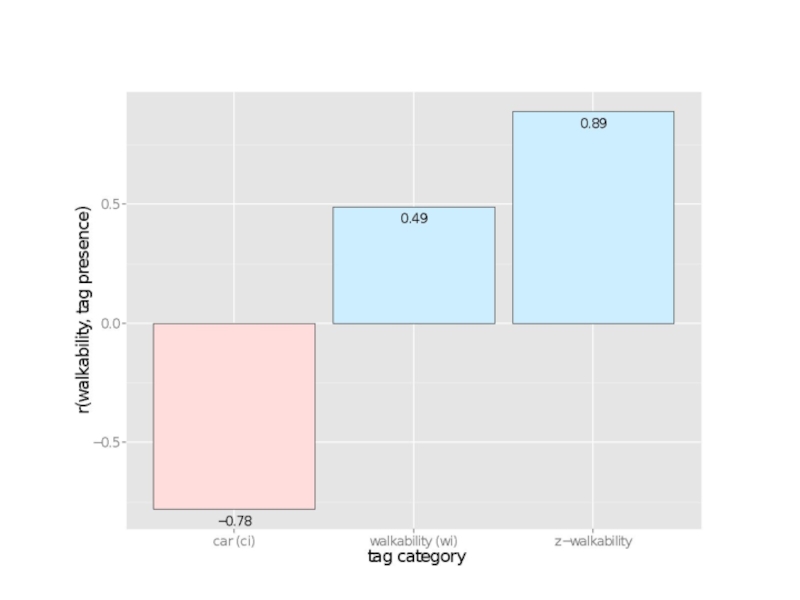
- 61. Question 5 Can walkable streets be identified by walkability-related tags?
- 64. To sum up... Picture uploads from
- 65. Theoretical Implication Social media = Opportunities
- 66. Practical Implications Room booking Urban route recommendations Real-estate
- 67. Limitation It doesn’t work where there is little activity (yet absence/presence of venues work)
- 68. Happy Maps The Digital Life of Walkable Streets
- 69. Smelly Maps The Digital Life of Urban Smellscapes
- 70. Humans Can Discriminate More than 1 Trillion Olfactory Stimuli Science, March 2014
- 71. Yet, city planning can discriminate only a few bad odors
- 72. nasal ranger
- 73. smell walks Amsterdam, Pamplona, Glasgow, Edinburgh, Newport, Paris, New York.
- 74. Good classification The first urban smell dictionary researchswinger.org/smellymaps
- 75. Happy Maps The Digital Life of Walkable Streets
- 76. Smelly Maps The Digital Life of Urban Smellscapes
- 77. Chatty Maps The Digital Life of Urban Soundscapes
- 81. The Digital Life of Walkable Streets


Слайд 4Neil Gershenfeld
Director of MIT’s Center for Bits and Atoms
“Computer science
is one of the worst things to happen to computers or to science because, unlike physics, it has arbitrarily segregated the notion that computing happens in an alien world.”


Слайд 21Why Walkability?
Adds 5-10 % to house prices
@ the heart
of the cure to the health-care crisis in US
Carbon saving (light-bulbs 1 year= living in a walkable for 1 week) neighborhood in 1 week)
Carbon saving (light-bulbs 1 year= living in a walkable for 1 week) neighborhood in 1 week)


Слайд 24“The General Theory of Walkability explains how, to be favored, a
walk has to satisfy four main conditions: it must be useful, safe, comfortable, and interesting. Each of these qualities is essential and none alone is sufficient.”


Слайд 26Walkonomics is a composite score of
1. Road safety (#accidents)
2. Easy
to cross (street type + traffic)
3. Sidewalks (width)
4. Hilliness
5. Navigation (signs on street)
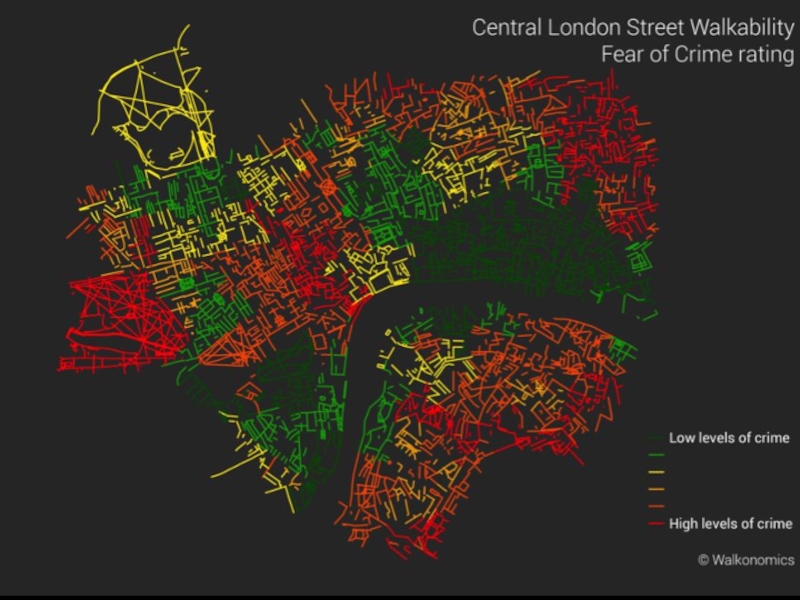
6. Safety from crime
7. Smart and Beautiful (e.g., #trees, close parks)
8. Fun and relaxing (shops, bars, restaurants)
3. Sidewalks (width)
4. Hilliness
5. Navigation (signs on street)
6. Safety from crime
7. Smart and Beautiful (e.g., #trees, close parks)
8. Fun and relaxing (shops, bars, restaurants)
2. Easy to cross (street type")
Слайд 29Hypothesis
A street’s vitality is captured in the digital layer
(there might be
digital footprints that distinguish walkable streets from unwalkable ones)

Слайд 30Method
1. Theoretically derive hypotheses concerning walkability
2. Test them
3. If supported, then
“valid” scores

Слайд 31Reliability
Measurement error
borrow measurement procedures from the literature
(e.g., a buffer
of 22.5 meters around each street’s polyline)
Specification error (Flickr/Foursquare biases) normalization measures (e.g., z-transformations) from previous studies
Sampling error
minimum amount of data such that the same results on repeated trials
Specification error (Flickr/Foursquare biases) normalization measures (e.g., z-transformations) from previous studies
Sampling error
minimum amount of data such that the same results on repeated trials


Слайд 34The Rockefeller Foundation gave grants for urban topics:
To Kevin Lynch
(MIT) for studies of urban aesthetics
(Image of the City in 1960)
To Jane Jacobs for studies of urban life
(The Death and Life of Great American Cities in 1961)
(Image of the City in 1960)
To Jane Jacobs for studies of urban life
(The Death and Life of Great American Cities in 1961)
 for studies of")
Слайд 35The Death and Life of Great American Cities
the most influential
book in city planning
(“social capital", "mixed primary uses", "eyes on the street”)
critique of the 1950s urban renewal policies
(attacking Moses for “replacing well-functioning neighborhoods
with Le Corbusier-inspired towers”)
(“social capital", "mixed primary uses", "eyes on the street”)
critique of the 1950s urban renewal policies
(attacking Moses for “replacing well-functioning neighborhoods
with Le Corbusier-inspired towers”)

Слайд 36Death caused by elimination of pedestrian activity
(highway construction, large-scale development projects)
Life meant pedestrians at all times of the day
(“sidewalk ballet”)
Life meant pedestrians at all times of the day
(“sidewalk ballet”)
Life meant")

")
Слайд 39
“At night, street crimes are most prevalent in places where there
are too few pedestrians to provide natural surveillance, but enough pedestrians to make it worth a thief’s while”


 is the fraction of pictures taken at night (not at night) on")
= 0.60 safe street tend to be visited at night as well")

Слайд 45What about making “it worth a thief’s while”?
unsafe
ones are used by men only
OR unsafe streets used by women
OR unsafe streets used by women


 = fraction of male (female) users who have taken a picture on")
=0.58Safe streets tend to be visited by a predominantly male population")

=0.32unsafe streets tend to be visited by a younger population")
Слайд 55Crime prevention through environmental design
The physical environment can be
designed or
manipulated to reduce fear of crime (by
supporting certain activities over others)
manipulated to reduce fear of crime (by
supporting certain activities over others)

Слайд 56Questions 3 & 4
Can safe (walkable) streets be identified by the
presence of specific types of places?
 streets be identified by the presence of specific types")
Слайд 58R2= 74% (safety from crime)
safe streets: outdoor places (mainly parks)
unsafe ones: residential bits of central London that have no parks
 safe streets: outdoor places (mainly parks) unsafe ones: residential bits")
Слайд 59R2= 33% (walkability)
the presence of residential areas drives most of
the predictive power of the regression
 the presence of residential areas drives most of the predictive power of")
Слайд 60Text
we gather the literature on walkability to produce a list of
walkability-related keywords
Line-by-line coding
Collecting documents
Annotating them
Validating them
Line-by-line coding
Collecting documents
Annotating them
Validating them


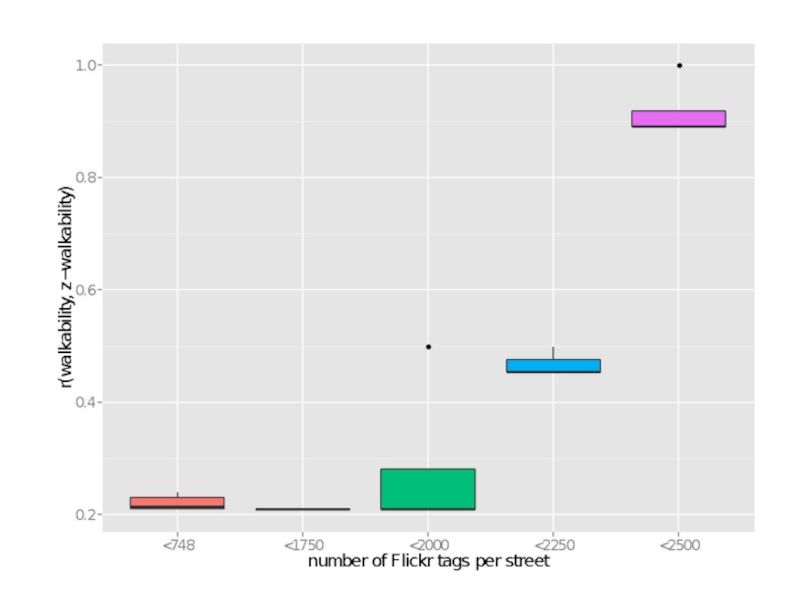
Слайд 64To sum up...
Picture uploads from dwellers of walkable streets differ from
those of unwalkable ones, mainly in terms of upload time and tagging *
* limited data vs. high penetration

Слайд 65Theoretical Implication
Social media = Opportunities for Theory
Comforted by our validation
work, urban researchers might well be enticed to use social media to answer theoretical questions that could not have been tackled before because of lack of data


Слайд 67Limitation
It doesn’t work where there is little activity
(yet absence/presence of venues
work)
")


Слайд 81
The Digital Life of Walkable Streets
The Digital Life of
Walkable Streets
@danielequercia @rschifan @lajello @walkonomics
@danielequercia @rschifan @lajello @walkonomics