- Главная
- Разное
- Дизайн
- Бизнес и предпринимательство
- Аналитика
- Образование
- Развлечения
- Красота и здоровье
- Финансы
- Государство
- Путешествия
- Спорт
- Недвижимость
- Армия
- Графика
- Культурология
- Еда и кулинария
- Лингвистика
- Английский язык
- Астрономия
- Алгебра
- Биология
- География
- Детские презентации
- Информатика
- История
- Литература
- Маркетинг
- Математика
- Медицина
- Менеджмент
- Музыка
- МХК
- Немецкий язык
- ОБЖ
- Обществознание
- Окружающий мир
- Педагогика
- Русский язык
- Технология
- Физика
- Философия
- Химия
- Шаблоны, картинки для презентаций
- Экология
- Экономика
- Юриспруденция
Testing and evaluation of multivariable demand function презентация
Содержание
- 1. Testing and evaluation of multivariable demand function
- 2. Step 1. Testing the suitability of the model Signs of the coefficients Parameter values
- 3. The positive sign: The negative sign:
- 4. Parameter values This is parameter validation on
- 5. Corrected plural coefficient of determination, R^2
- 6. Plural coefficient of determination, R^2 Step
- 7. SSR Explainable variation SSЕ Unexplained
- 8. Step 2. Statistical tests and evaluation
- 9. Acceptable values of
- 10. Step 2. Statistical tests and evaluation
- 11. 0,009
Слайд 1Construction of multivariable demand function
Testing and evaluation of multivariable demand function
Слайд 3The positive sign:
The negative sign:
The demand variable and the independent variable
Demand Variable changes in the same direction as the independent variable
The sign of the parameter indicates the direction of change of the demand variable with respect to changes in the independent variable
0,009
Variable №
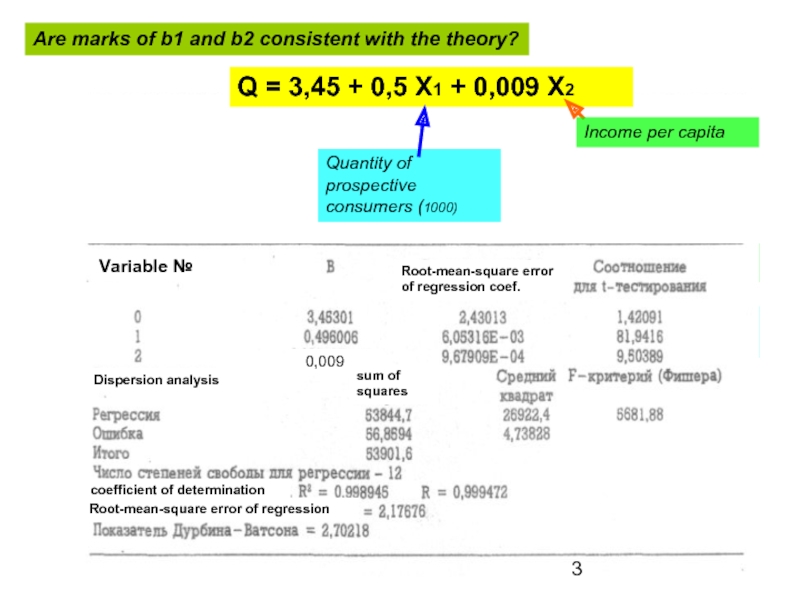
Are marks of b1 and b2 consistent with the theory?
Q = 3,45 + 0,5 X1 + 0,009 X2
Quantity of prospective consumers (1000)
Income per capita
Root-mean-square error of regression coef.
Dispersion analysis
sum of squares
coefficient of determination
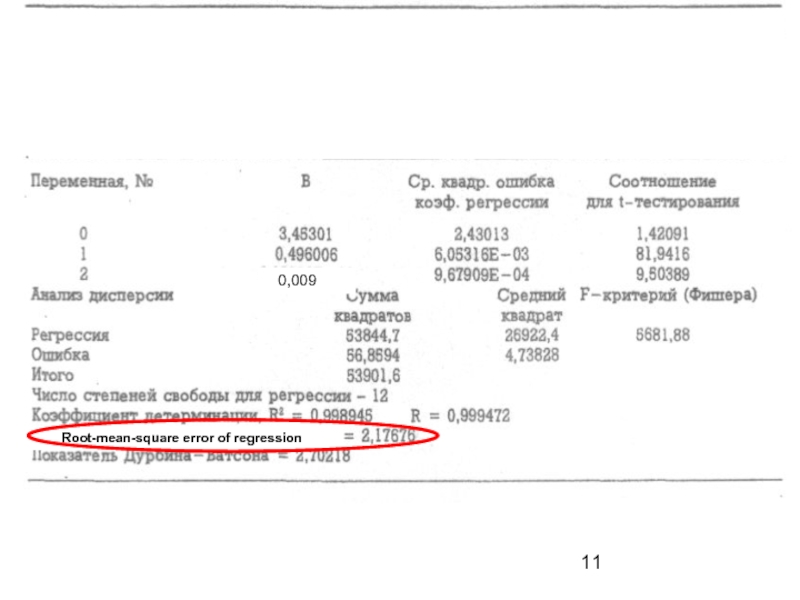
Root-mean-square error of regression
Слайд 4Parameter values
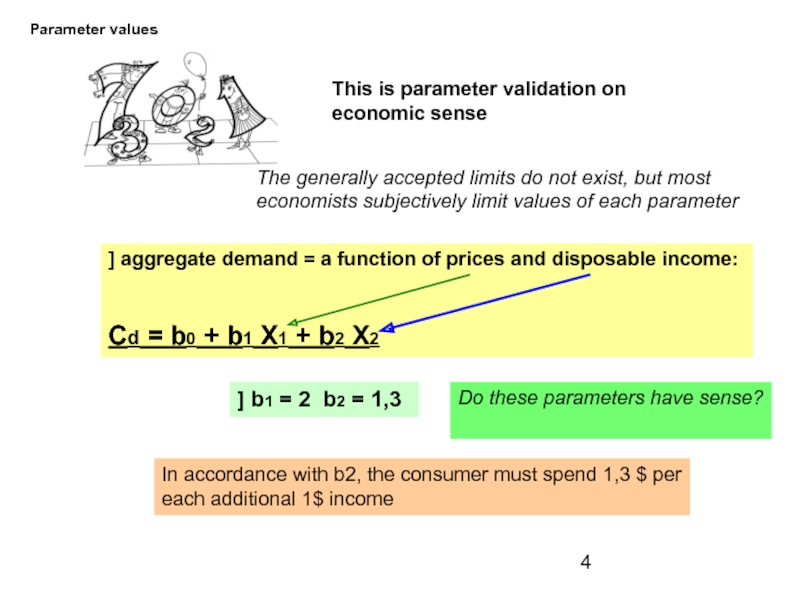
This is parameter validation on economic sense
The generally accepted limits
] aggregate demand = a function of prices and disposable income:
Cd = b0 + b1 X1 + b2 X2
] b1 = 2 b2 = 1,3
In accordance with b2, the consumer must spend 1,3 $ per each additional 1$ income
Do these parameters have sense?
Слайд 5 Corrected plural coefficient of determination, R^2
Root-mean-square error of estimation for
Step 2. Statistical tests and evaluation
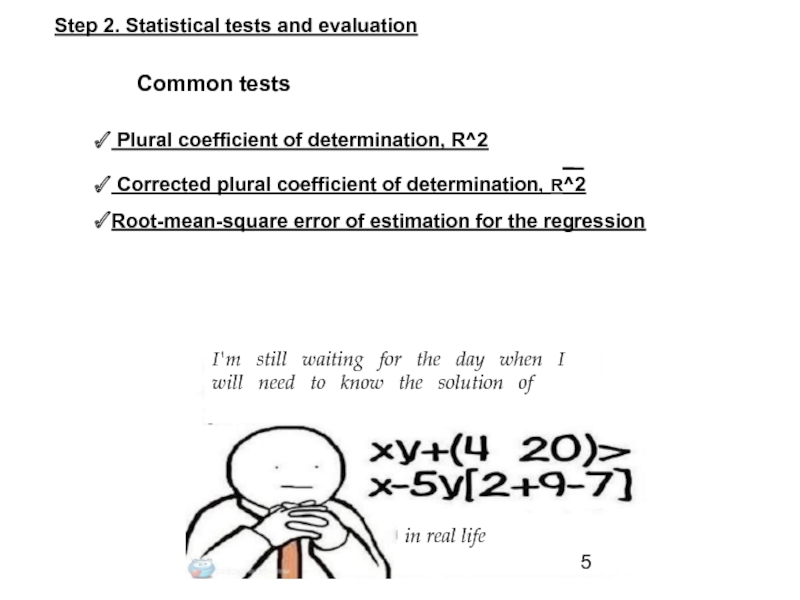
Common tests
Plural coefficient of determination, R^2
I'm still waiting for the day when I will need to know the solution of
in real life
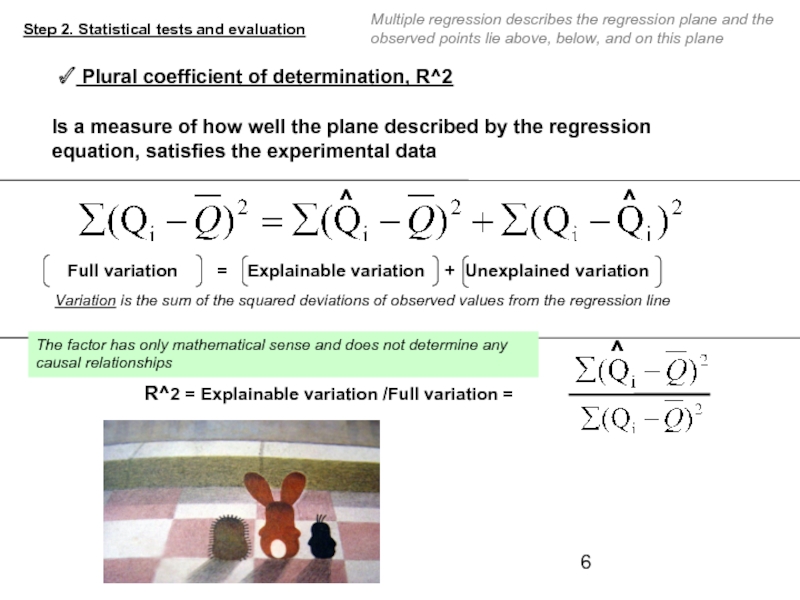
Слайд 6 Plural coefficient of determination, R^2
Step 2. Statistical tests and evaluation
Is
Full variation = Explainable variation + Unexplained variation
Variation is the sum of the squared deviations of observed values from the regression line
^
^
R^2 = Explainable variation /Full variation =
^
Multiple regression describes the regression plane and the observed points lie above, below, and on this plane
The factor has only mathematical sense and does not determine any causal relationships
Слайд 7
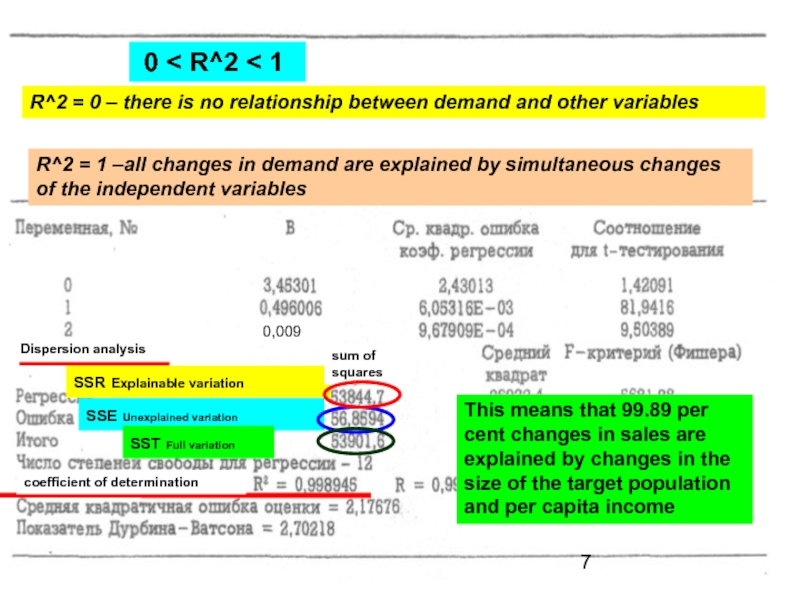
SSR Explainable variation
SSЕ Unexplained variation
SSТ Full variation
This means that
R^2 = 0 – there is no relationship between demand and other variables
R^2 = 1 –all changes in demand are explained by simultaneous changes of the independent variables
0 < R^2 < 1
0,009
Dispersion analysis
sum of squares
coefficient of determination
Слайд 8Step 2. Statistical tests and evaluation
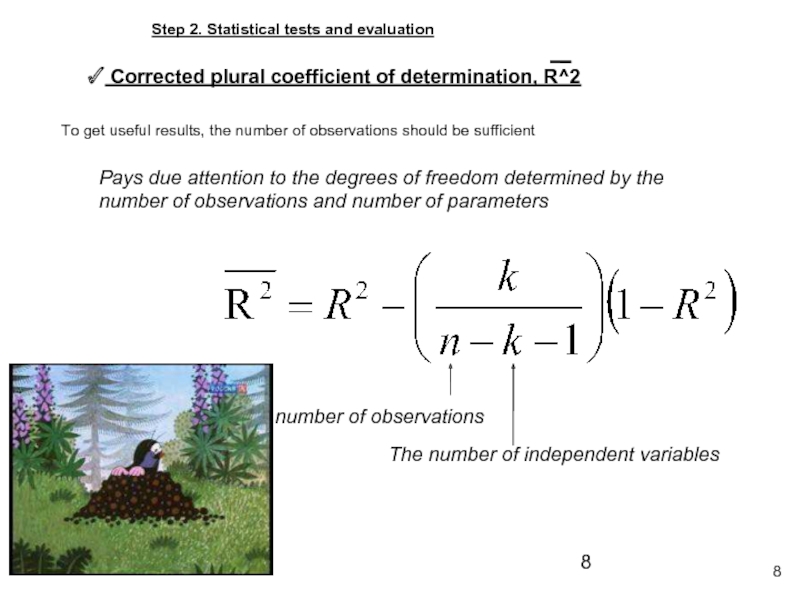
Corrected plural coefficient of determination,
Pays due attention to the degrees of freedom determined by the number of observations and number of parameters
number of observations
The number of independent variables
8
To get useful results, the number of observations should be sufficient
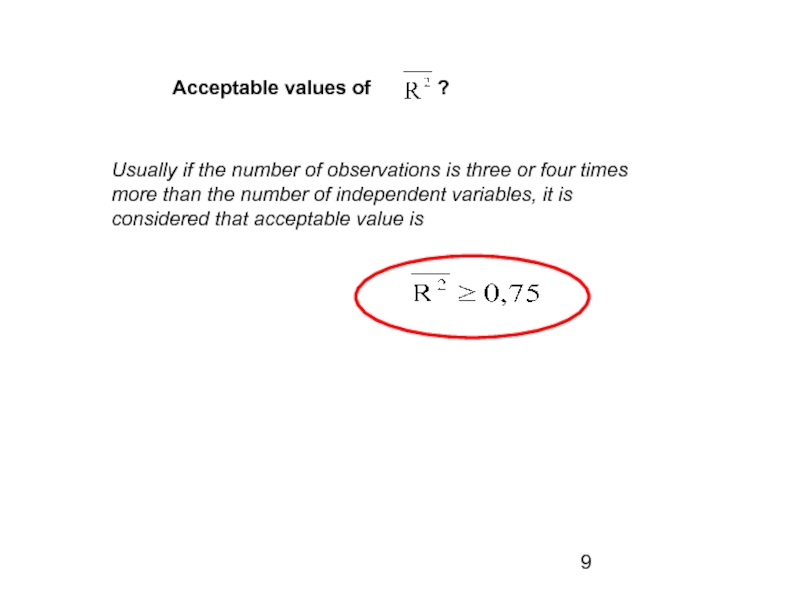
Слайд 9 Acceptable values of ?
Usually
Слайд 10Step 2. Statistical tests and evaluation
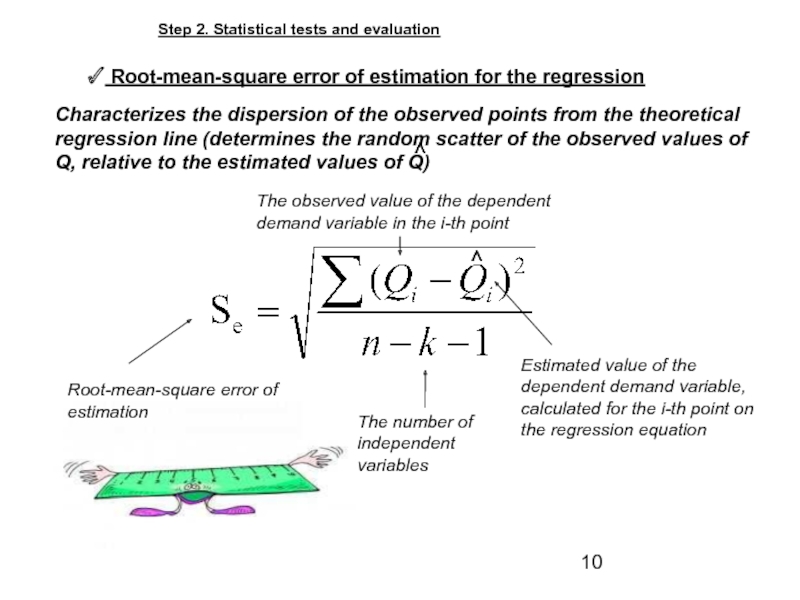
Root-mean-square error of estimation for
Characterizes the dispersion of the observed points from the theoretical regression line (determines the random scatter of the observed values of Q, relative to the estimated values of Q)
^
Root-mean-square error of estimation
The observed value of the dependent demand variable in the i-th point
Estimated value of the dependent demand variable, calculated for the i-th point on the regression equation
The number of independent variables
^
