- Главная
- Разное
- Дизайн
- Бизнес и предпринимательство
- Аналитика
- Образование
- Развлечения
- Красота и здоровье
- Финансы
- Государство
- Путешествия
- Спорт
- Недвижимость
- Армия
- Графика
- Культурология
- Еда и кулинария
- Лингвистика
- Английский язык
- Астрономия
- Алгебра
- Биология
- География
- Детские презентации
- Информатика
- История
- Литература
- Маркетинг
- Математика
- Медицина
- Менеджмент
- Музыка
- МХК
- Немецкий язык
- ОБЖ
- Обществознание
- Окружающий мир
- Педагогика
- Русский язык
- Технология
- Физика
- Философия
- Химия
- Шаблоны, картинки для презентаций
- Экология
- Экономика
- Юриспруденция
Multiple regression analysis demand evaluation презентация
Содержание
- 1. Multiple regression analysis demand evaluation
- 2. Simple linear regression is used to
- 3. We would like to investigate the relationship
- 4. multiple regression analysis
- 5. When using simple pair regression we consider
- 6. Any change in any other variable, except
- 7. Construction of multivariable demand function Task: Reflection of the relationship between dependent and independent variables
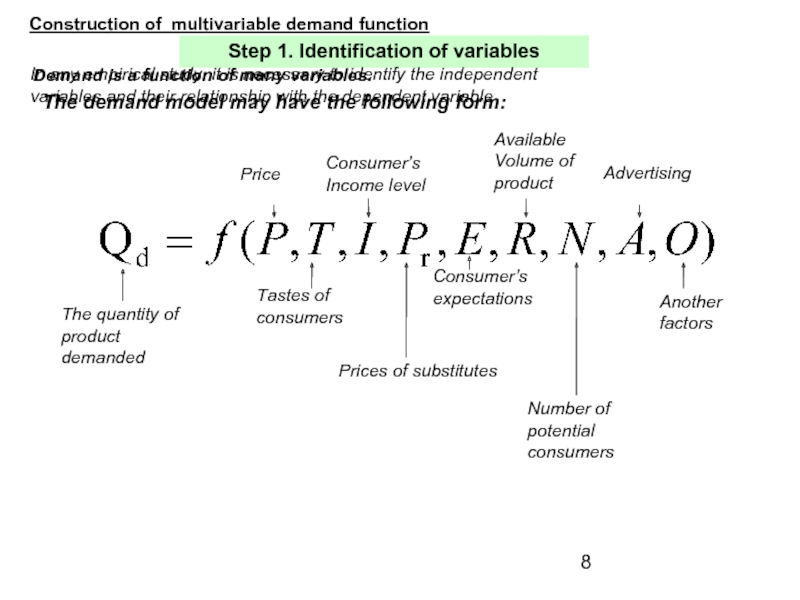
- 8. Construction of multivariable demand function Step 1.
- 9. We must also determine whether the independent
- 10. Construction of multivariable demand function Step 2.
- 11. Organization of information (month, quarter, year); A
- 12. The number of observations required to obtain
- 13. If the trend of the experimental values
- 14. Construction of multivariable demand function Step
- 15. Construction of multivariable demand function Step 4.
- 16. 0,009 Q = 3,5
- 17. Construction of multivariable demand function Testing
Слайд 2
Simple linear regression is used to analyze the relationship between one
In some cases, changes in demand are satisfactorily explained by changes of one independent variable, such as price
Слайд 3We would like to investigate the relationship between demand and more
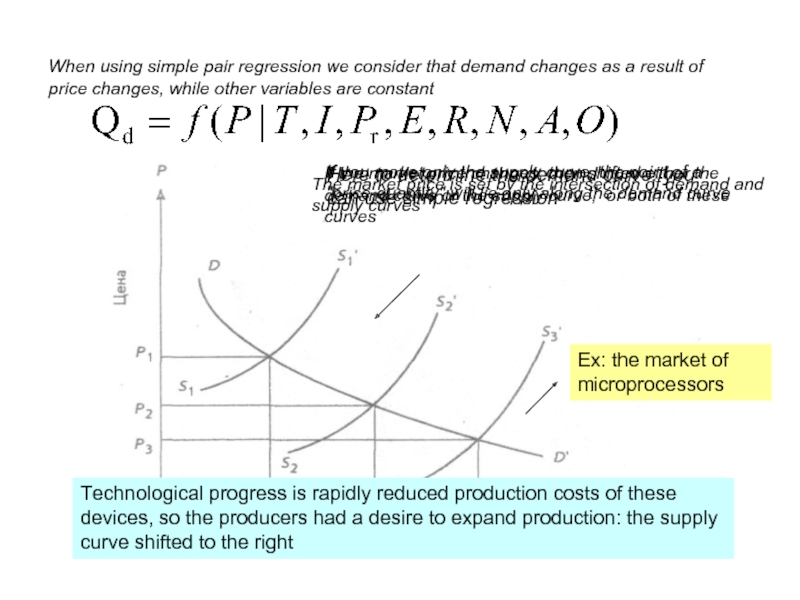
Слайд 5When using simple pair regression we consider that demand changes as
The market price is set by the intersection of demand and supply curves
If the market price changes, then shifted either the demand curve or the supply curve, or both of these curves
If you move only the supply curve, the point of a "price-quantity" will lie only along the demand curve
Here to determine the demand curve, you can use simple regression
Ех: the market of microprocessors
Technological progress is rapidly reduced production costs of these devices, so the producers had a desire to expand production: the supply curve shifted to the right
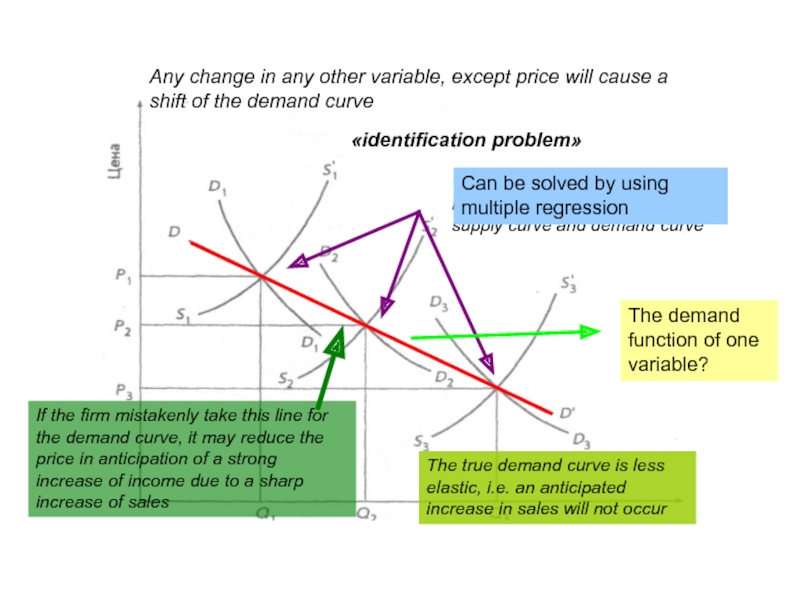
Слайд 6Any change in any other variable, except price will cause a
«identification problem»
Three balance points got as a result of displacement of the supply curve and demand curve
The demand function of one variable?
Can be solved by using multiple regression
If the firm mistakenly take this line for the demand curve, it may reduce the price in anticipation of a strong increase of income due to a sharp increase of sales
The true demand curve is less elastic, i.e. an anticipated increase in sales will not occur
Слайд 7Construction of multivariable demand function
Task: Reflection of the relationship between dependent
Слайд 8Construction of multivariable demand function
Step 1. Identification of variables
The quantity of
Demand is a function of many variables.
Price
Tastes of consumers
Consumer’s Income level
Prices of substitutes
Consumer’s expectations
Available Volume of product
Number of potential consumers
Advertising
Another factors
The demand model may have the following form:
In any empirical study it is necessary to identify the independent variables and their relationship with the dependent variable
Слайд 9We must also determine whether the independent variables are connected to
It is not enough to determine the relationship of the demand variables with the necessary quantity of goods
Construction of multivariable demand function
Step 1. Identification of variables
Слайд 10Construction of multivariable demand function
Step 2. Collection and refinement of data
Consider
Organization of information (month, quarter, year);
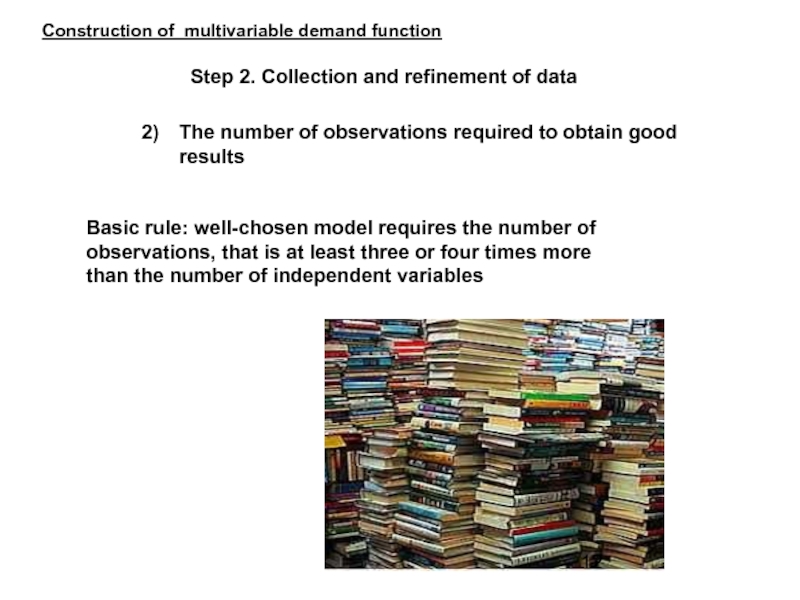
The number of observations required to obtain good results
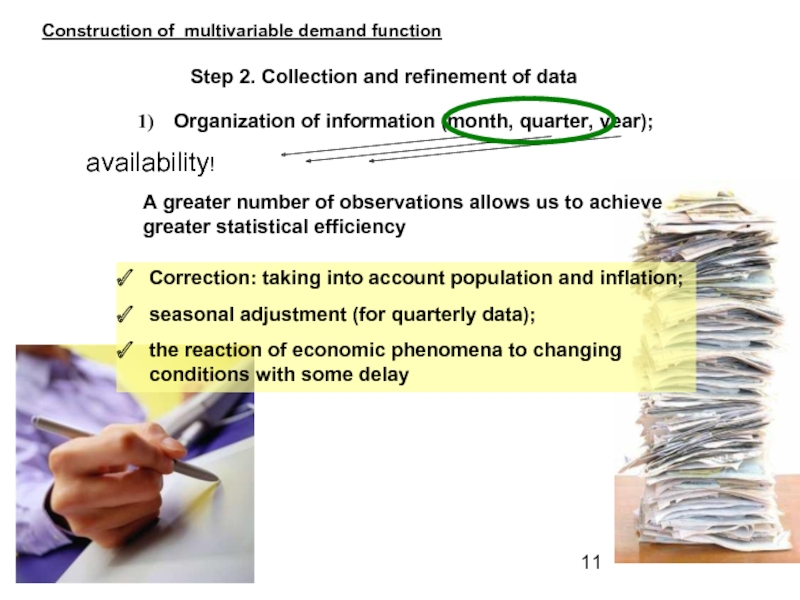
Слайд 11Organization of information (month, quarter, year);
A greater number of observations allows
Correction: taking into account population and inflation;
seasonal adjustment (for quarterly data);
the reaction of economic phenomena to changing conditions with some delay
availability!
Construction of multivariable demand function
Step 2. Collection and refinement of data
Слайд 12The number of observations required to obtain good results
Basic rule: well-chosen
Construction of multivariable demand function
Step 2. Collection and refinement of data
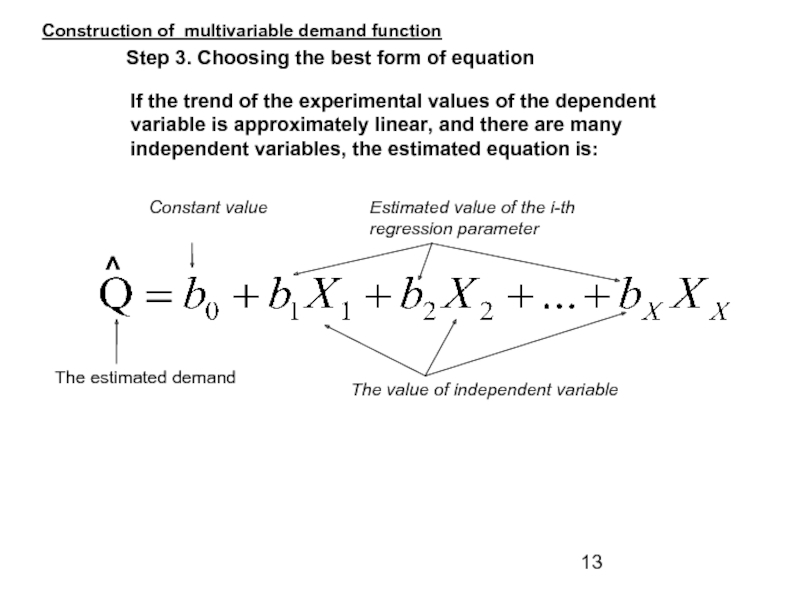
Слайд 13If the trend of the experimental values of the dependent variable
The estimated demand
The value of independent variable
Constant value
Estimated value of the i-th regression parameter
˄
Construction of multivariable demand function
Step 3. Choosing the best form of equation
Слайд 14
Construction of multivariable demand function
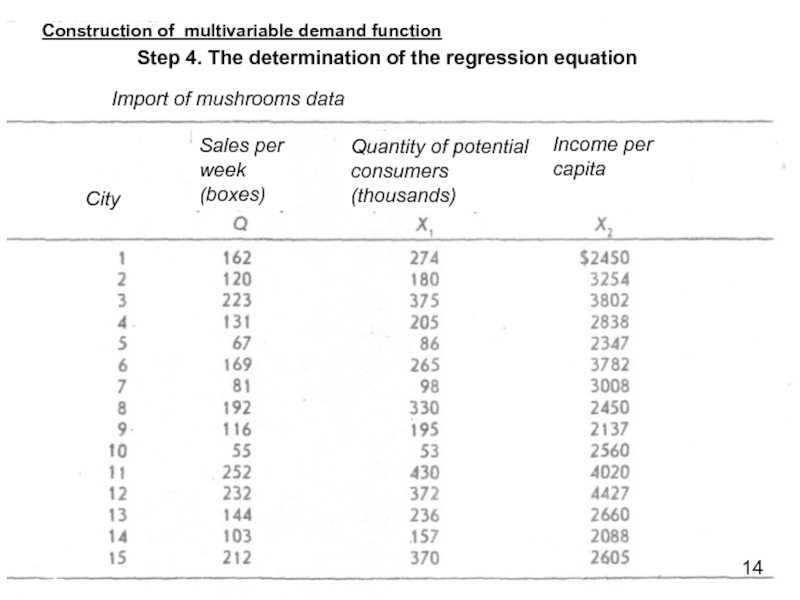
Step 4. The determination of the regression
14
Import of mushrooms data
City
Sales per week
(boxes)
Quantity of potential consumers
(thousands)
Income per capita
Слайд 15Construction of multivariable demand function
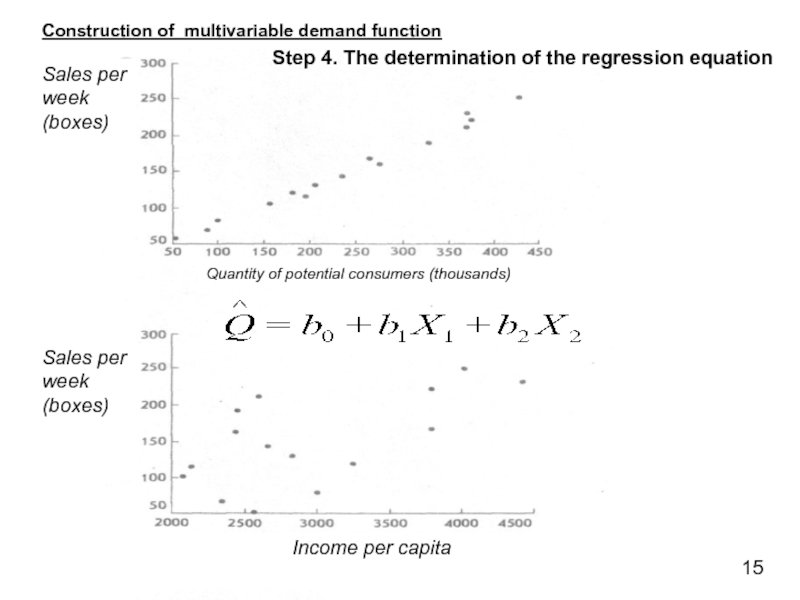
Step 4. The determination of the regression
15
Quantity of potential consumers (thousands)
Sales per week
(boxes)
Sales per week
(boxes)
Income per capita
Слайд 16
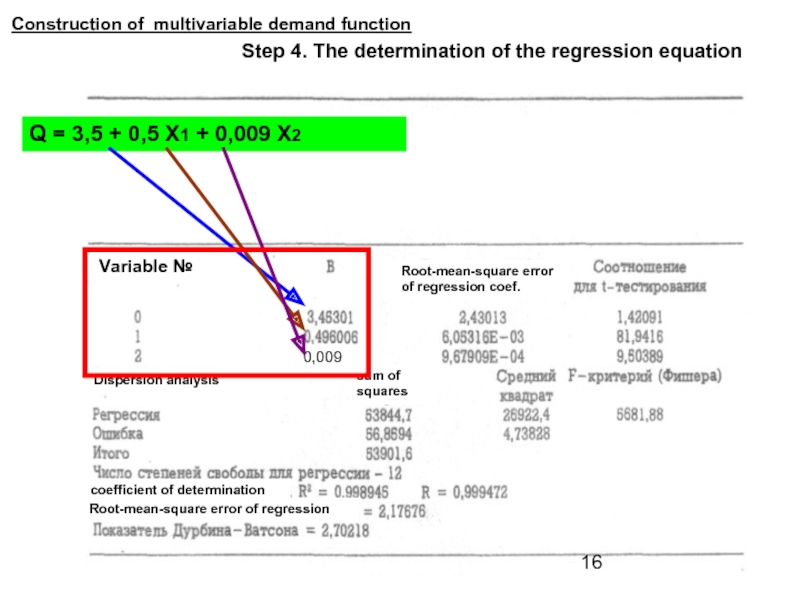
0,009
Q = 3,5 + 0,5 X1 + 0,009 X2
Construction
Step 4. The determination of the regression equation
Variable №
Dispersion analysis
Root-mean-square error of regression coef.
sum of squares
coefficient of determination
Root-mean-square error of regression
Слайд 17
Construction of multivariable demand function
Testing and evaluation of results
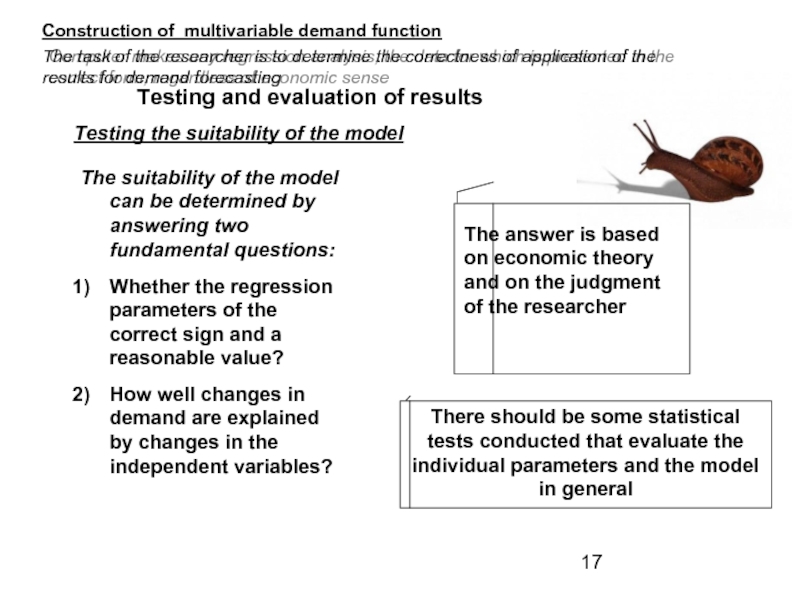
The suitability of
Whether the regression parameters of the correct sign and a reasonable value?
How well changes in demand are explained by changes in the independent variables?
The answer is based on economic theory and on the judgment of the researcher
There should be some statistical tests conducted that evaluate the individual parameters and the model in general
Testing the suitability of the model
Computer makes any regression analysis, the data for which is presented in the correct form, regardless of economic sense
The task of the researcher is to determine the correctness of application of the results for demand forecasting

