- Главная
- Разное
- Дизайн
- Бизнес и предпринимательство
- Аналитика
- Образование
- Развлечения
- Красота и здоровье
- Финансы
- Государство
- Путешествия
- Спорт
- Недвижимость
- Армия
- Графика
- Культурология
- Еда и кулинария
- Лингвистика
- Английский язык
- Астрономия
- Алгебра
- Биология
- География
- Детские презентации
- Информатика
- История
- Литература
- Маркетинг
- Математика
- Медицина
- Менеджмент
- Музыка
- МХК
- Немецкий язык
- ОБЖ
- Обществознание
- Окружающий мир
- Педагогика
- Русский язык
- Технология
- Физика
- Философия
- Химия
- Шаблоны, картинки для презентаций
- Экология
- Экономика
- Юриспруденция
How to evaluate past the click презентация
Содержание
- 1. How to evaluate past the click
- 2. Mathew Sweezey: Author & Evangelist
- 3. Proving Value Past The Click
- 4. Understanding why we create content is
- 5. 5000 impressions How many ad impressions your
- 6. 10 seconds You have 10 seconds
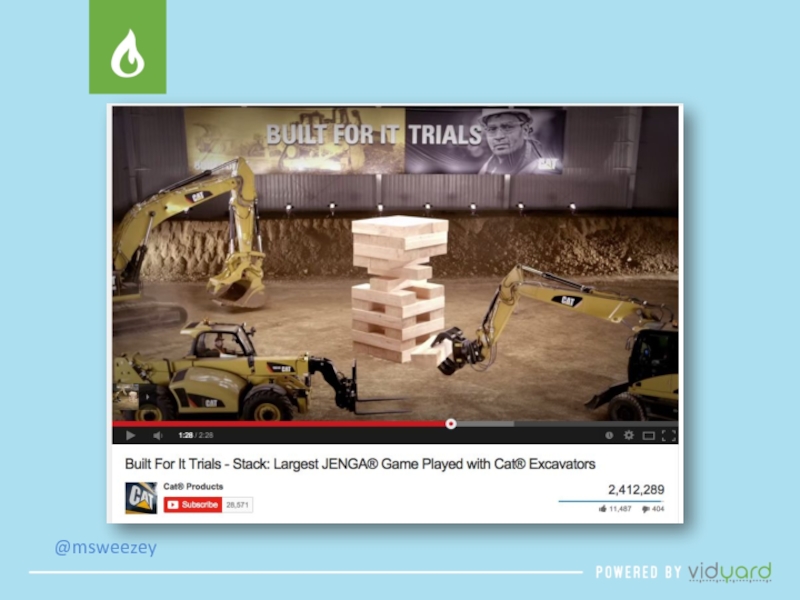
- 7. WHY? Because there is no better way to engage.
- 8. Free: Creating is free Publishing is free Distribution is free
- 9. Accessible: More people have access to
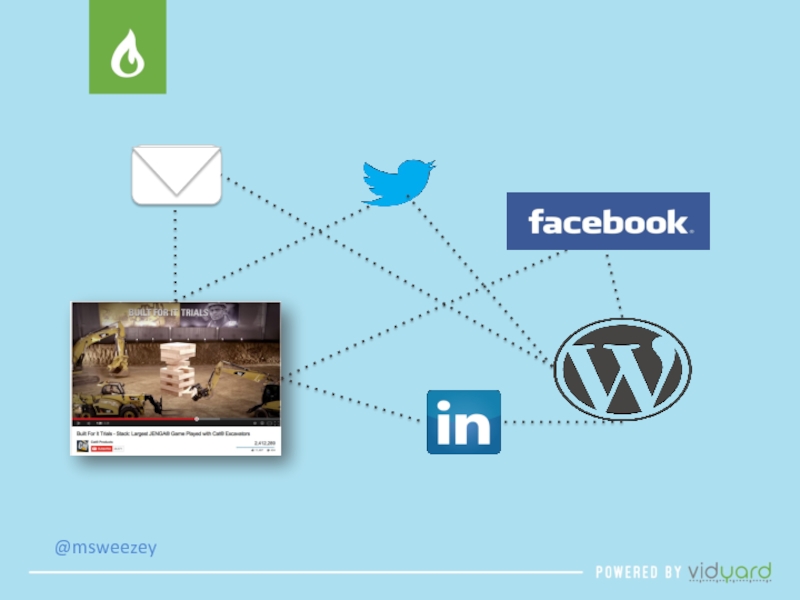
- 10. Ubiquitous: Every time you log on
- 11. How do brands see content?
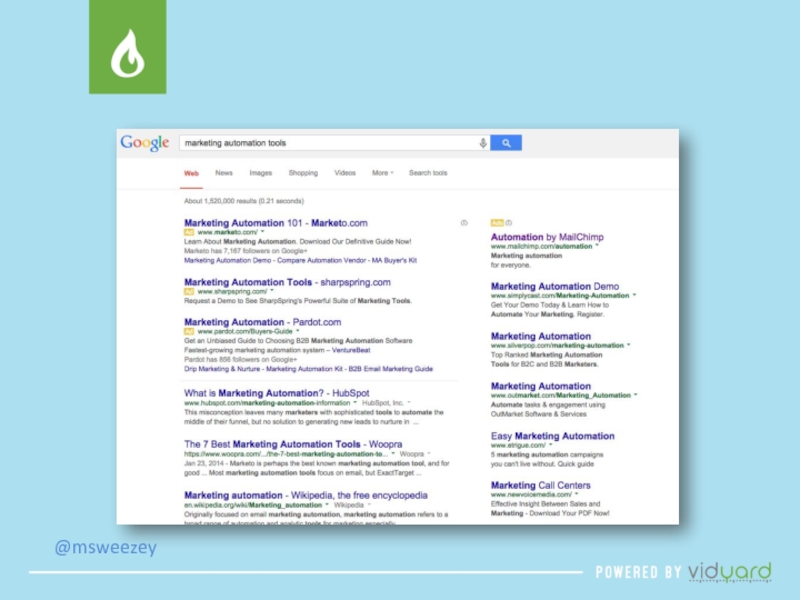
- 12. SEO Backlinks Whitepapers webinars video onepagers ebooks Short form AMA infographics
- 13. How do consumers see content? e
- 15. “Consumers want honest and authentic experiences”
- 16. 71% of B2B buyers have been disappointed
- 17. 25% of those B2B buyers who have
- 18. 1/Escape People wanting to escape will lean
- 20. 2/Learn People wanting to learn are looking
- 22. 3/Research People wanting to research will dedicate
- 24. Daily content consumption. Usually is
- 25. Methods to report on content marketing
- 26. Metrics to create better content:
- 27. Baselines Your content marketing should be measured
- 28. Evergreen Evergreen content should be measured on
- 29. 1/Reach
- 31. Reach Is a metric to
- 32. 2/Engagement
- 33. Engagement Is a metric to
- 34. How many opens did
- 35. 3/Goal
- 36. Goal How many people actually
- 37. Daily content consumption. Usually is
- 38. Reach Low impact report, and will
- 39. Phone Calls The only real way to
- 40. Business Value
- 41. 1/ROI
- 42. Is not a basic of report. There
- 43. 2/Attribution
- 44. In theory sounds great, in practice is
- 45. 3/Velocity A better way to show the return on your investment
- 46. Velocity How
- 47. 4/Efficiency Showing real business value by
- 48. Efficiency How
- 49. Barriers to this approach:
- 50. 1/Your boss
- 51. 2/Your Content
- 52. Daily content consumption. Usually is
- 53. 3/Your Tools
- 54. Conclusions
- 55. Thank you! Now lets get to questions

Слайд 2Mathew Sweezey:
Author & Evangelist
Salesforce.com
-Marketing Automation for Dummies
-Byline for
-B2B marketing Evangelist
-Co-Founder Eventide Brewing

Слайд 3Proving Value Past The Click
-Why do we even do content
-Why Marketing is the first department to get fired
-New Breed of Reporting
-Tactically how to do it

Слайд 4
Understanding why we create content is where we have to begin

Слайд 55000 impressions
How many ad impressions your exposed to on a daily


Слайд 9Accessible:
More people have access to a cell phone than have


Слайд 1725% of those B2B buyers who have been disappointed by your
-Pardot research 2014

Слайд 181/Escape
People wanting to escape will lean on self discover and social

Слайд 202/Learn
People wanting to learn are looking on ways to do their

Слайд 223/Research
People wanting to research will dedicate time to search, learn, and

Слайд 24
Daily content consumption. Usually is Learn, and Escape. Happens across all
How we engage with Research content.


Слайд 27Baselines
Your content marketing should be measured to your previous efforts. You

Слайд 28Evergreen
Evergreen content should be measured on a timeframe. So if you


Слайд 31Reach
Is a metric to help you evaluate your strategy. But it


Слайд 33Engagement
Is a metric to help you evaluate your strategy. But it

Слайд 34
How many opens did it get = Subject line
How many
How many page views did it get = Image and CTA
How many likes, shares, new fans = Image and CTA
How many likes, shares, new fans = Copy and Image
How many clicks did it get = Copy and CTA
How long did someone watch it = Story


Слайд 36Goal
How many people actually did what you wanted them to do.

Слайд 37
Daily content consumption. Usually is Learn, and Escape. Happens across all
How we engage with Research content.
Goal: Reach more people
Goal: Move them to the next stage in the life cycle
Goal: Increase LTV

Слайд 38Reach
Low impact report, and will not tell you the effectiveness of
Engagement
Medium level report to show you if your image and call to action were correct. Engagement is what you want. Fans, Likes, Shares, Comments….
% of Goal
What percent took a next step. This can either be to continue the experience, or this could be a conversion. This tells you was your experience correct or not.
STRATEGY
CREATIVE
CTA

Слайд 39Phone Calls
The only real way to find out if your content
Ask: Is it what you were expecting, was it helpful, how can it be better.


Слайд 42Is not a basic of report. There is no direct cost
ROI


Слайд 44In theory sounds great, in practice is not. Not a business
Attribution


Слайд 46
Velocity
How fast does someone move thought your funnel.
TVM is a
Accounts for holistic efforts
Predicts future outomes

Слайд 474/Efficiency
Showing real business value by creating more quality leads on

Слайд 48
Efficiency
How many leads go in the top of each stage,
1.6% is best in class
Identifies holes in content strategy


Слайд 501/Your boss
Work to gain buy in on new reporting methods
Show possible
Show it’s ability to predict future outcomes
Show

Слайд 512/Your Content
Make sure your content is tied to the stages in
Set up phone interviews with your customers to better understand creating future content.
Know the keywords they search for in each stage.

Слайд 52
Daily content consumption. Usually is Learn, and Escape. Happens across all
How we engage with Research content.
Goal: Reach more people
Goal: Move them to the next stage in the life cycle
Goal: Increase LTV

Слайд 533/Your Tools
You need to have all of your content tracked, and
Marketing automation will be the backbone
CRM is a must for aligning sales data back to your efforts

Слайд 54Conclusions
Content marketing isn’t just about creating content. It is a highly