- Главная
- Разное
- Дизайн
- Бизнес и предпринимательство
- Аналитика
- Образование
- Развлечения
- Красота и здоровье
- Финансы
- Государство
- Путешествия
- Спорт
- Недвижимость
- Армия
- Графика
- Культурология
- Еда и кулинария
- Лингвистика
- Английский язык
- Астрономия
- Алгебра
- Биология
- География
- Детские презентации
- Информатика
- История
- Литература
- Маркетинг
- Математика
- Медицина
- Менеджмент
- Музыка
- МХК
- Немецкий язык
- ОБЖ
- Обществознание
- Окружающий мир
- Педагогика
- Русский язык
- Технология
- Физика
- Философия
- Химия
- Шаблоны, картинки для презентаций
- Экология
- Экономика
- Юриспруденция
The Best Presidents for the Economy презентация
Содержание
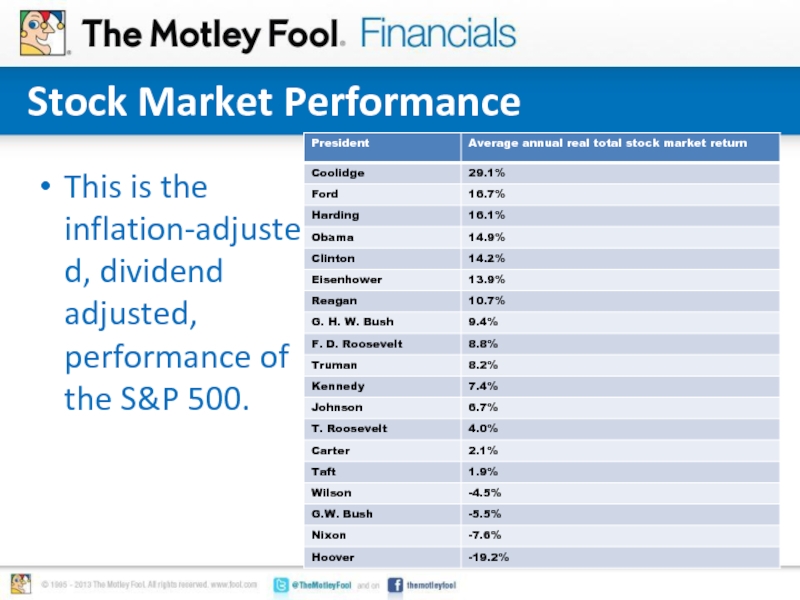
Слайд 2Stock Market Performance
This is the inflation-adjusted, dividend adjusted, performance of
the S&P 500.
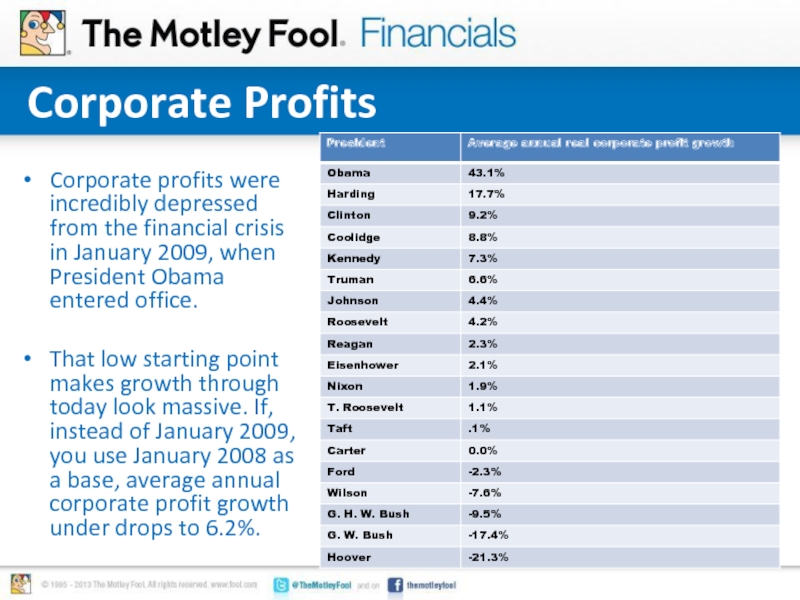
Слайд 3Corporate Profits
Corporate profits were incredibly depressed from the financial crisis
in January 2009, when President Obama entered office.
That low starting point makes growth through today look massive. If, instead of January 2009, you use January 2008 as a base, average annual corporate profit growth under drops to 6.2%.
That low starting point makes growth through today look massive. If, instead of January 2009, you use January 2008 as a base, average annual corporate profit growth under drops to 6.2%.
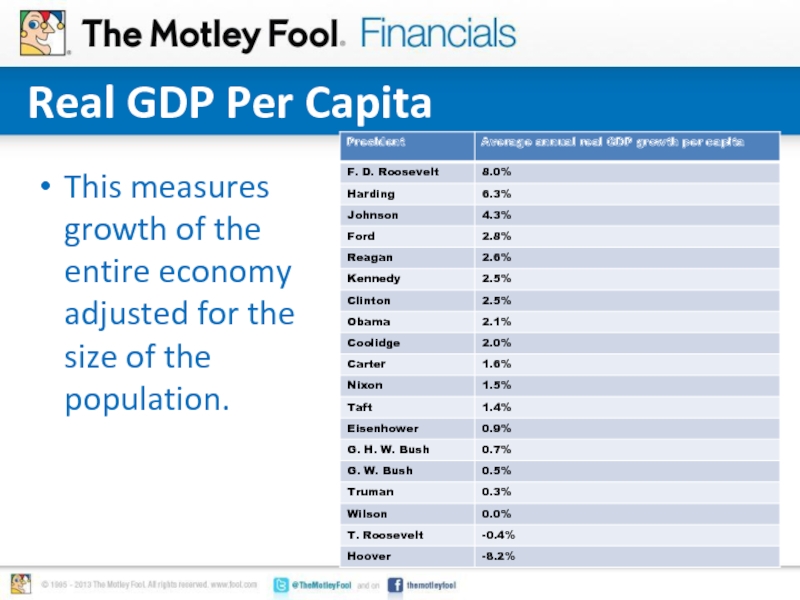
Слайд 4Real GDP Per Capita
This measures growth of the entire economy
adjusted for the size of the population.
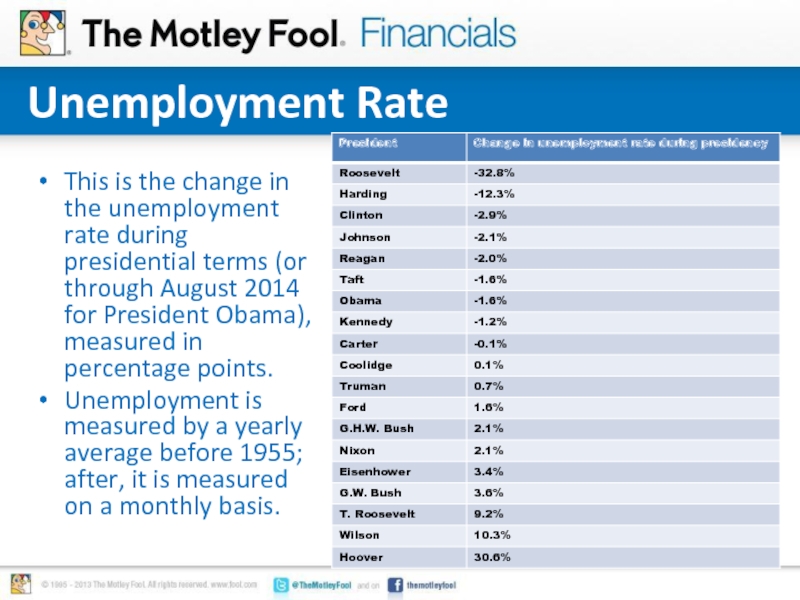
Слайд 6Unemployment Rate
This is the change in the unemployment rate during
presidential terms (or through August 2014 for President Obama), measured in percentage points.
Unemployment is measured by a yearly average before 1955; after, it is measured on a monthly basis.
Unemployment is measured by a yearly average before 1955; after, it is measured on a monthly basis.
