reproduction or display.
- Главная
- Разное
- Дизайн
- Бизнес и предпринимательство
- Аналитика
- Образование
- Развлечения
- Красота и здоровье
- Финансы
- Государство
- Путешествия
- Спорт
- Недвижимость
- Армия
- Графика
- Культурология
- Еда и кулинария
- Лингвистика
- Английский язык
- Астрономия
- Алгебра
- Биология
- География
- Детские презентации
- Информатика
- История
- Литература
- Маркетинг
- Математика
- Медицина
- Менеджмент
- Музыка
- МХК
- Немецкий язык
- ОБЖ
- Обществознание
- Окружающий мир
- Педагогика
- Русский язык
- Технология
- Физика
- Философия
- Химия
- Шаблоны, картинки для презентаций
- Экология
- Экономика
- Юриспруденция
Humans and the Geologic Environment презентация
Содержание
- 1. Humans and the Geologic Environment
- 2. 1- Chapter 1 Humans and the Geologic Environment http://cache4.asset-cache.net/xr/585857104.jpg?v=1&c=IWSAsset&k=3&d=77BFBA49EF878921A343B2C87A49D8F53AF033D8E17C5AF271CCDE525BE091071EE43237F68DE139A55A1E4F32AD3138 http://icestories.exploratorium.edu/dispatches/wp-content/uploads/2008/11/goodge_john.jpg
- 3. 1- Earth 4.6 Billion Years Old
- 4. What Makes Earth Unique Right conditions for
- 5. 1- What Is Geology? The study of
- 6. Two Main Branches of Geology Physical
- 7. 1- How Science Operates The Scientific Method
- 8. 1- The Scientific Method Fig 1.6 pg 9 Fig 1.5 pg 8
- 9. 1- Environmental Geology Solves problems between humans
- 10. 1- Environmental Geology Geologic hazards Natural Earthquakes,
- 11. 1- Environmental Geology Earth’s Resources – water,
- 12. 1- Geologic Time Classifies all rocks by
- 13. Fig 1.10 pg 14 Geologic Time
- 14. Fig 1.11 pg 15 Geologic Time Scale
- 15. 1- Geologic Time Absolute age in years
- 16. 1- An Easier Look at Earth’s History
- 17. 1- Environmental Risk and Human Reaction
- 18. 1- Environmental Risk and Human Reaction
- 19. 1- Earth as a System Four major
- 20. 1- Earth as a System
- 21. 1- Earth and Human Population Humans are
- 22. 1- Population Growth Linear Added, straight
- 23. 1- Limits to Growth Limit to how
- 24. 1- Living in the Environment, Principles, Connections,
- 25. 1- Sustainability Being able to maintain a
- 26. Population Growth Pyramids Pop growth affected by
- 27. Demographic Transition Transition has to do with
- 28. Demographic Transition For example, booming levels of
- 29. Age Structure Pyramids Rapid growth =large numbers
- 30. Age Structure Pyramids - Population Planning Tools
- 31. 1- Ecological Footprint Biologically productive land/sea area
- 32. Easter Island Case Study 1.1 Dutch sailors
- 33. Easter Island Case Study 1.1 Archaeologists have
- 34. Environmentalism Awareness and environmental movements began in
- 35. Chapter 1 Quiz On Bb in “Quizzes”
Слайд 11-
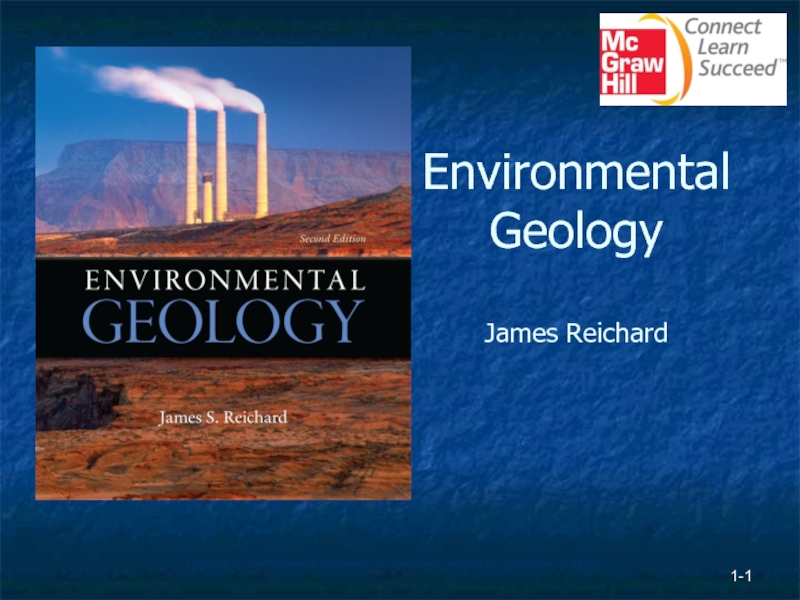
Environmental
Geology
James Reichard
Copyright © The McGraw-Hill Companies, Inc. Permission required for
Слайд 21-
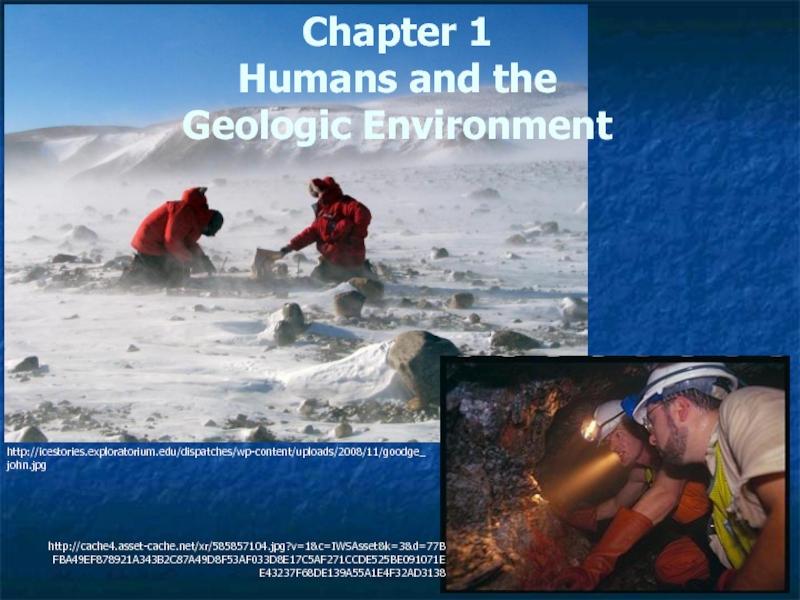
Chapter 1
Humans and the
Geologic Environment
http://cache4.asset-cache.net/xr/585857104.jpg?v=1&c=IWSAsset&k=3&d=77BFBA49EF878921A343B2C87A49D8F53AF033D8E17C5AF271CCDE525BE091071EE43237F68DE139A55A1E4F32AD3138
http://icestories.exploratorium.edu/dispatches/wp-content/uploads/2008/11/goodge_john.jpg
Слайд 31-
Earth
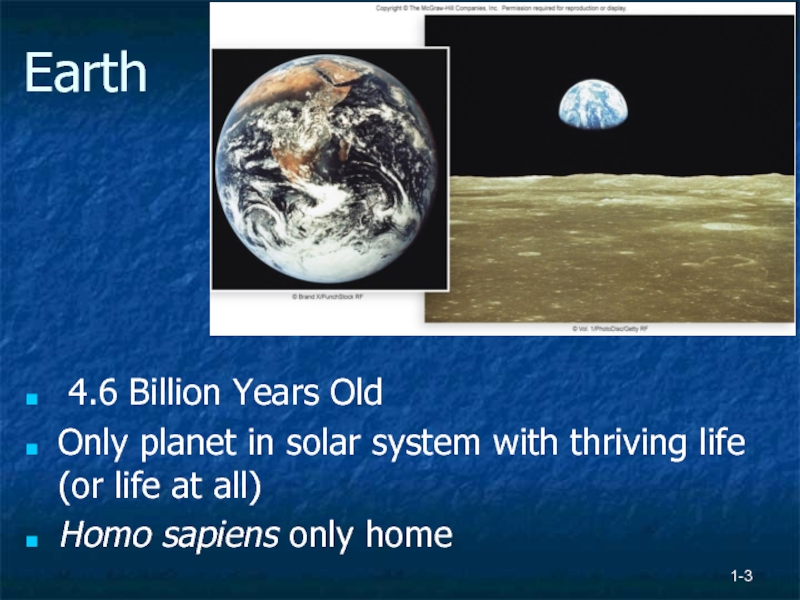
4.6 Billion Years Old
Only planet in solar system with thriving
life (or life at all)
Homo sapiens only home
Homo sapiens only home
Слайд 4What Makes Earth Unique
Right conditions for life
Liquid, frozen and gas state
water
Earth can hold its atmosphere
Natural processes for removing CO2
But, humans are using natural resources and interacting with geologic processes
Geologic processes include volcanic eruptions, floods, landslides, earthquakes, etc
Earth can hold its atmosphere
Natural processes for removing CO2
But, humans are using natural resources and interacting with geologic processes
Geologic processes include volcanic eruptions, floods, landslides, earthquakes, etc
1-
Слайд 51-
What Is Geology?
The study of the solid Earth, its composition and
how formed
Both materials (metals, minerals, fossils fuels) and processes (floods, volcanic eruptions, landslides)
Geologists study how mineral forms, locate fossil fuel deposits, study hazardous Earth processes
Both materials (metals, minerals, fossils fuels) and processes (floods, volcanic eruptions, landslides)
Geologists study how mineral forms, locate fossil fuel deposits, study hazardous Earth processes
Слайд 6Two Main Branches of Geology
Physical Geology
Studies processes that shape and
modify the Earth
Historical Geology
Interprets the geologic rock record – “geologic time”
New sub discipline: Environmental Geology
Uses geology to solve problems between humans and the environment
Historical Geology
Interprets the geologic rock record – “geologic time”
New sub discipline: Environmental Geology
Uses geology to solve problems between humans and the environment
1-
Слайд 71-
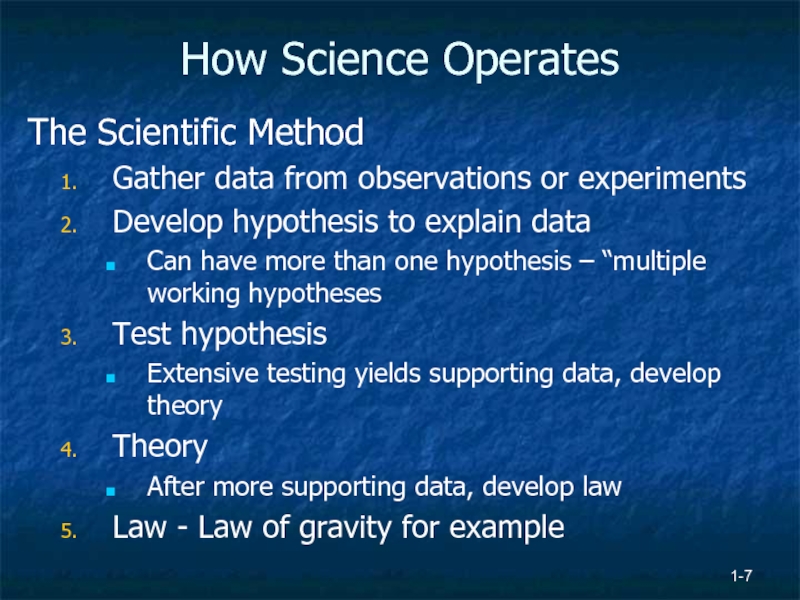
How Science Operates
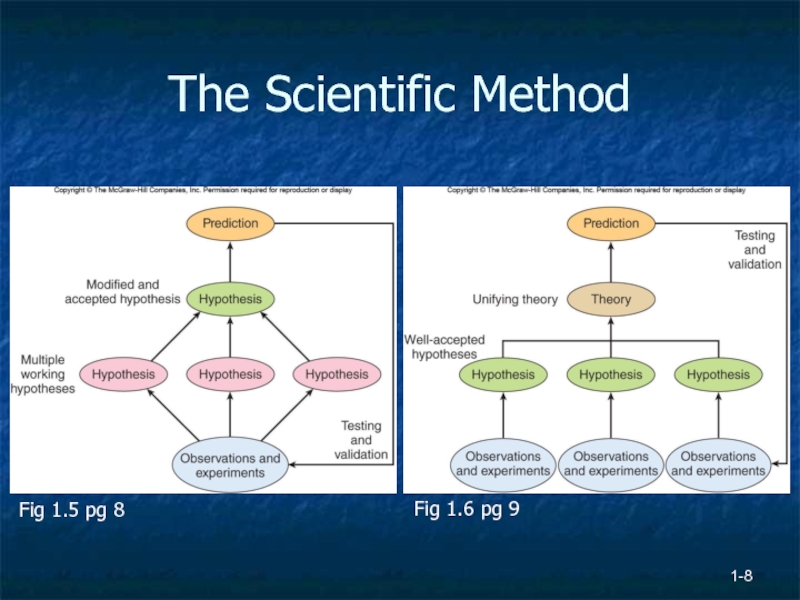
The Scientific Method
Gather data from observations or experiments
Develop hypothesis
to explain data
Can have more than one hypothesis – “multiple working hypotheses
Test hypothesis
Extensive testing yields supporting data, develop theory
Theory
After more supporting data, develop law
Law - Law of gravity for example
Can have more than one hypothesis – “multiple working hypotheses
Test hypothesis
Extensive testing yields supporting data, develop theory
Theory
After more supporting data, develop law
Law - Law of gravity for example
Слайд 91-
Environmental Geology
Solves problems between humans and the environment
Two categories of environmental
problems related to geology
Geologic hazards – any geologic condition that creates potential risk to human life or property, for ex. Earthquakes, volcanic eruptions, floods, pollution
Earth resources – water, soil, minerals and energy
Geologic hazards – any geologic condition that creates potential risk to human life or property, for ex. Earthquakes, volcanic eruptions, floods, pollution
Earth resources – water, soil, minerals and energy
Слайд 101-
Environmental Geology
Geologic hazards
Natural
Earthquakes, volcanic eruptions
Artificial
Pollution – impacts human health and ecosystems
Human
interference
Слайд 111-
Environmental Geology
Earth’s Resources – water, soil, mineral and energy resources.
Renewable
Soil and
water
Nonrenewable
Minerals and rock
Energy – fossil fuels
Nonrenewable
Minerals and rock
Energy – fossil fuels
Слайд 121-
Geologic Time
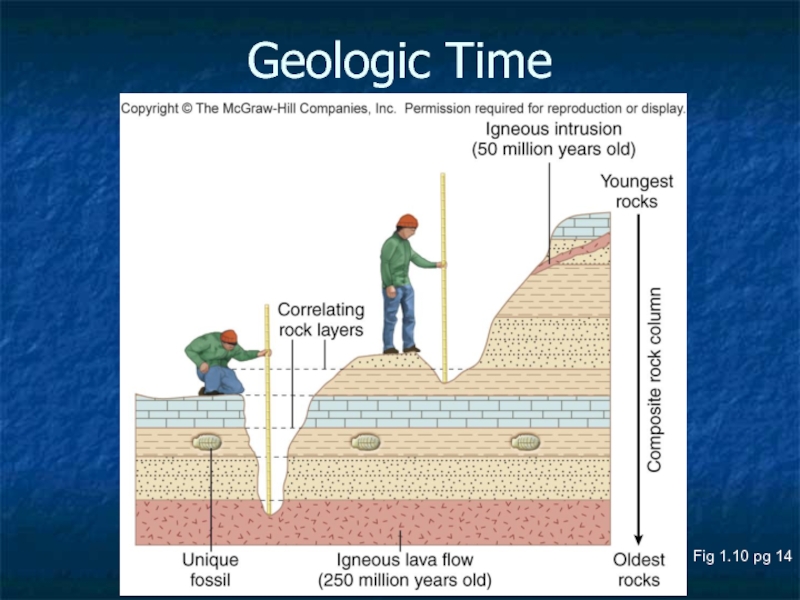
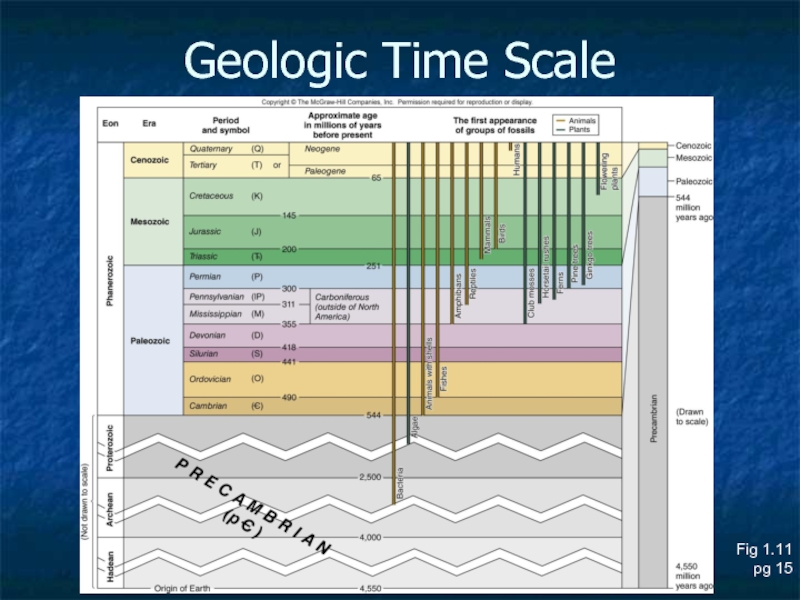
Classifies all rocks by relative or chronological age
Law of Superposition-
in horizontal sediments, the rocks at the bottom or deepest are the oldest, youngest are at the top
Geologic Time Scale- Chart of relative ages of all the rocks.
Geologic Time Scale- Chart of relative ages of all the rocks.
Слайд 151-
Geologic Time
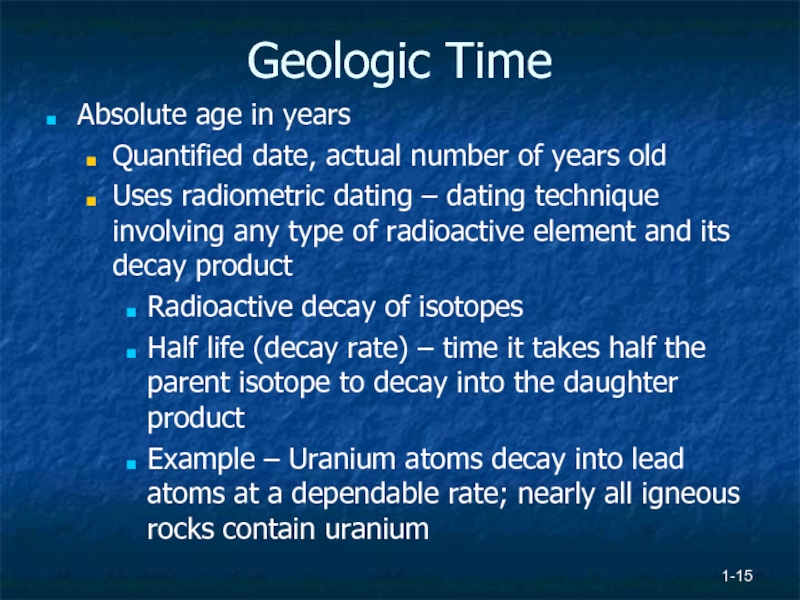
Absolute age in years
Quantified date, actual number of years old
Uses
radiometric dating – dating technique involving any type of radioactive element and its decay product
Radioactive decay of isotopes
Half life (decay rate) – time it takes half the parent isotope to decay into the daughter product
Example – Uranium atoms decay into lead atoms at a dependable rate; nearly all igneous rocks contain uranium
Radioactive decay of isotopes
Half life (decay rate) – time it takes half the parent isotope to decay into the daughter product
Example – Uranium atoms decay into lead atoms at a dependable rate; nearly all igneous rocks contain uranium
Слайд 171-
Environmental Risk and
Human Reaction
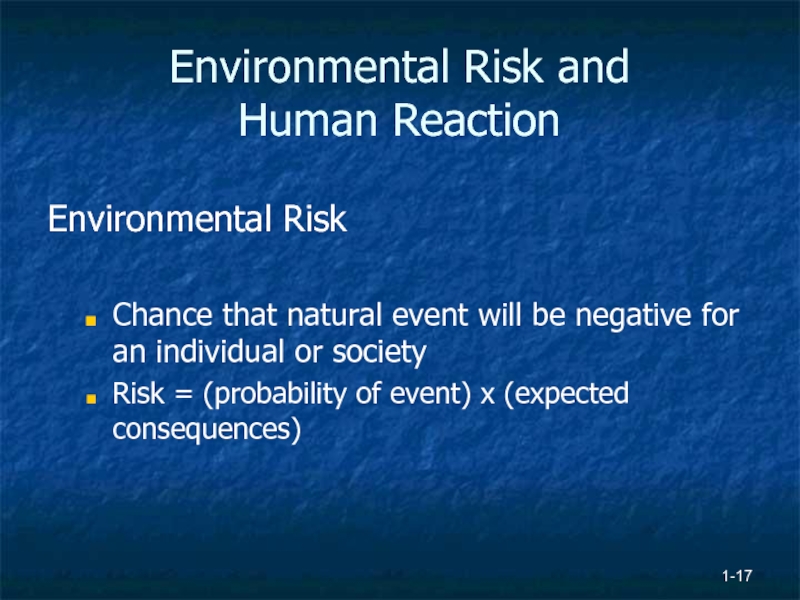
Environmental Risk
Chance that natural event will be
negative for an individual or society
Risk = (probability of event) x (expected consequences)
Risk = (probability of event) x (expected consequences)
Слайд 181-
Environmental Risk and
Human Reaction
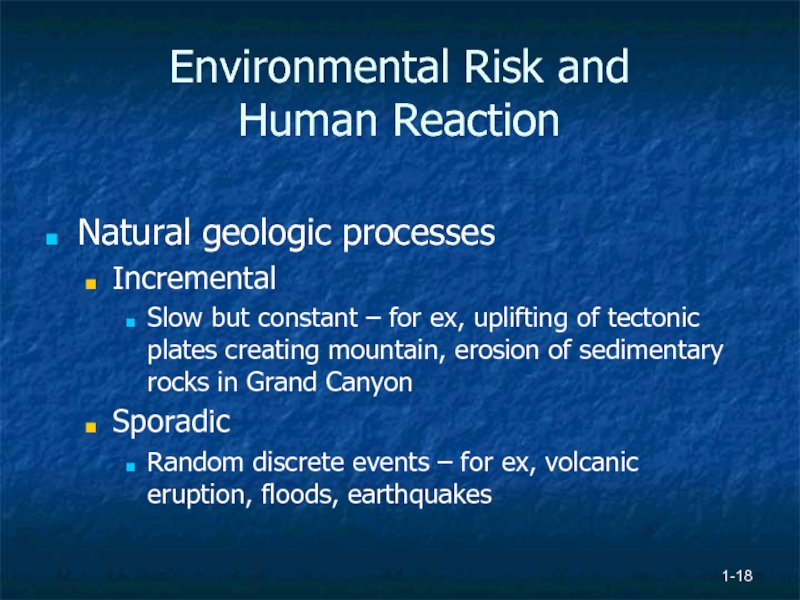
Natural geologic processes
Incremental
Slow but constant – for
ex, uplifting of tectonic plates creating mountain, erosion of sedimentary rocks in Grand Canyon
Sporadic
Random discrete events – for ex, volcanic eruption, floods, earthquakes
Sporadic
Random discrete events – for ex, volcanic eruption, floods, earthquakes
Слайд 191-
Earth as a System
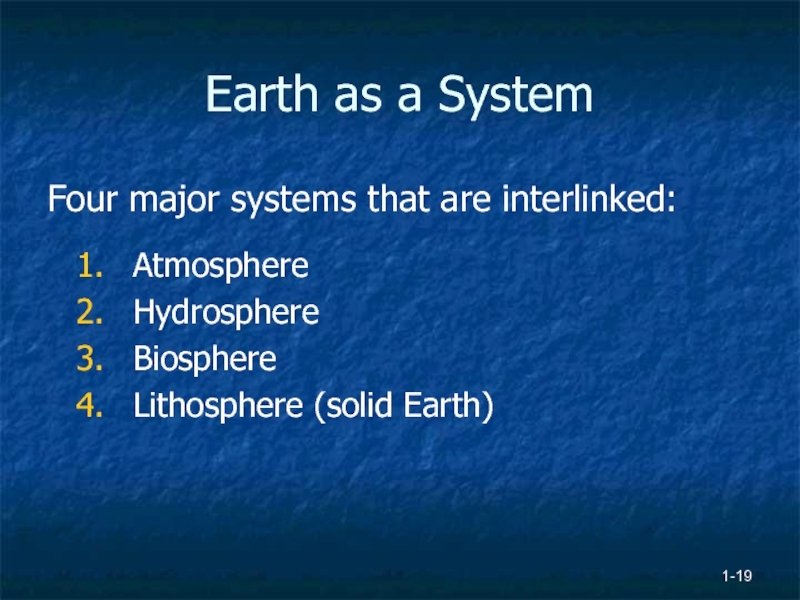
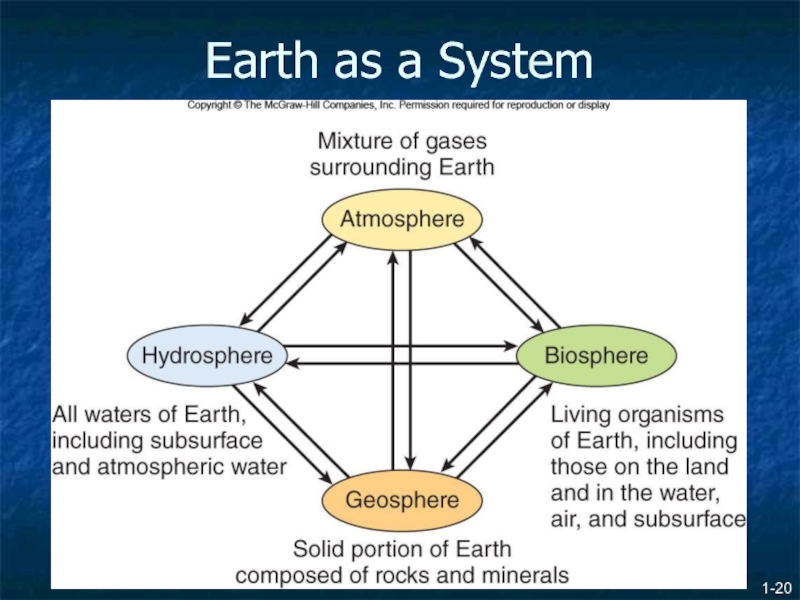
Four major systems that are interlinked:
Atmosphere
Hydrosphere
Biosphere
Lithosphere (solid Earth)
Слайд 211-
Earth and Human Population
Humans are part of the biosphere
We interact with
the other three spheres
Increasing population causes more interference with the other three spheres
Increasing population causes more interference with the other three spheres
Слайд 221-
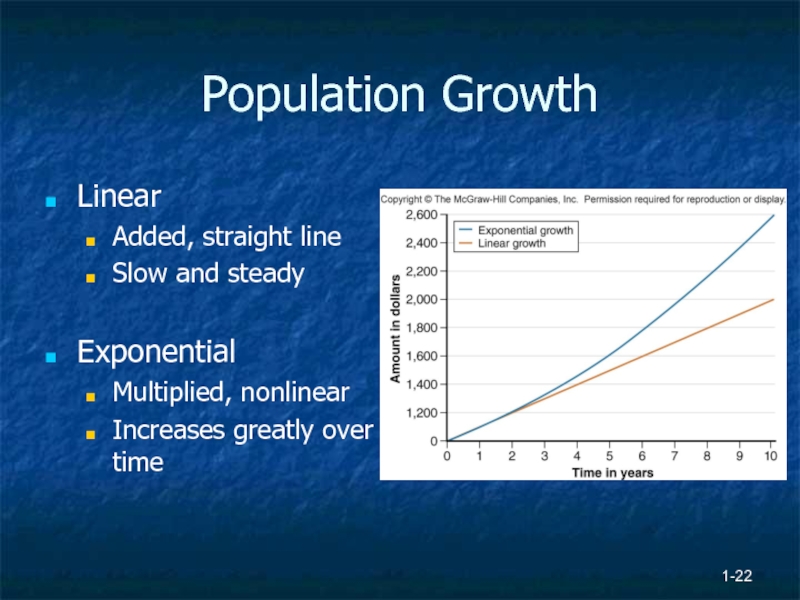
Population Growth
Linear
Added, straight line
Slow and steady
Exponential
Multiplied, nonlinear
Increases greatly over time
Слайд 231-
Limits to Growth
Limit to how many people Earth can support first
in 1687 by Antoni van Leeuwenhoek
1798 Thomas Malthus
Population growth exponential
Food production linear
Food production controls population
To date, food production has kept up with demand. . . But are we feeding everyone??
1798 Thomas Malthus
Population growth exponential
Food production linear
Food production controls population
To date, food production has kept up with demand. . . But are we feeding everyone??
Слайд 241-
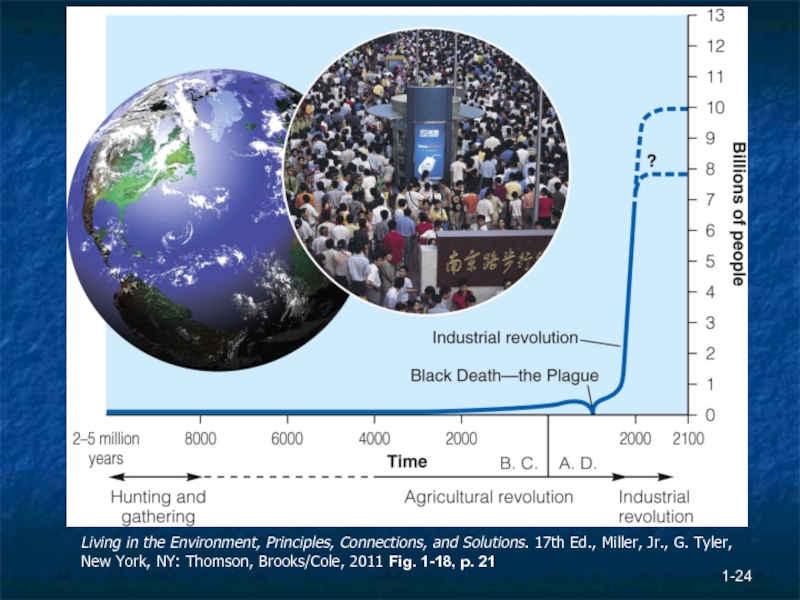
Living in the Environment, Principles, Connections, and Solutions. 17th Ed., Miller,
Jr., G. Tyler, New York, NY: Thomson, Brooks/Cole, 2011 Fig. 1-18, p. 21
Слайд 251-
Sustainability
Being able to maintain a system or process for an indefinite
period of time
Sustainable society
Lives within the Earth’s capacity to provide resources for future generations
Natural systems operate this way
Sustainable society
Lives within the Earth’s capacity to provide resources for future generations
Natural systems operate this way
Слайд 26Population Growth Pyramids
Pop growth affected by birth and death rates
More births
than deaths = growth
More deaths than births = decline
If births and deaths roughly equal = equilibrium
Countries in demographic transition are changing from high birth rate, high death rate to lower birth and lower death rates
More deaths than births = decline
If births and deaths roughly equal = equilibrium
Countries in demographic transition are changing from high birth rate, high death rate to lower birth and lower death rates
Слайд 27Demographic Transition
Transition has to do with industrialization, standard of living and
empowerment of women to choose how many children to have, access to birth control.
Population growth of humans affects the environment and wildlife thus human population growth is a huge issue in biology and environmental science.
Age structure graphs allow countries to predict how they are growing so they can provide social services to changing populations — they are planning tools.
Слайд 28Demographic Transition
For example, booming levels of school age children means you
need more access to vaccines, day cares, schools, health care clinics.
If you have an aging population, you might need more health care professionals and nursing homes but fewer schools.
If there are more young people/young adults, you could put funding into providing education and job training for those people rather than services for the really young or elderly
If you have an aging population, you might need more health care professionals and nursing homes but fewer schools.
If there are more young people/young adults, you could put funding into providing education and job training for those people rather than services for the really young or elderly
Слайд 29Age Structure Pyramids
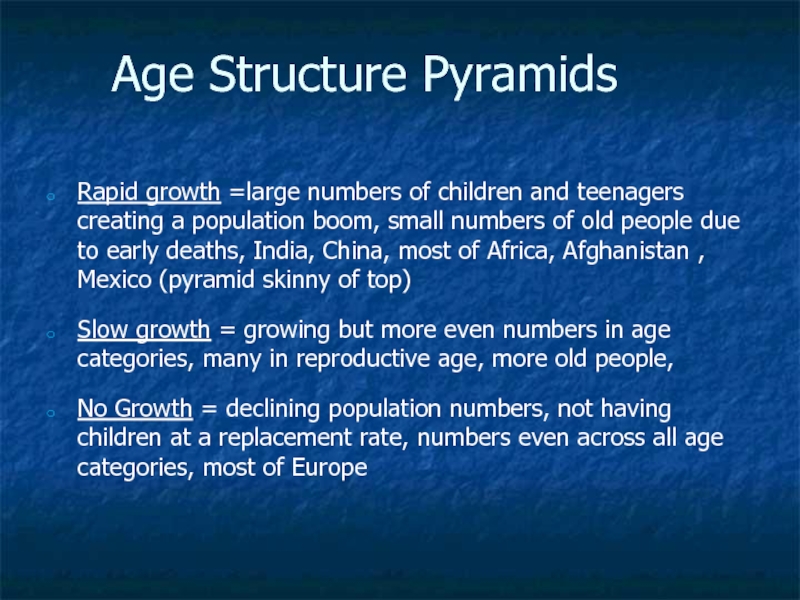
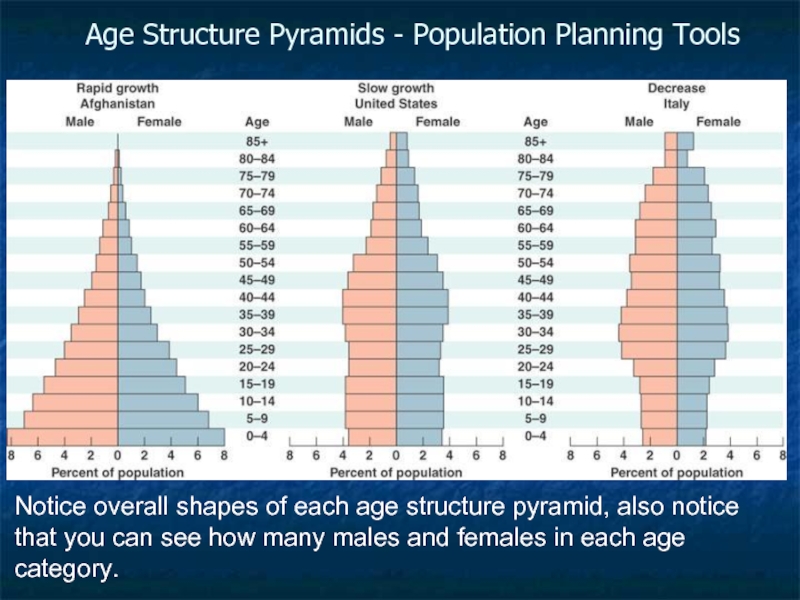
Rapid growth =large numbers of children and teenagers creating
a population boom, small numbers of old people due to early deaths, India, China, most of Africa, Afghanistan , Mexico (pyramid skinny of top)
Slow growth = growing but more even numbers in age categories, many in reproductive age, more old people,
No Growth = declining population numbers, not having children at a replacement rate, numbers even across all age categories, most of Europe
Slow growth = growing but more even numbers in age categories, many in reproductive age, more old people,
No Growth = declining population numbers, not having children at a replacement rate, numbers even across all age categories, most of Europe
Слайд 30Age Structure Pyramids - Population Planning Tools
Notice overall shapes of each
age structure pyramid, also notice that you can see how many males and females in each age category.
Слайд 311-
Ecological Footprint
Biologically productive land/sea area needed to support lifestyle of humans
6
acres per person global average
10 for a Swiss
4 for a Chinese
24 for an American
10 for a Swiss
4 for a Chinese
24 for an American
Слайд 32Easter Island Case Study 1.1
Dutch sailors first discovered it in 1722
and estimated there were 2,000 inhabitants
By then no trees, canoes were leaky and made of planks and scraps
Huge statues weighing several tons lined the island
By then no trees, canoes were leaky and made of planks and scraps
Huge statues weighing several tons lined the island
1-
Слайд 33Easter Island Case Study 1.1
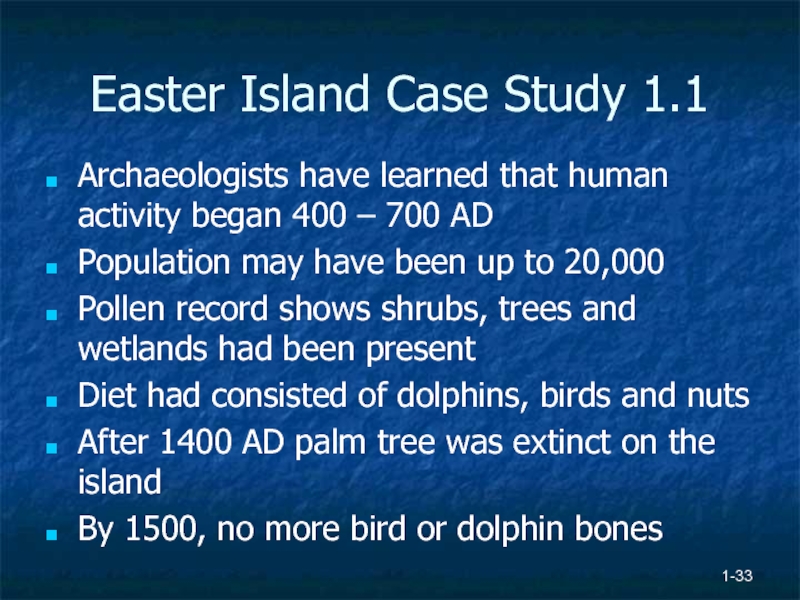
Archaeologists have learned that human activity began
400 – 700 AD
Population may have been up to 20,000
Pollen record shows shrubs, trees and wetlands had been present
Diet had consisted of dolphins, birds and nuts
After 1400 AD palm tree was extinct on the island
By 1500, no more bird or dolphin bones
Population may have been up to 20,000
Pollen record shows shrubs, trees and wetlands had been present
Diet had consisted of dolphins, birds and nuts
After 1400 AD palm tree was extinct on the island
By 1500, no more bird or dolphin bones
1-
Слайд 34Environmentalism
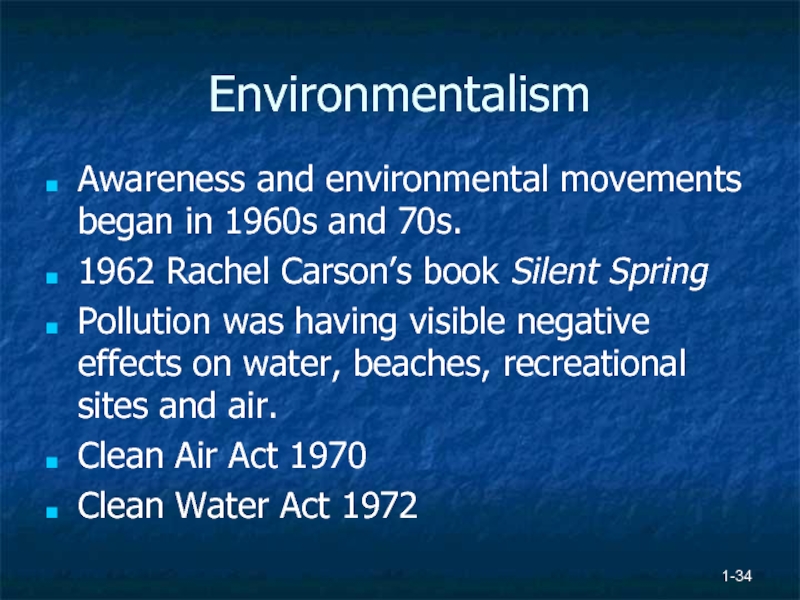
Awareness and environmental movements began in 1960s and 70s.
1962 Rachel
Carson’s book Silent Spring
Pollution was having visible negative effects on water, beaches, recreational sites and air.
Clean Air Act 1970
Clean Water Act 1972
Pollution was having visible negative effects on water, beaches, recreational sites and air.
Clean Air Act 1970
Clean Water Act 1972
1-
