- Главная
- Разное
- Дизайн
- Бизнес и предпринимательство
- Аналитика
- Образование
- Развлечения
- Красота и здоровье
- Финансы
- Государство
- Путешествия
- Спорт
- Недвижимость
- Армия
- Графика
- Культурология
- Еда и кулинария
- Лингвистика
- Английский язык
- Астрономия
- Алгебра
- Биология
- География
- Детские презентации
- Информатика
- История
- Литература
- Маркетинг
- Математика
- Медицина
- Менеджмент
- Музыка
- МХК
- Немецкий язык
- ОБЖ
- Обществознание
- Окружающий мир
- Педагогика
- Русский язык
- Технология
- Физика
- Философия
- Химия
- Шаблоны, картинки для презентаций
- Экология
- Экономика
- Юриспруденция
Mechanical oscillations and waves. Bioacoustics. Ultrasound презентация
Содержание
- 1. Mechanical oscillations and waves. Bioacoustics. Ultrasound
- 2. OSCILLATIONS OSCILLATIONS – are movements or processes
- 3. KINDS OF OSCILLATIONS complex form oscillations rectangular
- 4. PARAMETERS OF OSCILLATIONS AMPLITUDE- maximal displacement from
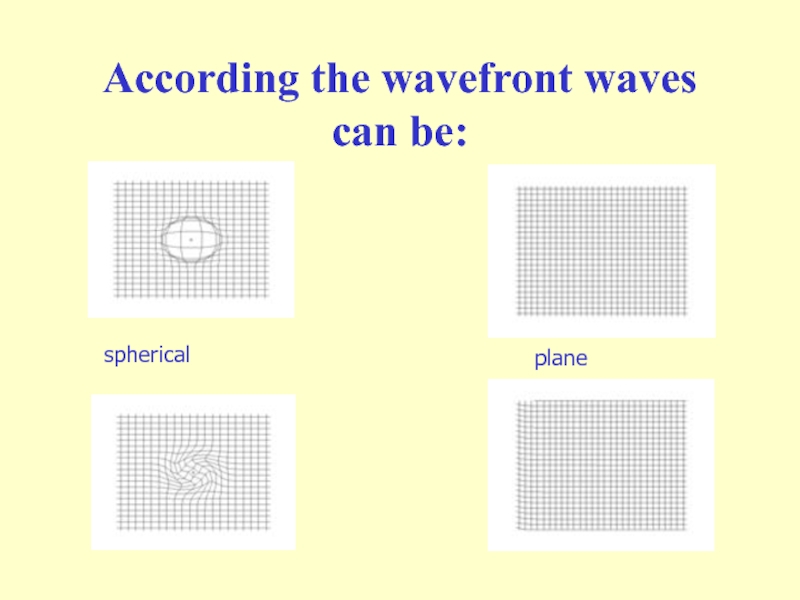
- 5. WAVE WAVEFRONT - is the locus (a line, or, in
- 6. According the wavefront waves can be: spherical plane
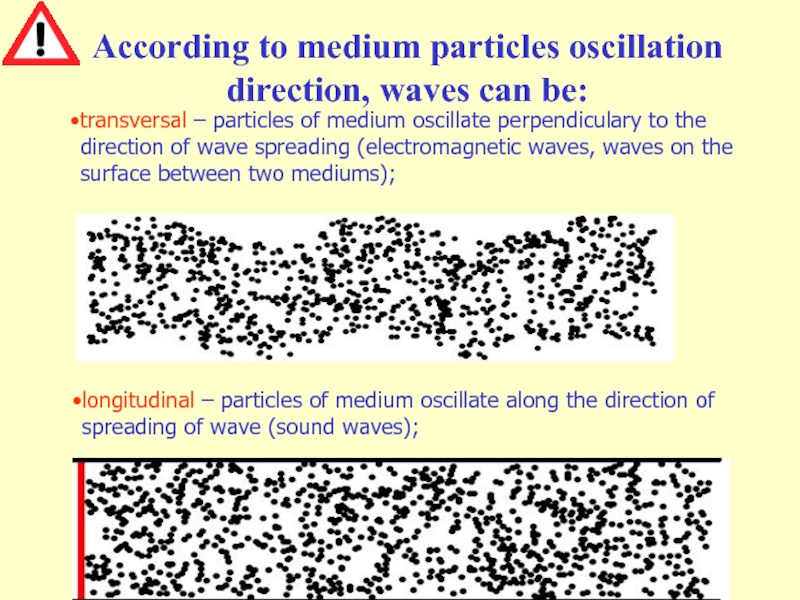
- 7. transversal – particles of medium oscillate
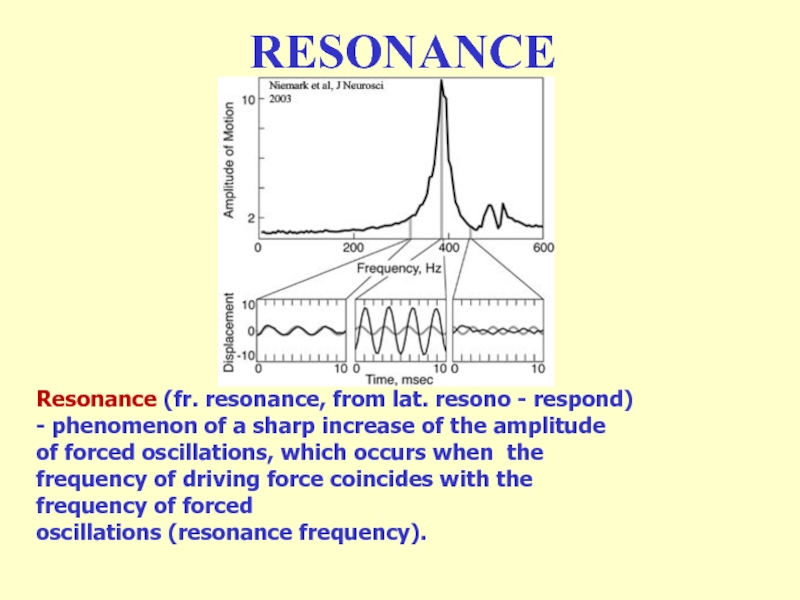
- 8. RESONANCE Resonance (fr. resonance, from lat. resono
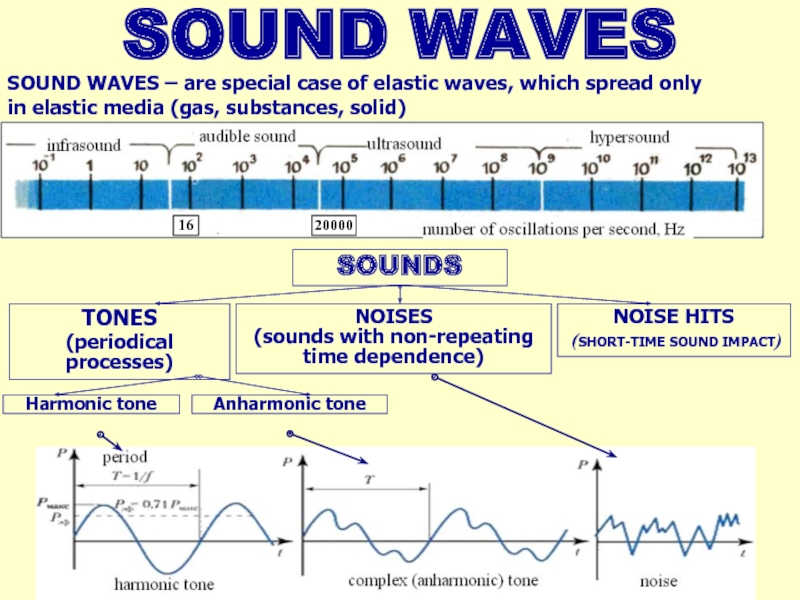
- 9. SOUND WAVES SOUND WAVES – are special case of elastic waves, which spread only in elastic media (gas, substances, solid)
- 10. ν І NOISE SPECTRUM ν
- 11. Volume scale Weber–Fechner law Where L –
- 12. Doppler effect for sound waves u –
- 13. Doppler effect for sound waves An animation
- 14. Doppler effect for sound waves Stationary sound
- 15. SOUND DIAGNOSTIC METHODS Auscultation is the term for
- 16. ULTRASOUND IN MEDICINE IN DIAGNOSTICS IN CURING
- 17. ULTRASOUND IMAGING Modern USI apparatus Ultrasound
- 18. US scanning modes A-mode or “Amplitude mode”
- 19. 3D USI 3D USI gives a three
- 20. Dopplerography Spectral doppler common carotid artery Transcranial doppler. Color
- 21. ECHOCARDIOSCOPY
Слайд 2OSCILLATIONS
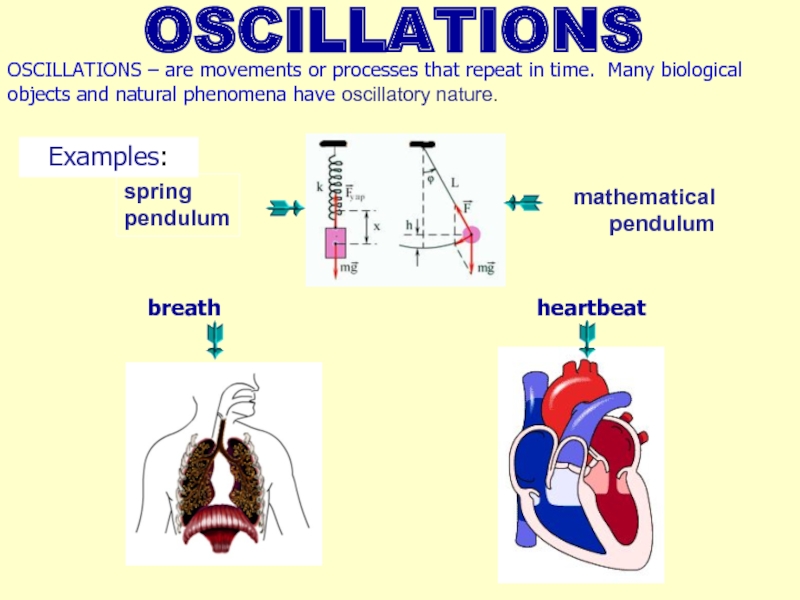
OSCILLATIONS – are movements or processes that repeat in time. Many
mathematical
pendulum
spring
pendulum
breath
heartbeat
Examples:
Слайд 3KINDS OF OSCILLATIONS
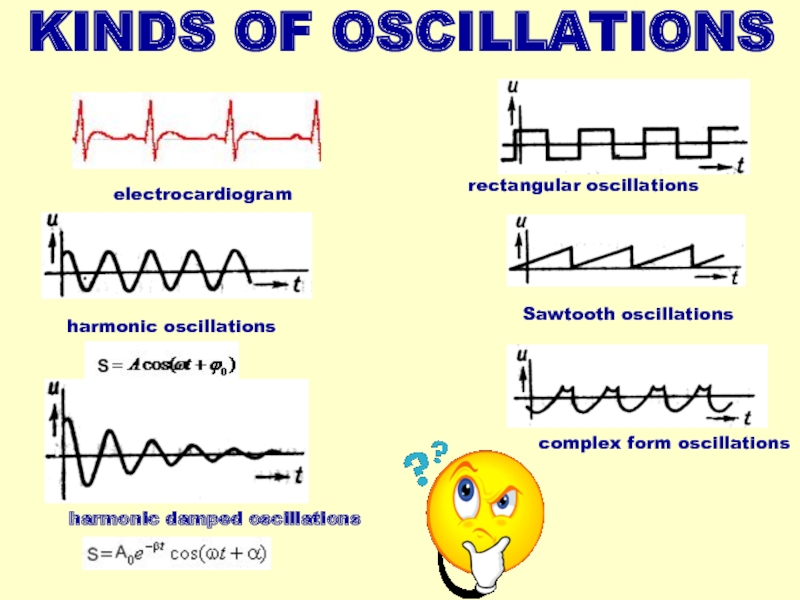
complex form oscillations
rectangular oscillations
Sawtooth oscillations
harmonic oscillations
harmonic damped oscillations
electrocardiogram
Слайд 4PARAMETERS OF OSCILLATIONS
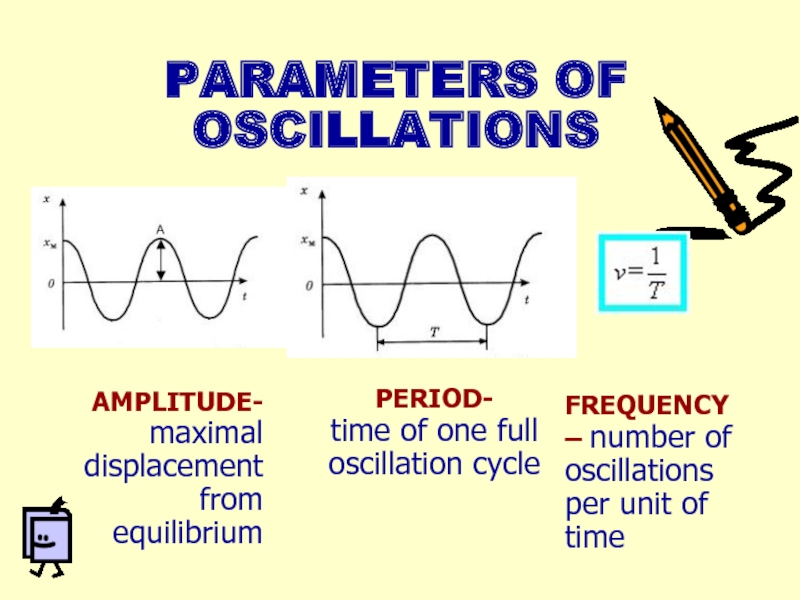
AMPLITUDE-
maximal displacement from equilibrium
PERIOD-
time of one full oscillation cycle
FREQUENCY – number of oscillations per unit of time
Слайд 5WAVE
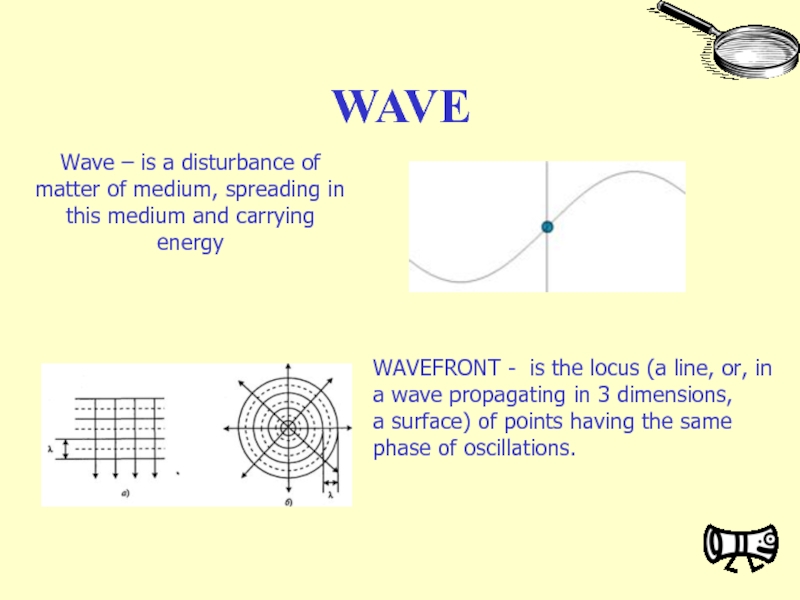
WAVEFRONT - is the locus (a line, or, in a wave propagating in 3 dimensions, a surface)
Wave – is a disturbance of matter of medium, spreading in this medium and carrying energy
Слайд 7
transversal – particles of medium oscillate perpendiculary to the direction of
According to medium particles oscillation direction, waves can be:
longitudinal – particles of medium oscillate along the direction of spreading of wave (sound waves);
Слайд 8RESONANCE
Resonance (fr. resonance, from lat. resono - respond) - phenomenon of a
Слайд 9SOUND WAVES
SOUND WAVES – are special case of elastic waves, which spread only
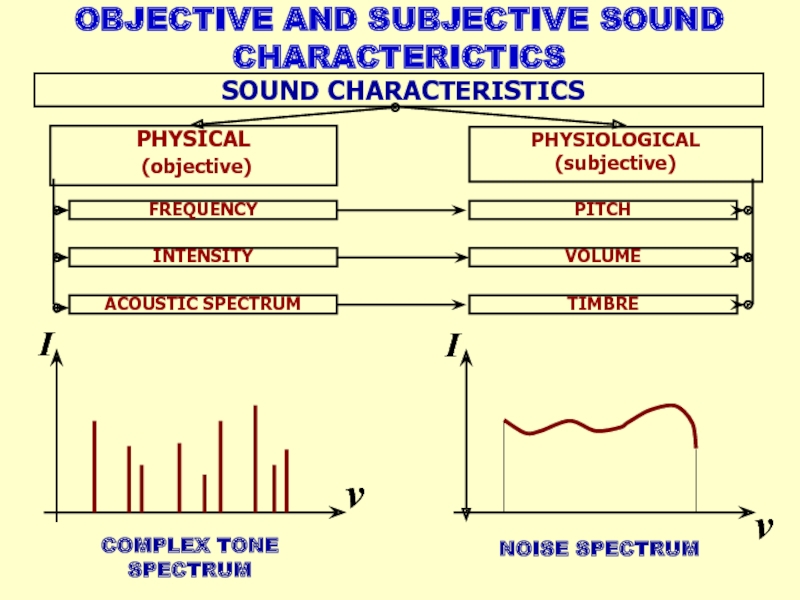
Слайд 10ν
І
NOISE SPECTRUM
ν
COMPLEX TONE SPECTRUM
І
SOUND CHARACTERISTICS
OBJECTIVE AND SUBJECTIVE SOUND CHARACTERICTICS
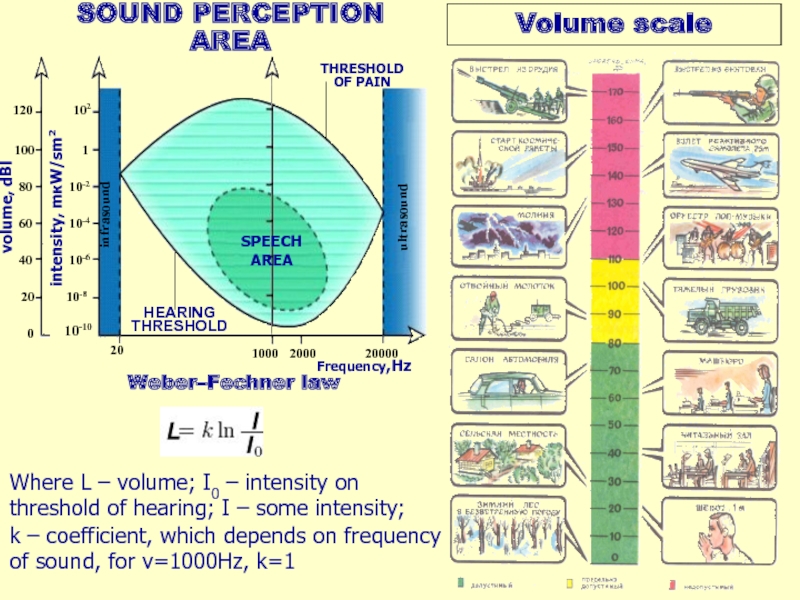
Слайд 11Volume scale
Weber–Fechner law
Where L – volume; I0 – іntensity on threshold
k – coefficient, which depends on frequency of sound, for ν=1000Hz, k=1
Frequency,Hz
intensity, mкW/sm2
infrasound
ultrasound
20
1000
2000
20000
HEARING THRESHOLD
THRESHOLD OF PAIN
10-10
10-8
40
60
80
100
120
volume, dBl
0
10-6
10-4
10-2
1
102
20
SPEECH AREA
SOUND PERCEPTION AREA
Слайд 12Doppler effect for sound waves
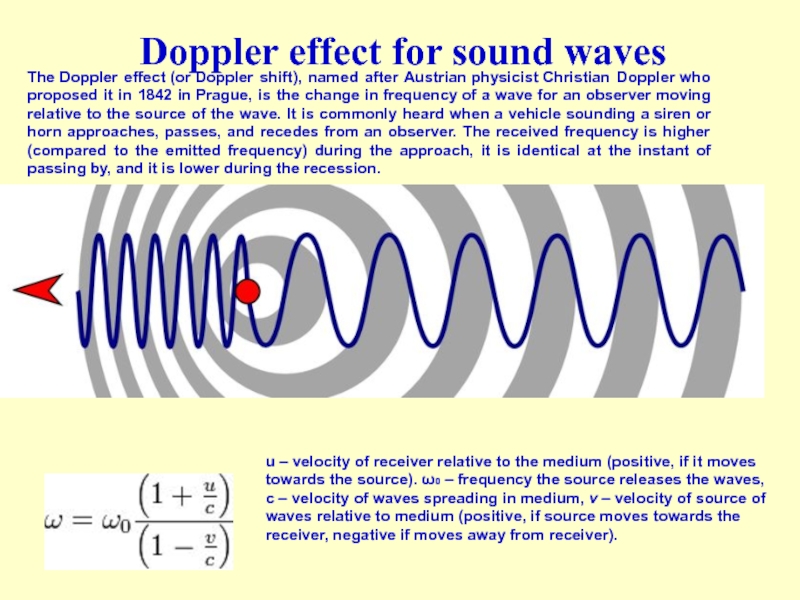
u – velocity of receiver relative to
The Doppler effect (or Doppler shift), named after Austrian physicist Christian Doppler who proposed it in 1842 in Prague, is the change in frequency of a wave for an observer moving relative to the source of the wave. It is commonly heard when a vehicle sounding a siren or horn approaches, passes, and recedes from an observer. The received frequency is higher (compared to the emitted frequency) during the approach, it is identical at the instant of passing by, and it is lower during the recession.
Слайд 13Doppler effect for sound waves
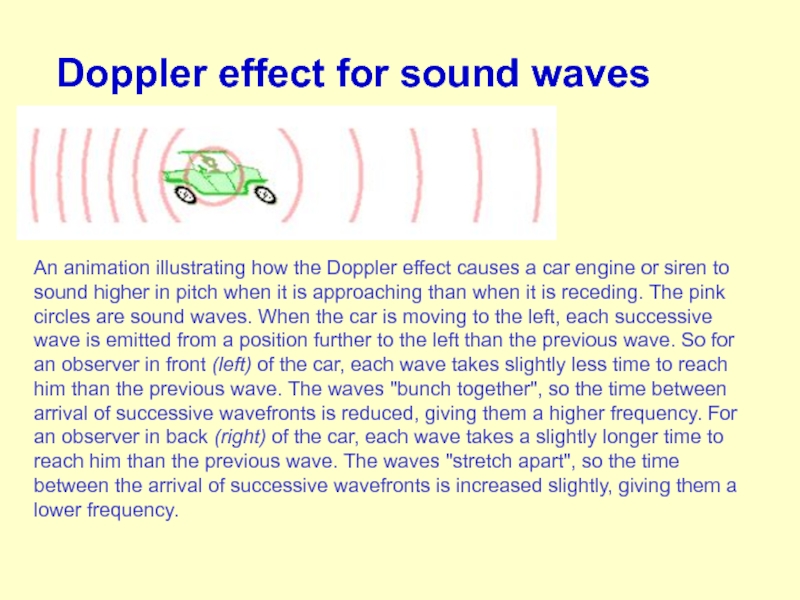
An animation illustrating how the Doppler effect
Слайд 14Doppler effect for sound waves
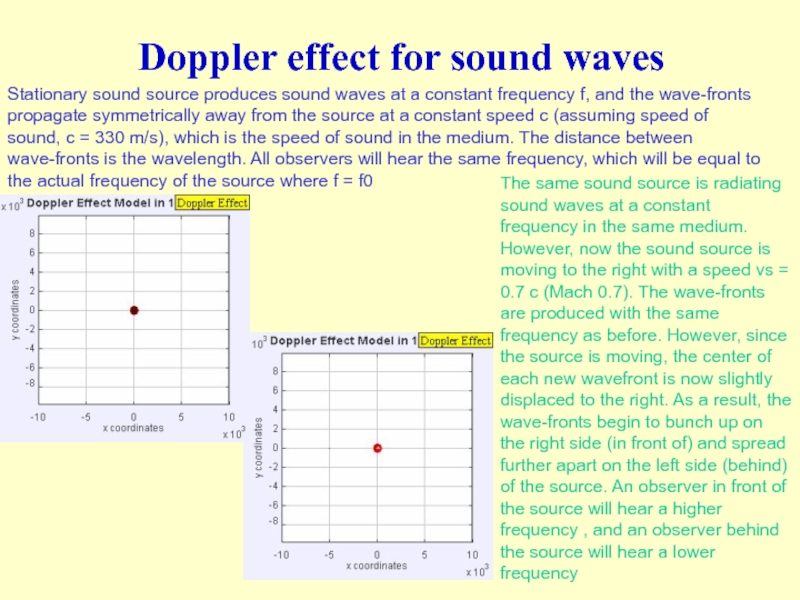
Stationary sound source produces sound waves at
The same sound source is radiating sound waves at a constant frequency in the same medium. However, now the sound source is moving to the right with a speed vs = 0.7 c (Mach 0.7). The wave-fronts are produced with the same frequency as before. However, since the source is moving, the center of each new wavefront is now slightly displaced to the right. As a result, the wave-fronts begin to bunch up on the right side (in front of) and spread further apart on the left side (behind) of the source. An observer in front of the source will hear a higher frequency , and an observer behind the source will hear a lower frequency
Слайд 15SOUND DIAGNOSTIC METHODS
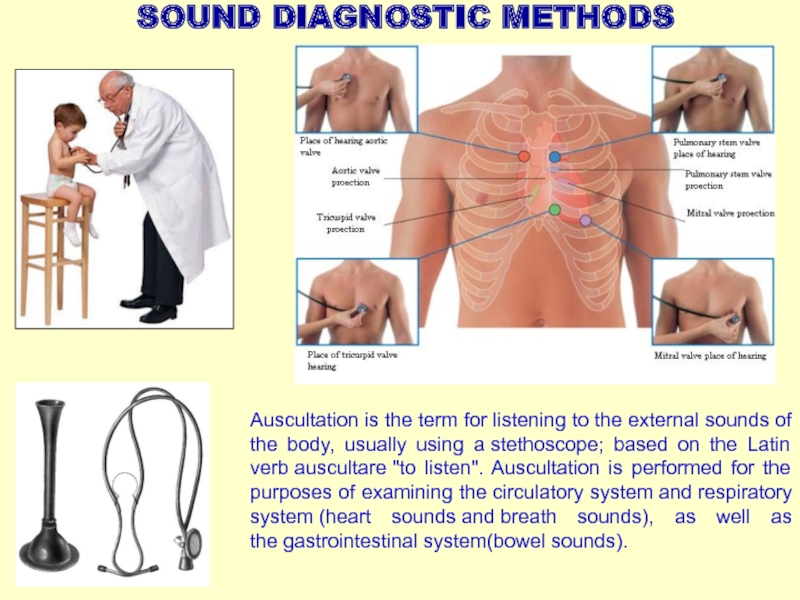
Auscultation is the term for listening to the external sounds
Слайд 16ULTRASOUND IN MEDICINE
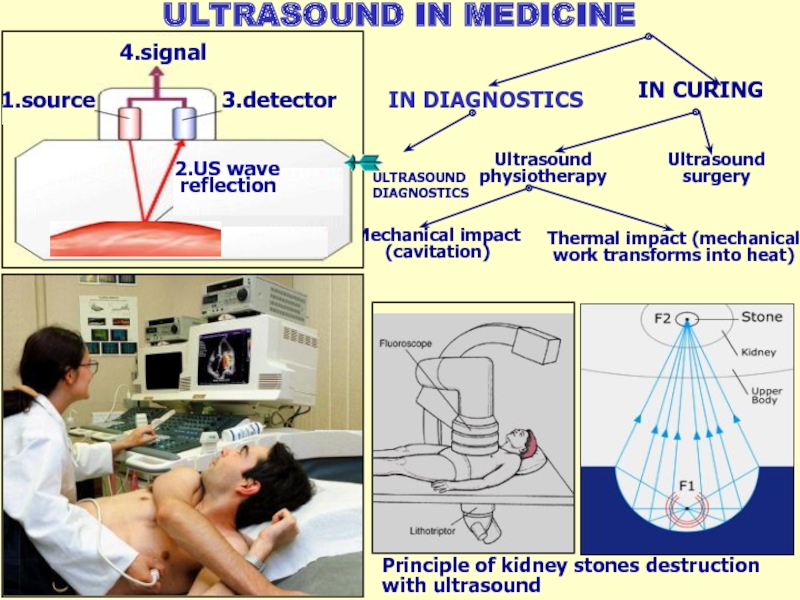
IN DIAGNOSTICS
IN CURING
Ultrasound physiotherapy
Ultrasound surgery
Mechanical impact (cavitation)
Thermal impact (mechanical
Principle of kidney stones destruction with ultrasound
ULTRASOUND
DIAGNOSTICS
УЗИ
4.signal
1.source
3.detector
2.US wave
reflection
Слайд 17ULTRASOUND
IMAGING
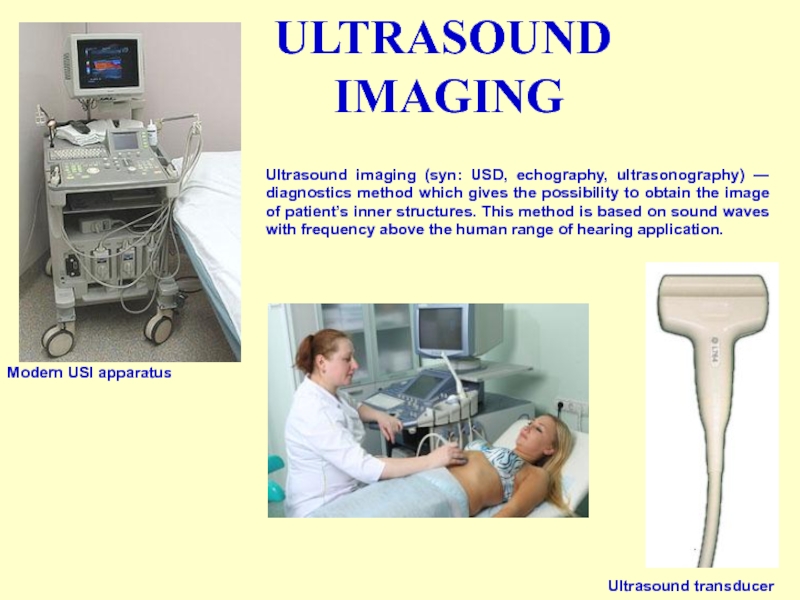
Modern USI apparatus
Ultrasound transducer
Ultrasound imaging (syn: USD, echography, ultrasonography) —
Слайд 18US scanning modes
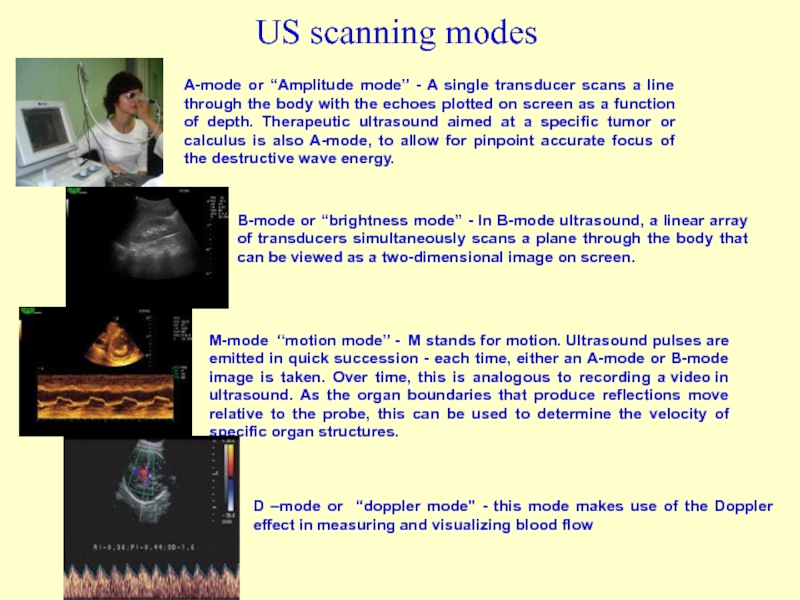
A-mode or “Amplitude mode” - A single transducer scans
В-mode or “brightness mode” - In B-mode ultrasound, a linear array of transducers simultaneously scans a plane through the body that can be viewed as a two-dimensional image on screen.
М-mode “motion mode” - M stands for motion. Ultrasound pulses are emitted in quick succession - each time, either an A-mode or B-mode image is taken. Over time, this is analogous to recording a video in ultrasound. As the organ boundaries that produce reflections move relative to the probe, this can be used to determine the velocity of specific organ structures.
D –mode or “doppler mode" - this mode makes use of the Doppler effect in measuring and visualizing blood flow
Слайд 193D USI
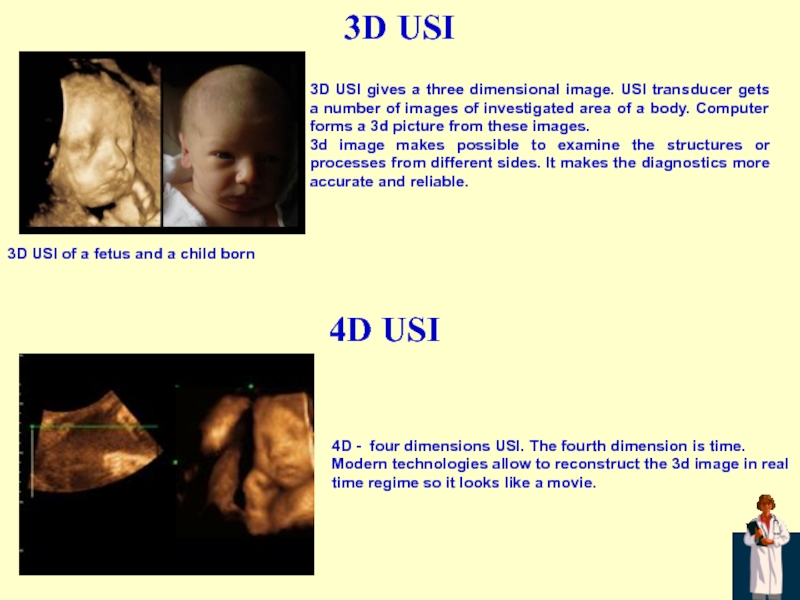
3D USI gives a three dimensional image. USI transducer gets
3d image makes possible to examine the structures or processes from different sides. It makes the diagnostics more accurate and reliable.
3D USI of a fetus and a child born
4D - four dimensions USI. The fourth dimension is time. Modern technologies allow to reconstruct the 3d image in real time regime so it looks like a movie.
4D USI

