1) 200 EMA and 50 EMA: These help me understand the direction of trend
2) Support Resistance indicator: This helps draw out the support and resistance lines based on inputs. It helps to keep the method consistent
Steps to perform method:
Find direction:
Buy: If price is above 200EMA and 50 EMA for H1, H4, and D1
Sell: If price is below 200EMA and 50 EMA for H1, H4, and D1
Do nothing: if above criteria is not met
Find entry:
Add the Support and Resistance indicator to the chart
Buy order:
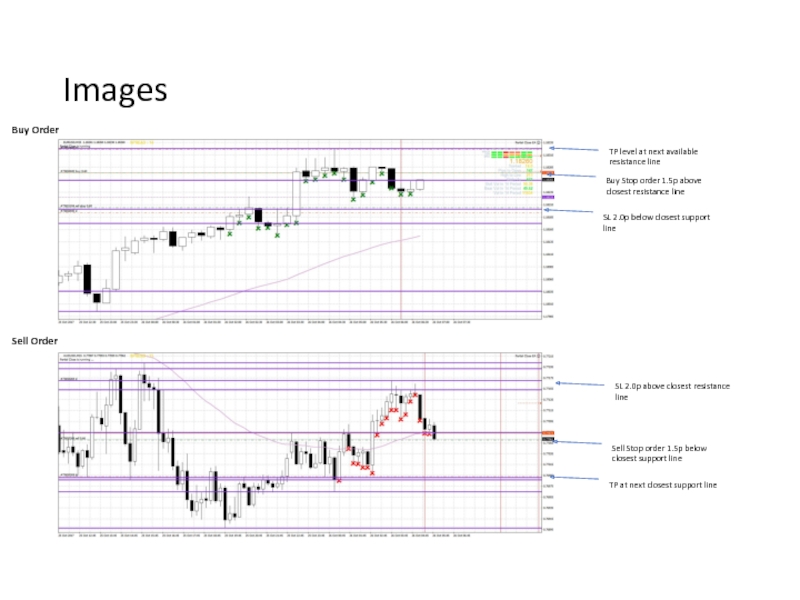
Find advance entry: Identify the closest resistance line above the price. Mark 1.5p above the resistance line as a potential entry point
Find TP level: Identify the next closest resistance line above the potential entry point. Mark this as the potential TP level
Find SL level: Identify the next closest support line below the potential entry point. Mark 2.0p below this as the potential SL level
Validations:
Is TP level > =7p from the entry?
Yes = good, perform next check
No = skip trade
Is SL level >= 5p from the entry?
Yes = good, perform next check
No = skip trade
Is trade a 1:1? (give 10% tolerance)
Yes = take trade
No = skip trade
3. Sell order:
Find advance entry: Identify the closest support line below the price. Mark 1.5p below the support line as a potential entry point
Find TP level: Identify the next closest support line below the potential entry point. Mark this as the potential TP level
Find SL level: Identify the next closest resistance line above the potential entry point. Mark 2.0p below this as the potential SL level
Validations:
Is TP level > =7p from the entry?
Yes = good, perform next check
No = skip trade
Is SL level >= 5p from the entry?
Yes = good, perform next check
No = skip trade
Is trade a 1:1? (give 10% tolerance)
Yes = take trade
No = skip trade
Reporting
The EA must perform some basic reporting to tell me why it choses a trade or why it does not chose a trade
This can be to a tab or CSV file
E.g.
Price | TP amount | SL amount | EMA Validation | TP Validation | SL Validation | Risk:Reward Validation
1.2921 | 1.2922 | 1.2901 | True | False | True | False


