- Главная
- Разное
- Дизайн
- Бизнес и предпринимательство
- Аналитика
- Образование
- Развлечения
- Красота и здоровье
- Финансы
- Государство
- Путешествия
- Спорт
- Недвижимость
- Армия
- Графика
- Культурология
- Еда и кулинария
- Лингвистика
- Английский язык
- Астрономия
- Алгебра
- Биология
- География
- Детские презентации
- Информатика
- История
- Литература
- Маркетинг
- Математика
- Медицина
- Менеджмент
- Музыка
- МХК
- Немецкий язык
- ОБЖ
- Обществознание
- Окружающий мир
- Педагогика
- Русский язык
- Технология
- Физика
- Философия
- Химия
- Шаблоны, картинки для презентаций
- Экология
- Экономика
- Юриспруденция
Labor and financial markets презентация
Содержание
- 1. Labor and financial markets
- 2. SUPPLY & DEMAND Baby Boomers Come of
- 3. DEMAND AND SUPPLY AT WORK IN LABOR
- 4. EQUILIBRIUM IN THE LABOR MARKET In 2013,
- 5. This example simplifies the nursing market by
- 6. SHIFTS IN DEMAND The demand curve for
- 9. THE LOW-SKILLED LABOR MARKET The definition of
- 11. SHIFTS IN LABOR SUPPLY
- 12. TECHNOLOGY AND WAGE INEQUALITY: THE FOUR-STEP
- 13. Step 1. What did the markets for
- 14. PRICE FLOORS IN THE LABOR MARKET: LIVING
- 15. DEMAND AND SUPPLY IN FINANCIAL MARKETS Who
- 16. SHIFTS IN DEMAND AND SUPPLY IN FINANCIAL
- 17. PRICE CEILINGS IN FINANCIAL MARKETS: USURY
- 18. SUMMARY In the labor market, households are

Слайд 2SUPPLY & DEMAND
Baby Boomers Come of Age
The Census Bureau reports that
The baby boomer population, the group born between 1946 and 1964, is comprised of approximately 74 million people who have just reached retirement age. As this population grows older, they will be faced with common healthcare issues such as heart conditions, arthritis, and Alzheimer’s that may require hospitalization, long-term, or at-home nursing care. Aging baby boomers and advances in life-saving and lifeextending technologies will increase the demand for healthcare and nursing. Additionally, the Affordable Care Act, which expands access to healthcare for millions of Americans, will further increase the demand.
According to the Bureau of Labor Statistics, registered nursing jobs are expected to increase by 19% between 2012 and 2022. The median annual wage of $67,930 (in 2012) is also expected to increase. The BLS forecasts that 526,000 new nurses will be needed by 2022. One concern is the low rate of enrollment in nursing programs to help meet the growing demand. According to the American Association of Colleges of Nursing (AACN), enrollment in 2011 increased by only 5.1% due to a shortage of nursing educators and teaching facilities.
These data tell us, as economists, that the market for healthcare professionals, and nurses in particular, will face several challenges. Our study of supply and demand will help us to analyze what might happen in the labor market for nursing and other healthcare professionals, as discussed in the second half of this case at the end of the chapter.

Слайд 3DEMAND AND SUPPLY AT WORK IN LABOR MARKETS
Markets for labor have
The law of supply functions in labor markets, too: A higher price for labor leads to a higher quantity of labor supplied; a lower price leads to a lower quantity supplied.

Слайд 4EQUILIBRIUM IN THE LABOR MARKET
In 2013, about 34,000 registered nurses worked
At equilibrium, the quantity supplied and the quantity demanded are equal. Thus, every employer who wants to hire a nurse at this equilibrium wage can find a willing worker, and every nurse who wants to work at this equilibrium salary can find a job.
When the price of labor is not at the equilibrium, economic incentives tend to move salaries toward the equilibrium.

Слайд 5This example simplifies the nursing market by focusing on the “average”
Even in such cases, discussing the average price of gasoline, like the average salary for nurses, can still be useful because it reflects what is happening in most of the submarkets. When the price of labor is not at the equilibrium, economic incentives tend to move salaries toward the equilibrium.

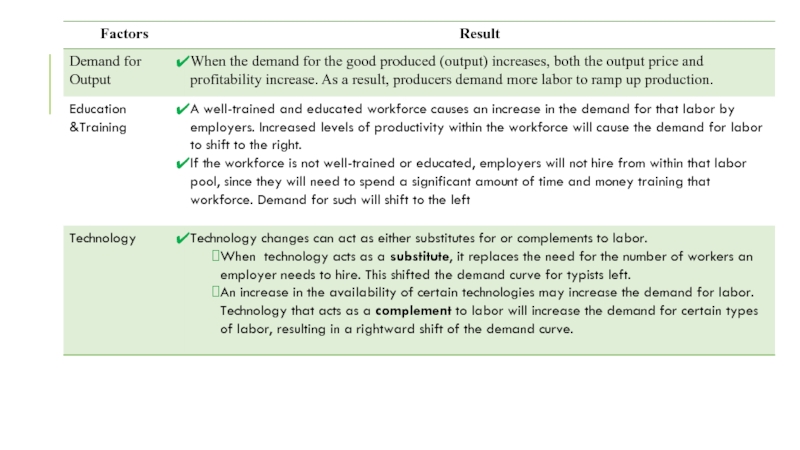
Слайд 6SHIFTS IN DEMAND
The demand curve for labor shows the quantity of
Shifts in the demand curve for labor occur for many reasons. One key reason is that the demand for labor is based on the demand for the good or service that is being produced. Therefore the demand for labor is called a “DERIVED DEMAND.”
Here are some examples of derived demand for labor:
The demand for chefs is dependent on the demand for restaurant meals.
The demand for pharmacists is dependent on the demand for prescription drugs.
The demand for attorneys is dependent on the demand for legal services.
Demand for Output
Education &Training
Technology
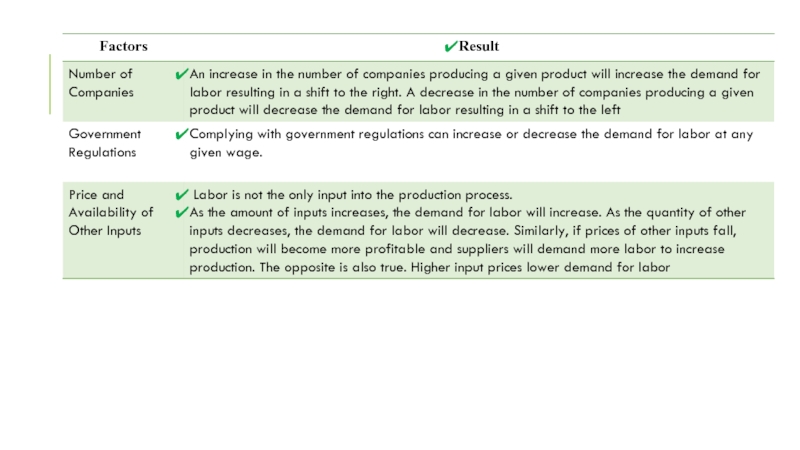
Number of Companies
Government Regulations
Price and Availability of Other Inputs

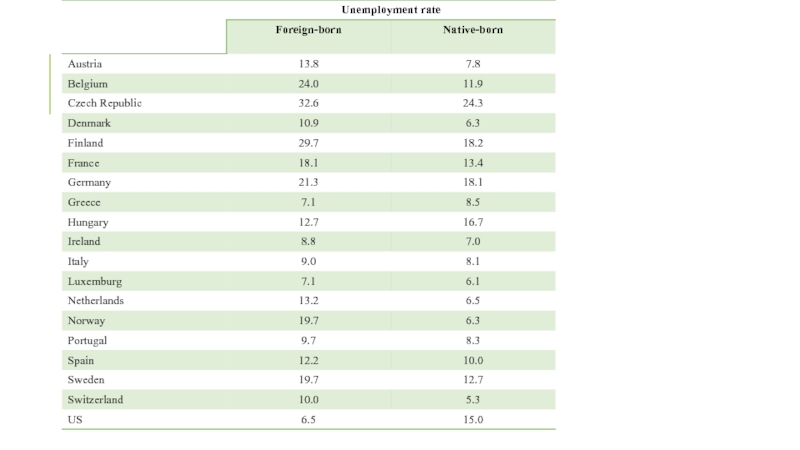
Слайд 9THE LOW-SKILLED LABOR MARKET
The definition of “low-skilled” can be based either
The Organization for Economic Cooperation and Development (OECD), for example, defines low-skilled on the basis of the person (and their education level) rather than on the basis of the job.
Interestingly, about 60% of migrants in low-skilled jobs come from non-EU countries: roughly 1.2 million people.
The latest UK Office for National Statistics (ONS) migration figures showed that of the 230,000 EU citizens estimated to have arrived in the UK in the year ending March 2017, 112,000 had a definite job, while another 47,000 were looking for work. (Others were coming to study or to join other family members.)
ONS data for 2015 estimates that the most popular industry for EU workers overall is "households as employers" (nannies and au pairs to you and me), in which they make up about 16% of the workforce.
Next comes accommodation and food (roughly 13%), followed by administration and manufacturing (10%), transport (8%) and construction (7%).
But these figures refer to very broad sectors of the economy. In some specific jobs - such as waiters or fruit pickers - the numbers will be far higher


Слайд 12TECHNOLOGY AND WAGE INEQUALITY:
THE FOUR-STEP PROCESS
Economic events can change the
From the perspective of employers who demand labor, these new technologies are often a substitute for low-skill laborers like file clerks who used to keep file cabinets full of paper records of transactions.
However, the same new technologies are a complement to high-skill workers like managers, who benefit from the technological advances by being able to monitor more information, communicate more easily, and juggle a wider array of responsibilities.
")
Слайд 13Step 1. What did the markets for low-skill labor and high-skill
Step 2. Does the new technology affect the supply of labor from households or the demand for labor from firms? The technology change described here affects demand for labor by firms that hire workers.
Step 3. Will the new technology increase or decrease demand? Based on the description earlier, as the substitute for low-skill labor becomes available, demand for low-skill labor will shift to the left, from D0 to D1. As the technology complement for high-skill labor becomes cheaper, demand for high-skill labor will shift to the right, from D0 to D1.
Step 4. The new equilibrium for low-skill labor, shown as point E1 with price W1 and quantity Q1, has a lower wage and quantity hired than the original equilibrium, E0. The new equilibrium for high-skill labor, shown as point E1 with price W1 and quantity Q1, has a higher wage and quantity hired than the original equilibrium (E0).

Слайд 14PRICE FLOORS IN THE LABOR MARKET: LIVING WAGES AND MINIMUM WAGES
In
The labor market, however, presents some prominent examples of price floors, which are often used as an attempt to increase the wages of low-paid workers.
MINIMUM WAGE – a price floor that makes it illegal for an employer to pay employees less than a certain hourly rate.
In public policy, a living wage is the minimum income necessary for a worker to meet their basic needs
Promoters of living wage laws maintain that the minimum wage is too low to ensure a reasonable standard of living.
They base this conclusion on the calculation that, if you work 40 hours a week at a minimum wage of $7.25 per hour for 50 weeks a year, your annual income is $14,500, which is less than the official U.S. government definition of what it means for a family to be in poverty.
(A family with two adults earning minimum wage and two young children will find it more cost efficient for one parent to provide childcare while the other works for income. So the family income would be $14,500, which is significantly lower than the federal poverty line for a family of four, which was $23,850 in 2014.)

Слайд 15DEMAND AND SUPPLY IN FINANCIAL MARKETS
Who Demands and Who Supplies in
In any market, the price is what suppliers receive and what demanders pay. In financial markets, those who supply financial capital through saving expect to receive a rate of return, while those who demand financial capital by receiving funds expect to pay a rate of return.
This rate of return can come in a variety of forms, depending on the type of investment. The simplest example of a rate of return is the interest rate.
For example, when you supply money into a savings account at a bank, you receive interest on your deposit. The interest paid to you as a percent of your deposits is the interest rate. Similarly, if you demand a loan to buy a car or a computer, you will need to pay interest on the money you borrow.

Слайд 16SHIFTS IN DEMAND AND SUPPLY IN FINANCIAL MARKETS
Participants in financial markets
Most workers save for retirement because their income in the present is greater than their needs, while the opposite will be true once they retire. So they save today and supply financial markets. If their income increases, they save more. If their perceived situation in the future changes, they change the amount of their saving.
So when consumers and businesses have greater confidence that they will be able to repay in the future, the quantity demanded of financial capital at any given interest rate will shift to the right.
For example, in the technology boom of the late 1990s, many businesses became extremely confident that investments in new technology would have a high rate of return, and their demand for financial capital shifted to the right. Conversely, during the Great Recession of 2008 and 2009, their demand for financial capital at any given interest rate shifted to the left.

Слайд 17PRICE CEILINGS IN FINANCIAL
MARKETS: USURY LAWS
Many states do have usury
For example, if the interest rate is not allowed to rise above 30% per year, it can still fluctuate below that level according to market forces. A price ceiling that is set at a relatively high level is nonbinding, and it will have no practical effect unless the equilibrium price soars high enough to exceed the price ceiling.
The demand and supply model predicts that at the lower price ceiling interest rate, the quantity demanded of credit card debt will increase from its original level of Q0 to Qd; however, the quantity supplied of credit card debt will decrease from the original Q0 to Qs.
At the price ceiling (Rc), quantity demanded will exceed quantity supplied. Consequently, a number of people who want to have credit cards and are willing to pay the prevailing interest rate will find that companies are unwilling to issue cards to them. The result will be a credit shortage.

Слайд 18SUMMARY
In the labor market, households are on the supply side of
In the demand and supply analysis of financial markets, the “price” is the rate of return or the interest rate received. The quantity is measured by the money that flows from those who supply financial capital to those who demand it. Two factors can shift the supply of financial capital to a certain investment: if people want to alter their existing levels of consumption, and if the riskiness or return on one investment changes relative to other investments. Factors that can shift demand for capital include business confidence and consumer confidence in the future—since financial investments received in the present are typically repaid in the future.
The market price system provides a highly efficient mechanism for disseminating information about relative scarcities of goods, services, labor, and financial capital. Market participants do not need to know why prices have changed, only that the changes require them to revisit previous decisions they made about supply and demand. Price controls hide information about the true scarcity of products and thereby cause misallocation of resources.