Terms of Use: These slides are provided under Creative Commons License Attribution—Share Alike 3.0 . You are free to use these slides as a resource for your economics classes together with whatever textbook you are using. If you like the slides, you may also want to take a look at my textbook, Introduction to Economics, from BVT Publishing.
- Главная
- Разное
- Дизайн
- Бизнес и предпринимательство
- Аналитика
- Образование
- Развлечения
- Красота и здоровье
- Финансы
- Государство
- Путешествия
- Спорт
- Недвижимость
- Армия
- Графика
- Культурология
- Еда и кулинария
- Лингвистика
- Английский язык
- Астрономия
- Алгебра
- Биология
- География
- Детские презентации
- Информатика
- История
- Литература
- Маркетинг
- Математика
- Медицина
- Менеджмент
- Музыка
- МХК
- Немецкий язык
- ОБЖ
- Обществознание
- Окружающий мир
- Педагогика
- Русский язык
- Технология
- Физика
- Философия
- Химия
- Шаблоны, картинки для презентаций
- Экология
- Экономика
- Юриспруденция
Economics for your Classroom fromEd Dolan’s Econ BlogIs Government Debt Out of Control?A Tutorial on Debt Dynamicsand SustainabilityPosted November 30, 2015 презентация
Содержание
- 1. Economics for your Classroom fromEd Dolan’s Econ BlogIs Government Debt Out of Control?A Tutorial on Debt Dynamicsand SustainabilityPosted November 30, 2015
- 2. Is the Debt Out of Control? Many
- 3. First: What to Measure? To determine whether
- 4. Debt vs. Deficit The government debt is
- 5. Next: Adjusting for the Business Cycle Next,
- 6. Automatic Stabilizers Automatic stabilizers are line items
- 7. Current vs. Structural Budget Balance The current
- 8. The Primary Structural Balance The primary structural
- 9. US Budget Balances, 1990-2015 This figure shows
- 10. The Steady-State Primary Structural Balance Under any
- 11. Example 1 DEBT = 0.5 INT =
- 12. Example 1: Interpretation In Example 1, the
- 13. Example 2 DEBT = 0.5 INT =
- 14. Example 2: Interpretation In Example 2, the
- 15. Interest Rates vs. Growth Rates: What is
- 16. Interest vs. Growth Rates in the Inflationary
- 17. Could Low Interest Rates be the “New
- 18. Is the US Federal Deficit Currently Sustainable?
- 19. Will the Debt Continue to be Sustainable?
- 20. The Bottom Line As of 2015,
- 21. Click here to learn more about Ed
Слайд 1Economics for your Classroom from Ed Dolan’s Econ Blog Is Government Debt Out
Слайд 2Is the Debt Out of Control?
Many people fear that government debt
Is that fear realistic?
This tutorial explains what determines how fast the debt grows and whether its growth is sustainable
NJ Gov Chris Christie: “Are you concerned like I am that the debt and deficits of Washington, D.C., are endangering America's future?”
Fla. Sen. Marco Rubio: “The time to act is now. The time to turn the page is now. If we don't act now, we are going to be the first generation in American history that leaves our children worse off than ourselves.”
Fmr. Ark. Gov Mike Huckabee: “I do not want to walk my five grandkids through the charred remains of a once great country called America and say, ‘Here you go, $20 trillion dollars of debt. Good luck making something out of this mess’ ”
—all quotes from Republican presidential debate, Oct. 29, 2015
http://www.cnbc.com/2015/10/29/cnbc-full-transcript-cnbcs-your-money-your-vote-the-republican-presidential-debate-part-2.html
November 30, 2015 Ed Dolan’s Econ Blog
Слайд 3First: What to Measure?
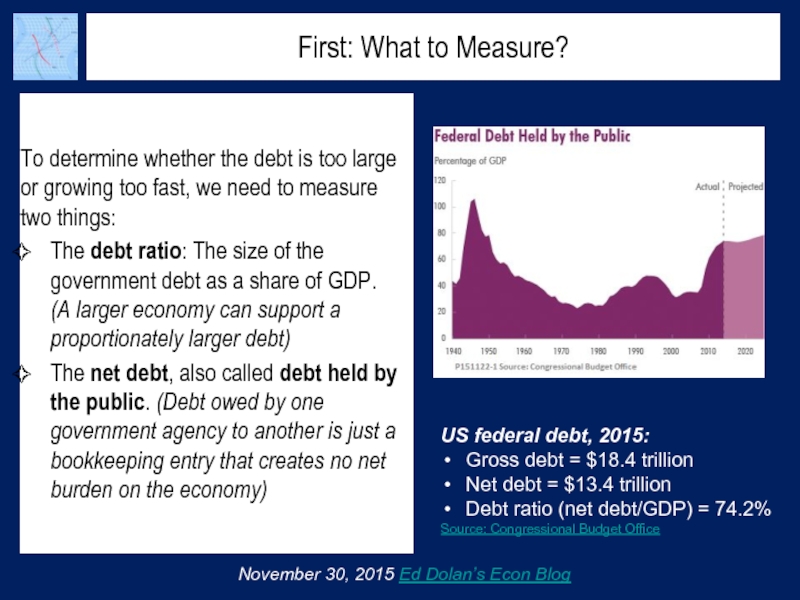
To determine whether the debt is too large
The debt ratio: The size of the government debt as a share of GDP. (A larger economy can support a proportionately larger debt)
The net debt, also called debt held by the public. (Debt owed by one government agency to another is just a bookkeeping entry that creates no net burden on the economy)
November 30, 2015 Ed Dolan’s Econ Blog
US federal debt, 2015:
Gross debt = $18.4 trillion
Net debt = $13.4 trillion
Debt ratio (net debt/GDP) = 74.2%
Source: Congressional Budget Office
Слайд 4Debt vs. Deficit
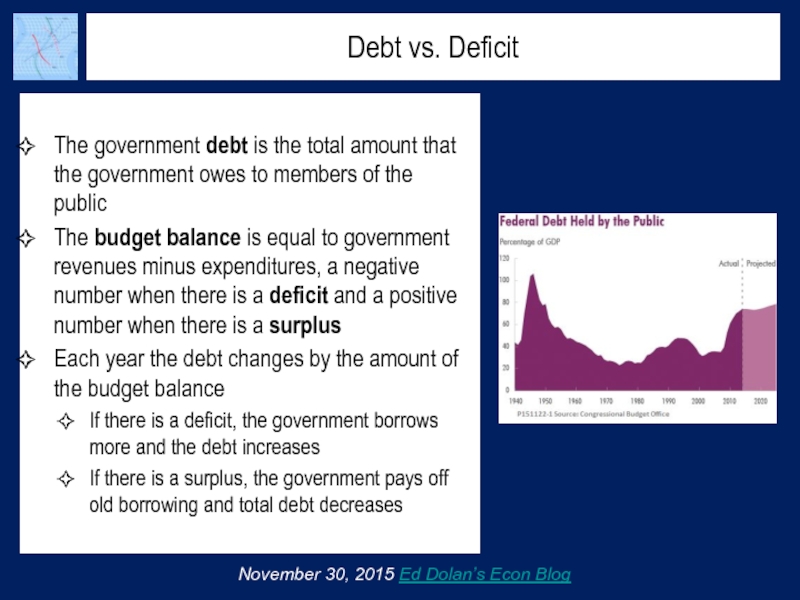
The government debt is the total amount that the
The budget balance is equal to government revenues minus expenditures, a negative number when there is a deficit and a positive number when there is a surplus
Each year the debt changes by the amount of the budget balance
If there is a deficit, the government borrows more and the debt increases
If there is a surplus, the government pays off old borrowing and total debt decreases
November 30, 2015 Ed Dolan’s Econ Blog
Слайд 5Next: Adjusting for the Business Cycle
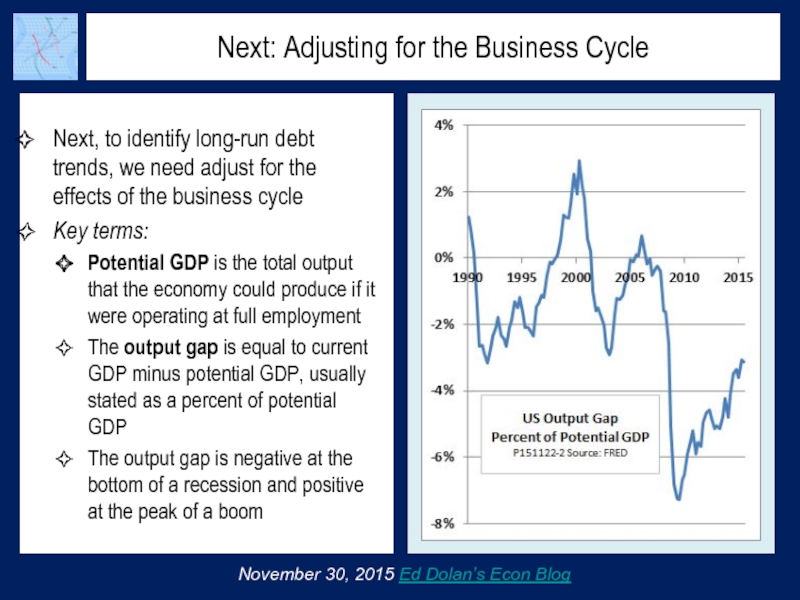
Next, to identify long-run debt trends,
Key terms:
Potential GDP is the total output that the economy could produce if it were operating at full employment
The output gap is equal to current GDP minus potential GDP, usually stated as a percent of potential GDP
The output gap is negative at the bottom of a recession and positive at the peak of a boom
November 30, 2015 Ed Dolan’s Econ Blog
Слайд 6Automatic Stabilizers
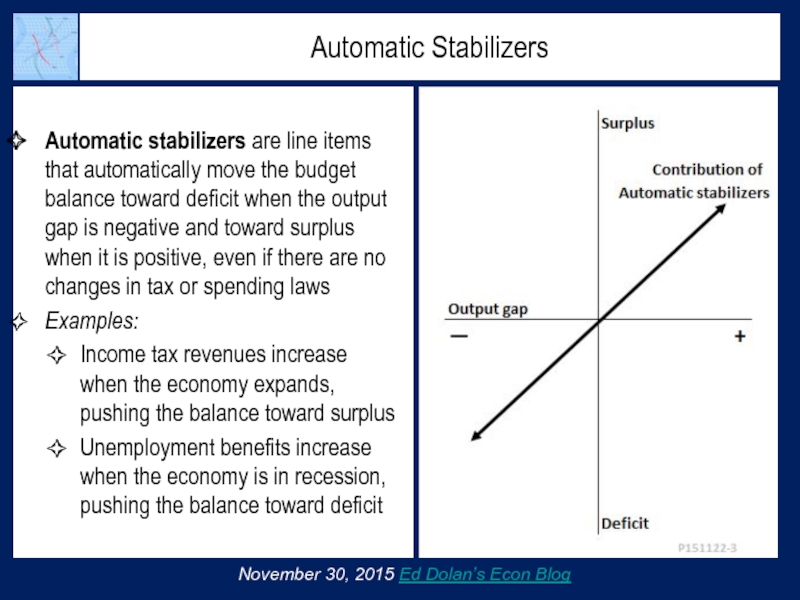
Automatic stabilizers are line items that automatically move the budget
Examples:
Income tax revenues increase when the economy expands, pushing the balance toward surplus
Unemployment benefits increase when the economy is in recession, pushing the balance toward deficit
November 30, 2015 Ed Dolan’s Econ Blog
Слайд 7Current vs. Structural Budget Balance
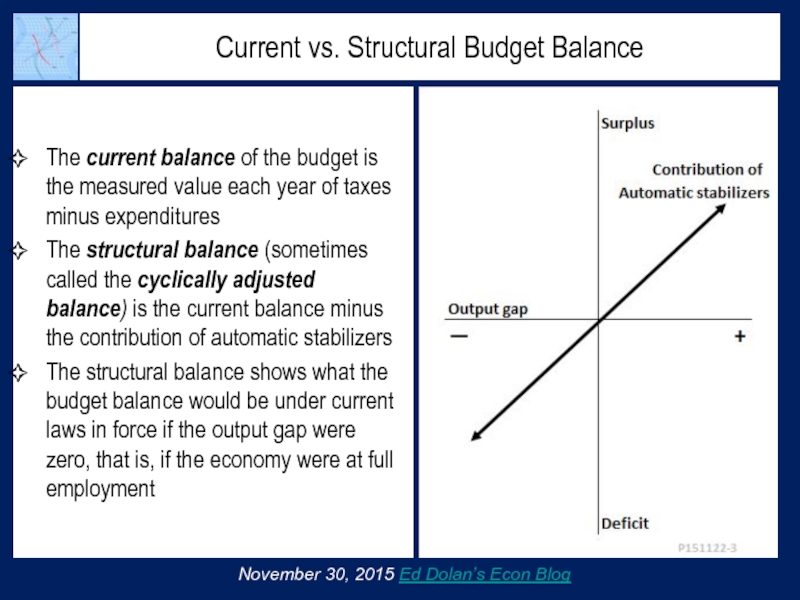
The current balance of the budget is
The structural balance (sometimes called the cyclically adjusted balance) is the current balance minus the contribution of automatic stabilizers
The structural balance shows what the budget balance would be under current laws in force if the output gap were zero, that is, if the economy were at full employment
November 30, 2015 Ed Dolan’s Econ Blog
Слайд 8The Primary Structural Balance
The primary structural balance (PSB) is equal to
As we will see, the PSB is a key indicator of long-run debt trends
November 30, 2015 Ed Dolan’s Econ Blog
Example 1 (all numbers are percent of potential GDP):
Structural balance = -5%
Interest payments = 2%
Primary structural balance = -3%
Both the primary structural balance and overall structural balance are in deficit
Example 2:
Structural balance = -1.5%
Interest payments = 2%
PSB = +0.5%
The overall structural balance is in deficit but the PSB is in surplus
Слайд 9US Budget Balances, 1990-2015
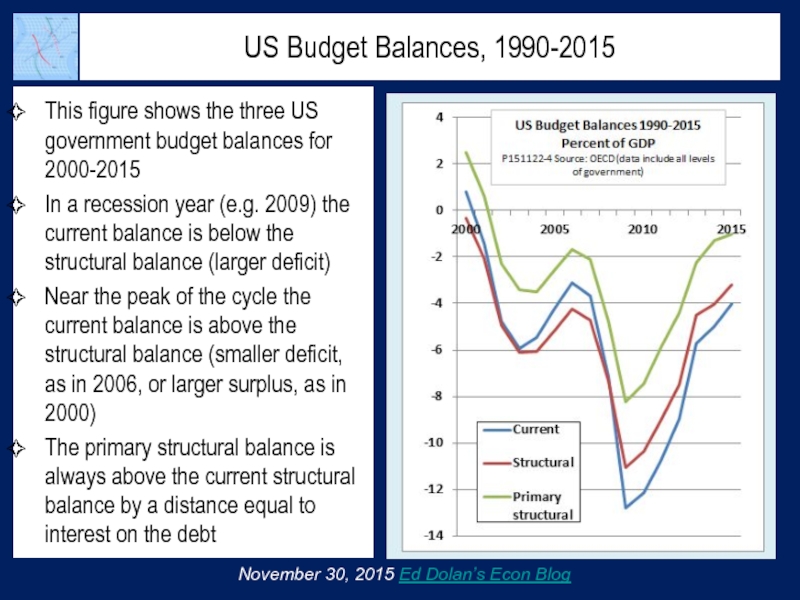
This figure shows the three US government budget
In a recession year (e.g. 2009) the current balance is below the structural balance (larger deficit)
Near the peak of the cycle the current balance is above the structural balance (smaller deficit, as in 2006, or larger surplus, as in 2000)
The primary structural balance is always above the current structural balance by a distance equal to interest on the debt
November 30, 2015 Ed Dolan’s Econ Blog
Слайд 10The Steady-State Primary Structural Balance
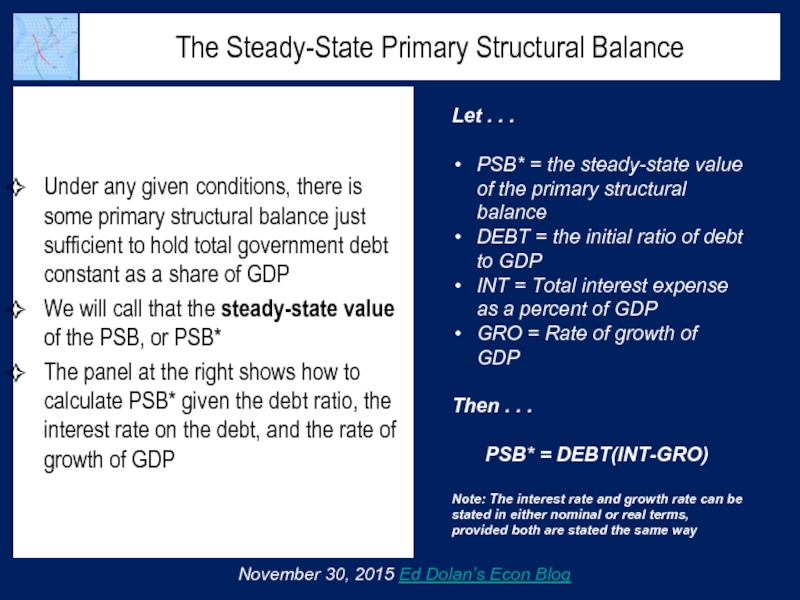
Under any given conditions, there is some
We will call that the steady-state value of the PSB, or PSB*
The panel at the right shows how to calculate PSB* given the debt ratio, the interest rate on the debt, and the rate of growth of GDP
November 30, 2015 Ed Dolan’s Econ Blog
Let . . .
PSB* = the steady-state value of the primary structural balance
DEBT = the initial ratio of debt to GDP
INT = Total interest expense as a percent of GDP
GRO = Rate of growth of GDP
Then . . .
PSB* = DEBT(INT-GRO)
Note: The interest rate and growth rate can be stated in either nominal or real terms, provided both are stated the same way
Слайд 11Example 1
DEBT = 0.5
INT = 0.04
GRO = 0.02
PSB* = 0.5(0.04-0.02) =
November 30, 2015 Ed Dolan’s Econ Blog
Example 1: The Math
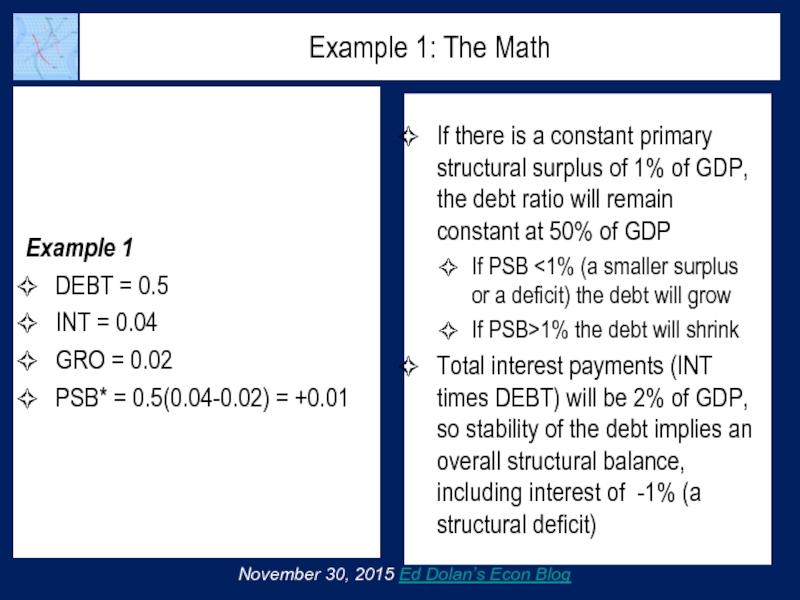
If there is a constant primary structural surplus of 1% of GDP, the debt ratio will remain constant at 50% of GDP
If PSB <1% (a smaller surplus or a deficit) the debt will grow
If PSB>1% the debt will shrink
Total interest payments (INT times DEBT) will be 2% of GDP, so stability of the debt implies an overall structural balance, including interest of -1% (a structural deficit)
Слайд 12Example 1: Interpretation
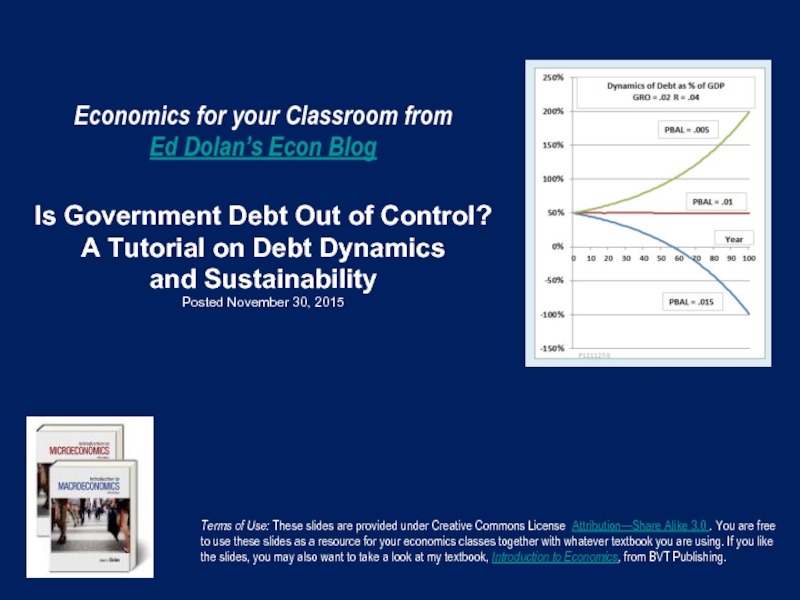
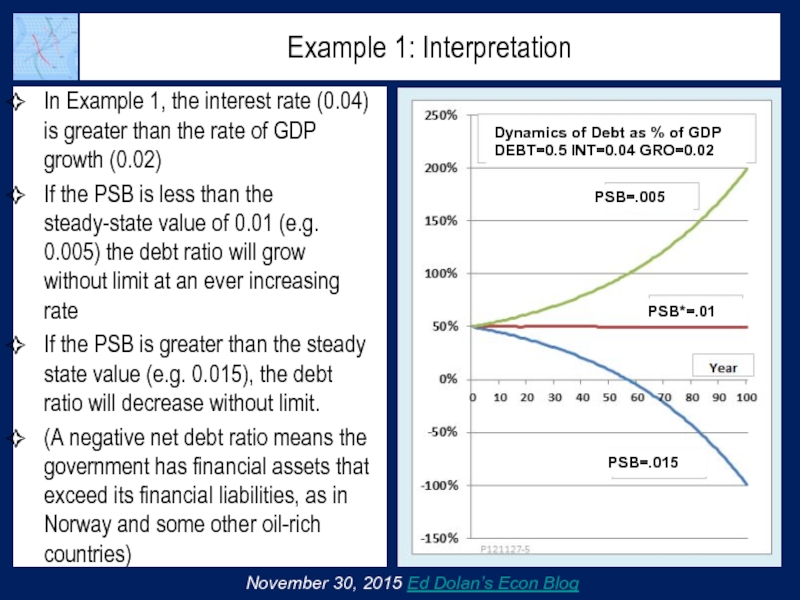
In Example 1, the interest rate (0.04) is greater
If the PSB is less than the steady-state value of 0.01 (e.g. 0.005) the debt ratio will grow without limit at an ever increasing rate
If the PSB is greater than the steady state value (e.g. 0.015), the debt ratio will decrease without limit.
(A negative net debt ratio means the government has financial assets that exceed its financial liabilities, as in Norway and some other oil-rich countries)
PSB=.005
PSB*=.01
PSB=.015
Dynamics of Debt as % of GDP
DEBT=0.5 INT=0.04 GRO=0.02
November 30, 2015 Ed Dolan’s Econ Blog
Слайд 13Example 2
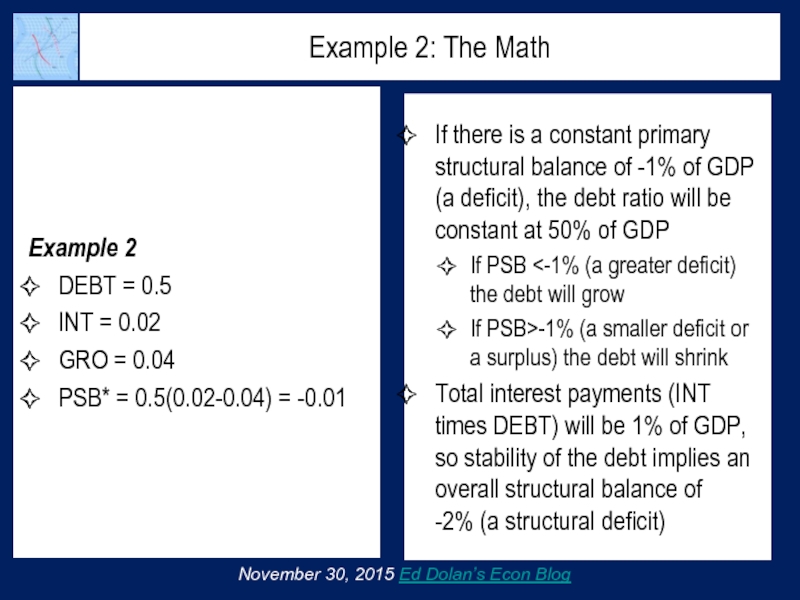
DEBT = 0.5
INT = 0.02
GRO = 0.04
PSB* = 0.5(0.02-0.04) =
November 30, 2015 Ed Dolan’s Econ Blog
Example 2: The Math
If there is a constant primary structural balance of -1% of GDP (a deficit), the debt ratio will be constant at 50% of GDP
If PSB <-1% (a greater deficit) the debt will grow
If PSB>-1% (a smaller deficit or a surplus) the debt will shrink
Total interest payments (INT times DEBT) will be 1% of GDP, so stability of the debt implies an overall structural balance of -2% (a structural deficit)
Слайд 14Example 2: Interpretation
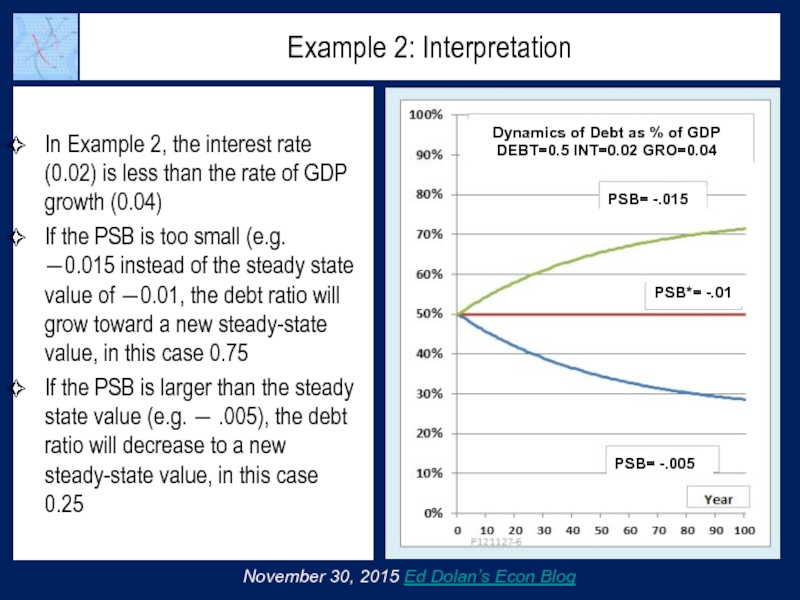
In Example 2, the interest rate (0.02) is less
If the PSB is too small (e.g. ―0.015 instead of the steady state value of ―0.01, the debt ratio will grow toward a new steady-state value, in this case 0.75
If the PSB is larger than the steady state value (e.g. ― .005), the debt ratio will decrease to a new steady-state value, in this case 0.25
PSB= -.015
PSB*= -.01
PSB= -.005
Dynamics of Debt as % of GDP
DEBT=0.5 INT=0.02 GRO=0.04
November 30, 2015 Ed Dolan’s Econ Blog
Слайд 15Interest Rates vs. Growth Rates: What is “Normal”?
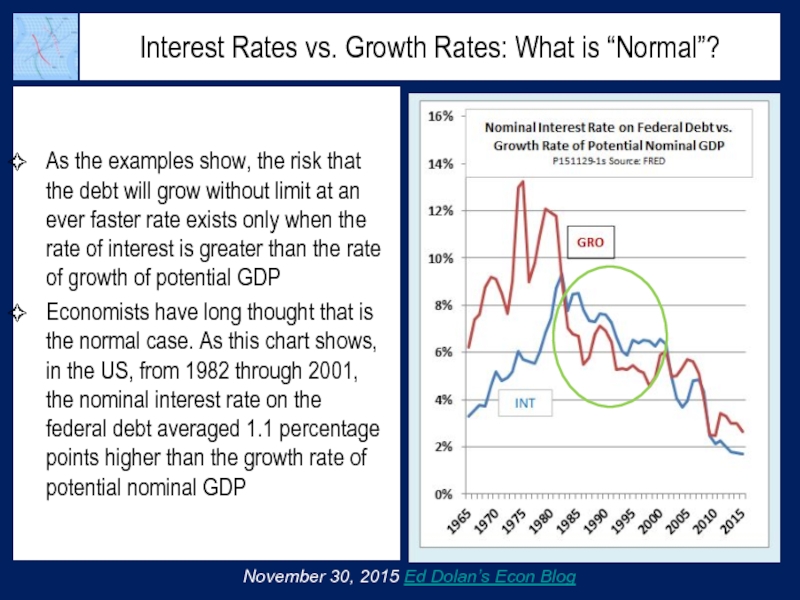
As the examples show,
Economists have long thought that is the normal case. As this chart shows, in the US, from 1982 through 2001, the nominal interest rate on the federal debt averaged 1.1 percentage points higher than the growth rate of potential nominal GDP
November 30, 2015 Ed Dolan’s Econ Blog
Слайд 16Interest vs. Growth Rates in the Inflationary 60s and 70s
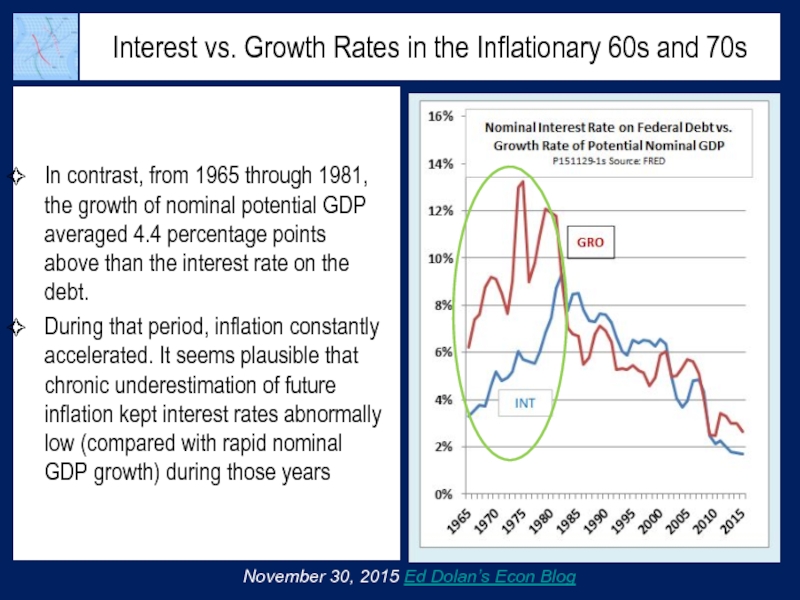
In contrast,
During that period, inflation constantly accelerated. It seems plausible that chronic underestimation of future inflation kept interest rates abnormally low (compared with rapid nominal GDP growth) during those years
November 30, 2015 Ed Dolan’s Econ Blog
Слайд 17Could Low Interest Rates be the “New Normal?”
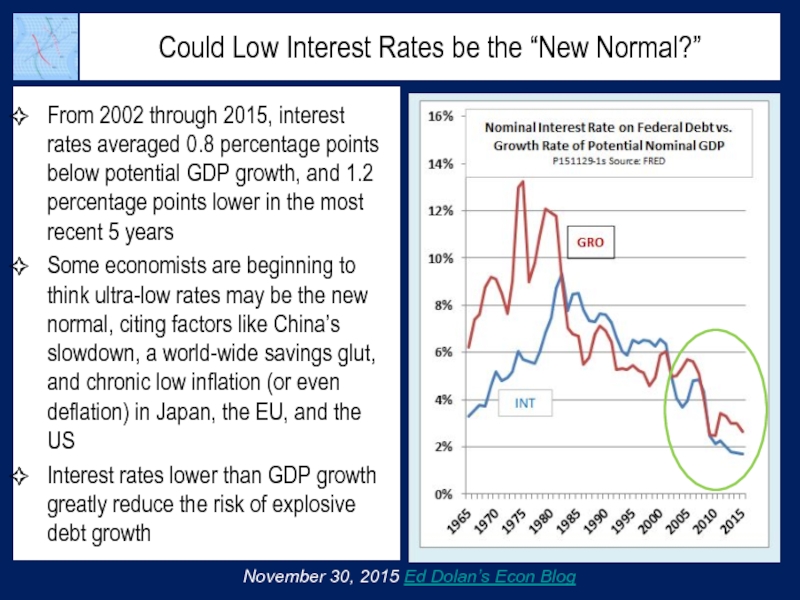
From 2002 through 2015,
Some economists are beginning to think ultra-low rates may be the new normal, citing factors like China’s slowdown, a world-wide savings glut, and chronic low inflation (or even deflation) in Japan, the EU, and the US
Interest rates lower than GDP growth greatly reduce the risk of explosive debt growth
November 30, 2015 Ed Dolan’s Econ Blog
Слайд 18Is the US Federal Deficit Currently Sustainable?
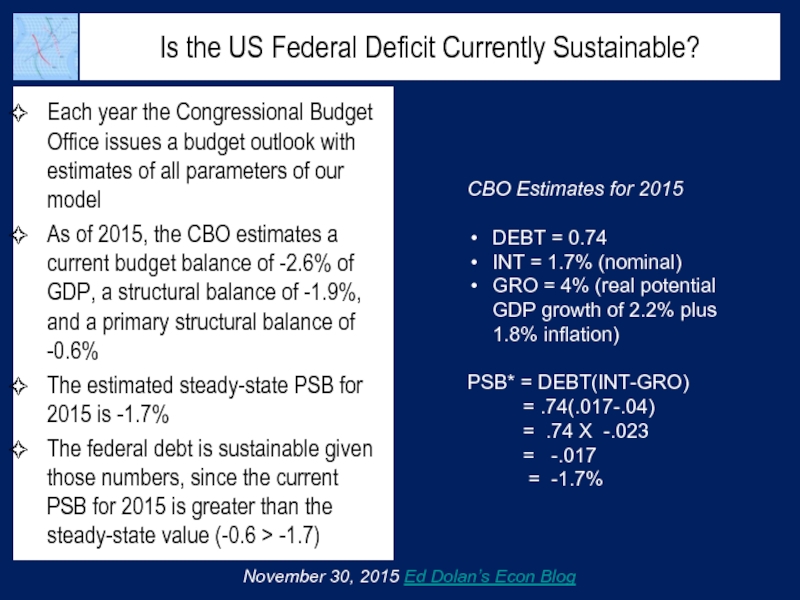
Each year the Congressional Budget
As of 2015, the CBO estimates a current budget balance of -2.6% of GDP, a structural balance of -1.9%, and a primary structural balance of -0.6%
The estimated steady-state PSB for 2015 is -1.7%
The federal debt is sustainable given those numbers, since the current PSB for 2015 is greater than the steady-state value (-0.6 > -1.7)
November 30, 2015 Ed Dolan’s Econ Blog
CBO Estimates for 2015
DEBT = 0.74
INT = 1.7% (nominal)
GRO = 4% (real potential GDP growth of 2.2% plus 1.8% inflation)
PSB* = DEBT(INT-GRO)
= .74(.017-.04)
= .74 X -.023
= -.017
= -1.7%
Слайд 19Will the Debt Continue to be Sustainable?
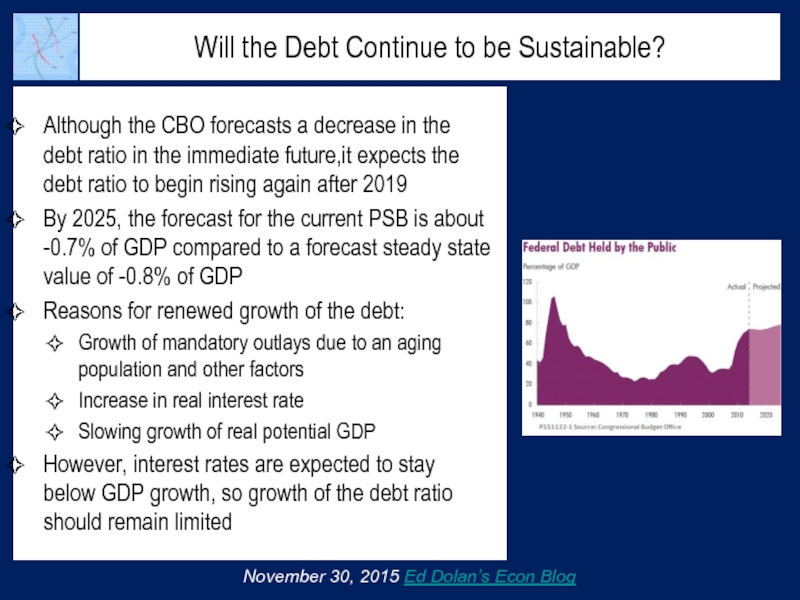
Although the CBO forecasts a
By 2025, the forecast for the current PSB is about -0.7% of GDP compared to a forecast steady state value of -0.8% of GDP
Reasons for renewed growth of the debt:
Growth of mandatory outlays due to an aging population and other factors
Increase in real interest rate
Slowing growth of real potential GDP
However, interest rates are expected to stay below GDP growth, so growth of the debt ratio should remain limited
November 30, 2015 Ed Dolan’s Econ Blog
Слайд 20The Bottom Line
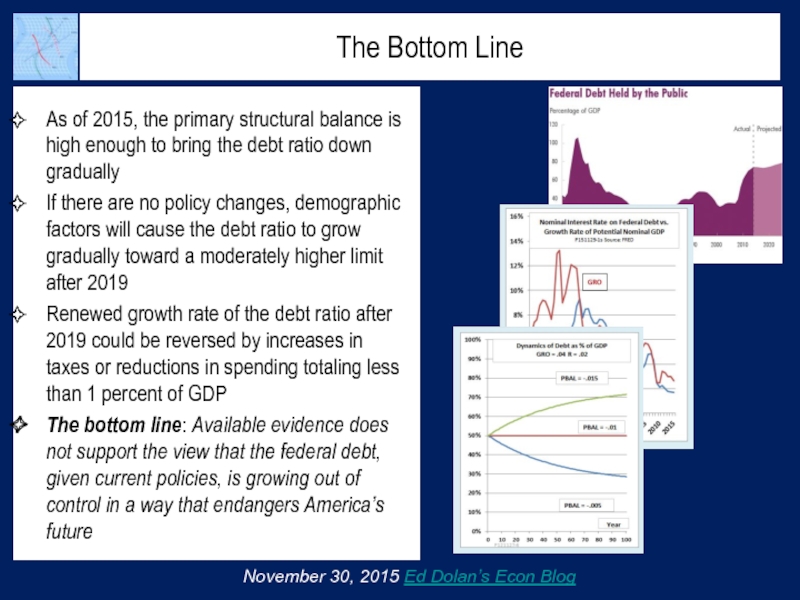
As of 2015, the primary structural balance is high
If there are no policy changes, demographic factors will cause the debt ratio to grow gradually toward a moderately higher limit after 2019
Renewed growth rate of the debt ratio after 2019 could be reversed by increases in taxes or reductions in spending totaling less than 1 percent of GDP
The bottom line: Available evidence does not support the view that the federal debt, given current policies, is growing out of control in a way that endangers America’s future
November 30, 2015 Ed Dolan’s Econ Blog
Слайд 21Click here to learn more about Ed Dolan’s Econ texts
or
For more slideshows, follow Ed Dolan’s Econ Blog
Follow @DolanEcon on Twitter
