- Главная
- Разное
- Дизайн
- Бизнес и предпринимательство
- Аналитика
- Образование
- Развлечения
- Красота и здоровье
- Финансы
- Государство
- Путешествия
- Спорт
- Недвижимость
- Армия
- Графика
- Культурология
- Еда и кулинария
- Лингвистика
- Английский язык
- Астрономия
- Алгебра
- Биология
- География
- Детские презентации
- Информатика
- История
- Литература
- Маркетинг
- Математика
- Медицина
- Менеджмент
- Музыка
- МХК
- Немецкий язык
- ОБЖ
- Обществознание
- Окружающий мир
- Педагогика
- Русский язык
- Технология
- Физика
- Философия
- Химия
- Шаблоны, картинки для презентаций
- Экология
- Экономика
- Юриспруденция
CAP and ROC curves презентация
Содержание
- 1. CAP and ROC curves
- 2. Cumulative Accuracy Profiles (CAP) We
- 3. CAP The CAP curve can then be
- 4. CAP If the model were totally uninformative,
- 6. CAP Accuracy ratio by CAP curve= (the
- 7. Operating Characteristic Curves (ROC) The
- 8. The ROC curve of a constant
- 10. ROC Accuracy ratio by ROC curve=2× (area under a model’s ROC curve-0.5)

Слайд 2Cumulative Accuracy Profiles (CAP)
We first rank companies by their
default probabilities (i.e., credit scores) as predicted by the model, from highest to lowest.
Then, out of those companies with a score higher than a value such that altogether they represent x% of the total number of companies, we record the corresponding number of defaulted companies being captured as a percentage (y%) of total number of defaulted companies.
Then, out of those companies with a score higher than a value such that altogether they represent x% of the total number of companies, we record the corresponding number of defaulted companies being captured as a percentage (y%) of total number of defaulted companies.
 We first rank companies by their default probabilities (i.e., credit scores)")
Слайд 3CAP
The CAP curve can then be traced out by varying x
from 0 to 100 and plotting the corresponding values of x and y along and x-axis and y-axis respectively.
Using a good model will result in a majority of the defaulters having relatively high default probability estimates and so the percentage of defaulters being captured (the y values in Fig. 1) increases quickly as one moves down the sorted sample of all companies (the x values in Fig. 1).
Using a good model will result in a majority of the defaulters having relatively high default probability estimates and so the percentage of defaulters being captured (the y values in Fig. 1) increases quickly as one moves down the sorted sample of all companies (the x values in Fig. 1).

Слайд 4CAP
If the model were totally uninformative, for example, by assigning default
probabilities randomly, we would expect to capture a proportional fraction (i.e., x% of the defaulters with about x% of the observations), resulting in a CAP curve along the 45-degree line (i.e., the “Random CAP” curve of Fig. 1).

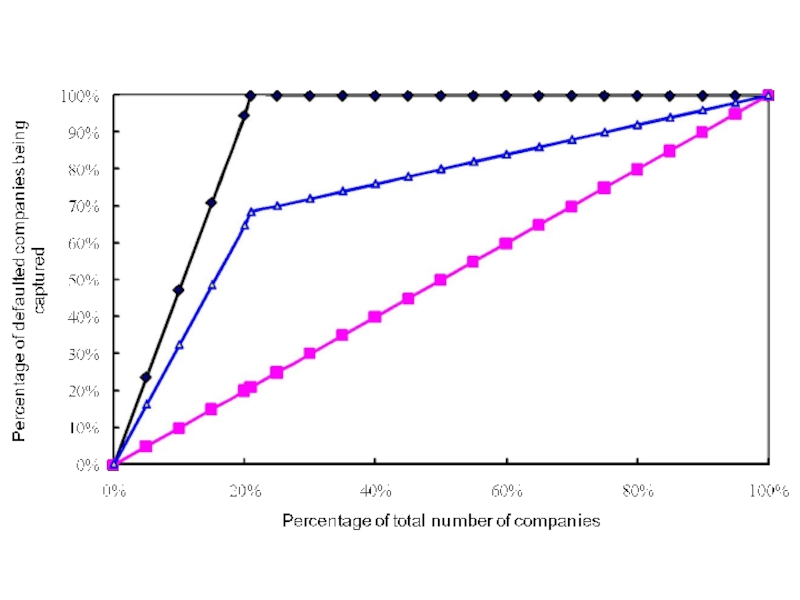
Слайд 6CAP
Accuracy ratio by CAP curve= (the area under a model’s CAP)/
(the area under the ideal CAP)
/ (the area under the")
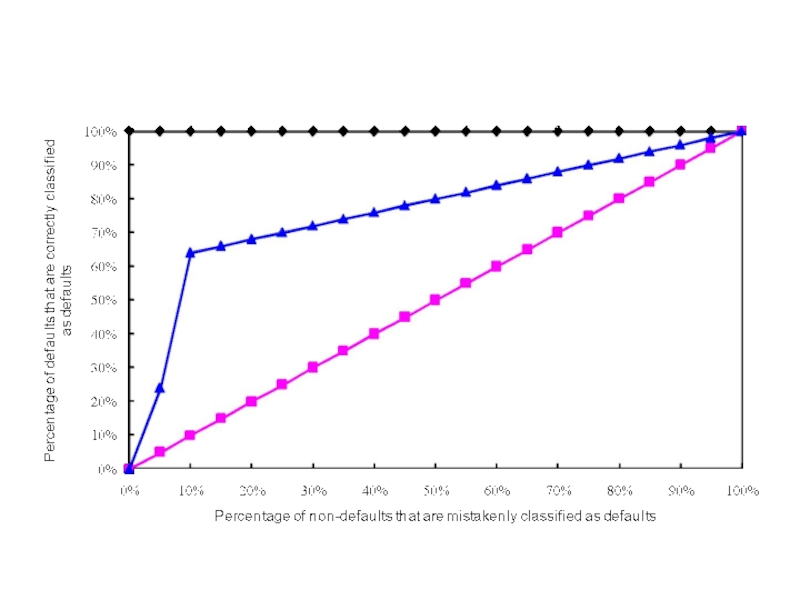
Слайд 7Operating Characteristic Curves (ROC)
The ROC curve is constructed by
varying the cutoff probability.
In particular, for every cutoff probability, the ROC curve defines the “true positive rate” (percentage of defaults that the model correctly classifies as defaults) on the y-axis as a function of the corresponding “false positive rate” (percentage of non-defaults that are mistakenly classified as defaults) on the x-axis.
In particular, for every cutoff probability, the ROC curve defines the “true positive rate” (percentage of defaults that the model correctly classifies as defaults) on the y-axis as a function of the corresponding “false positive rate” (percentage of non-defaults that are mistakenly classified as defaults) on the x-axis.
 The ROC curve is constructed by varying the cutoff probability. In")
Слайд 8
The ROC curve of a constant or entirely random prediction model
corresponds to the 45-degree line, whereas a perfect model will have a ROC curve that goes straight up from (0, 0) to (0, 1) and then across to (1, 1).

")