- Главная
- Разное
- Дизайн
- Бизнес и предпринимательство
- Аналитика
- Образование
- Развлечения
- Красота и здоровье
- Финансы
- Государство
- Путешествия
- Спорт
- Недвижимость
- Армия
- Графика
- Культурология
- Еда и кулинария
- Лингвистика
- Английский язык
- Астрономия
- Алгебра
- Биология
- География
- Детские презентации
- Информатика
- История
- Литература
- Маркетинг
- Математика
- Медицина
- Менеджмент
- Музыка
- МХК
- Немецкий язык
- ОБЖ
- Обществознание
- Окружающий мир
- Педагогика
- Русский язык
- Технология
- Физика
- Философия
- Химия
- Шаблоны, картинки для презентаций
- Экология
- Экономика
- Юриспруденция
Attitudes and Behavior презентация
Содержание
- 1. Attitudes and Behavior
- 2. “… attitude is probably the most distinctive
- 3. Why People Have Attitudes? Attitudes are necessary
- 4. Definition An attitude can be defined as
- 5. Types of attitudes Global attitudes Attitudes toward behavior
- 6. Attitude: Unidimensional Definition Attitude is a hypothetical,
- 7. Attitude vs. Beliefs Attitudes differ from beliefs.
- 8. Attitude vs. Beliefs If you think
- 9. Attitude vs. Affect Attitude: Evaluation of a
- 10. Tripartite Model of Attitude (Rosenberg & Hovland, 1960)
- 11. ABC model of attitudes Affective component:
- 12. Tripartite Model of Attitude (Rosenberg & Hovland, 1960)
- 13. Attitude Measurement
- 14. Direct Evaluations Examples of Single-Item Measures “Do
- 15. Single-Item Measures: Potential Problems Clerical
- 17. Effect of Mood: positive feeling state was
- 18. Direct Evaluations: Multi-Item Measures Repeated Evaluations With
- 19. Direct Attitude Assessment: Evaluative Semantic Differential
- 20. Semantic Differential: Rotated Factor Loadings (Osgood, Suci,
- 21. The semantic differential technique reveals information on three basic dimensions of attitudes:
- 22. The semantic differential technique reveals information on three basic dimensions of attitudes: evaluation
- 23. The semantic differential technique reveals information
- 24. The semantic differential technique reveals information
- 25. • Evaluation is concerned with whether a
- 26. Semantic Differential: Rotated Factor Loadings (Osgood, Suci,
- 27. Inferential Attitude Measures (Thurstone, Likert, Guttman Scaling)
- 28. Likert Scaling: Construct large number
- 29. Ideal Operating Characteristic Curves for Positive and Negative Likert Scale Items
- 30. Attitudes Toward Illegal Immigrants: Sample Items from
- 31. Attitudes and Behavior
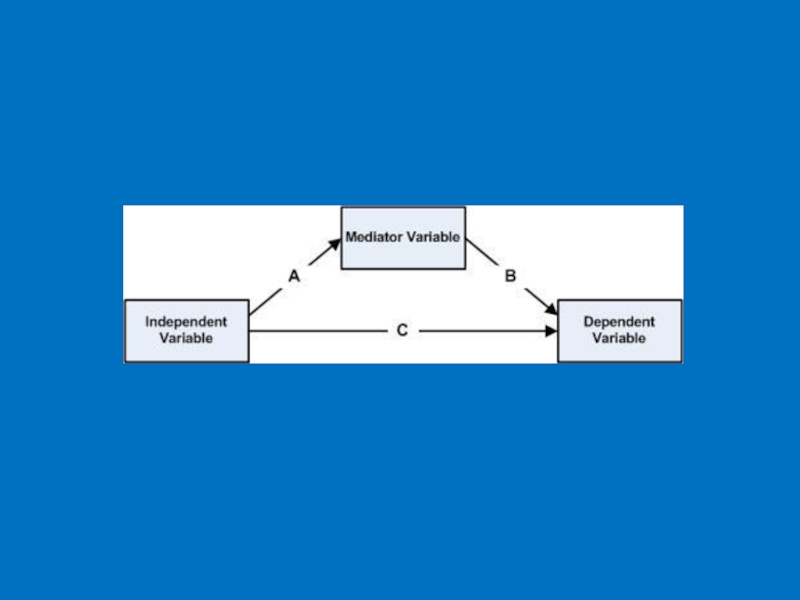
- 32. Validation of Attitude Measures: Predictive Validity Primary
- 34. Other Examples of Attitude-Behavior Relations Corey (1937)
- 35. Narrative Review of Over 50 Studies of
- 36. Wicker’s conclusions did not come as a
- 37. Explanation I: Inadequate Attitude Measurement Major
- 38. Prediction of 8 Behaviors from Attitude Toward
- 39. Explanation II: Other Additive Factors Behavior Personality
- 40. Explanation III: Moderating Variables Personality Self-monitoring (Snyder
- 45. Explanation III: Moderating Variables Personality Self-monitoring (Snyder
- 47. Effect of Confidence on Attitude-Behavior Correlation – Student Government (Warland & Sample, 1973)
- 48. Problems of Moderating Variables Approach 1. High
- 49. Problems of Moderating Variables Approach 1. High
- 51. Problems of Moderating Variables Approach 1. High
- 53. Response Biases Long before it became evident
- 54. The methods available to avoid social desirability
- 55. The significant factors formed by scales of Semantic Differential in answers of
- 56. Graphic representation of modalities on the two
- 57. Graphic representation of modalities on the two
- 58. Graphic representation of modalities on the two
- 59. Graphic representation of modalities on the two
- 60. Graphic representation of modalities on the two
- 61. The methods available to avoid social desirability
- 62. PREDICTING SINGLE BEHAVIORS Investigators are often interested
- 63. Principle of Compatibility A single behavior can
- 64. Principle of Compatibility For example, we may
- 65. Principle of Compatibility The principle of compatibility
- 66. PREDICTING SINGLE BEHAVIORS: Principle of Compatibility
- 67. Manstead, Proffitt, and Smart (1983) reported a
- 68. Many studies have examined the relation between
- 69. In a meta-analysis of 8 studies that
- 70. Intention and behaviour
- 71. Intentions as Predictors of Behavior The previous
- 72. Intentions as Predictors of Behavior Many studies
- 73. The respondents were asked the following
- 74. One year later, we re-interviewed by telephone
- 75. Low Intention–Behavior Relations However, notwithstanding these encouraging
- 76. Intention – Behavior Gap: 6 Studies in Health Domain (Sheeran, 2002)
- 77. Reasons for Failure to Carry Out Intention
- 78. Attitudes toward specific behaviors are good predictors
- 79. New models of relation between attitude
- 80. From General Attitudes to Specific Behaviors: Automatic
- 81. From General Attitudes to Specific Behaviors: Automatic
- 82. The MODE Model (Motivation and Opportunity as Determinants) – Fazio (1990)
- 83. Thus, automatic attitude activation occurs when
- 84. Studies that were designed to test directly
- 85. Fazio and Williams (1986) predicted voting choice
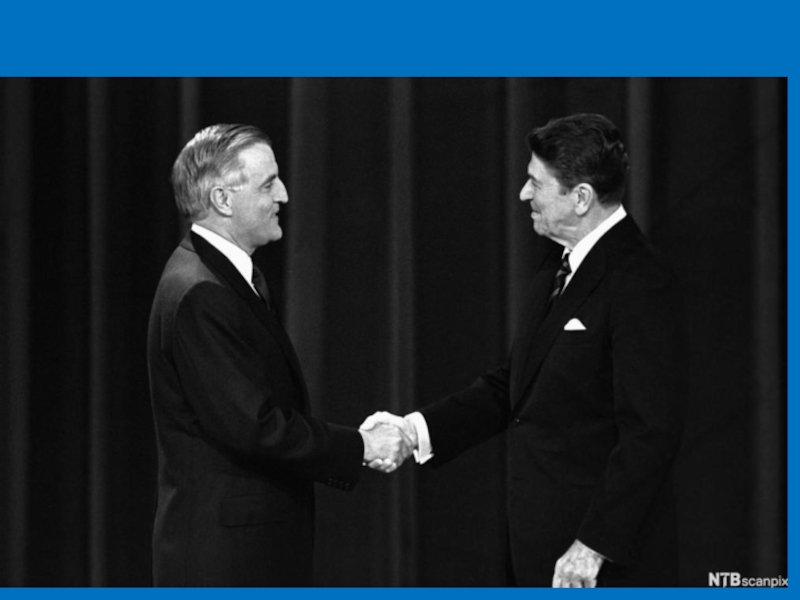
- 87. Ronald Reagan
- 88. Walter Mondale
- 89. A total of 245 voting age residents
- 90. Experiment The first five statements were intended
- 91. The answers of the participants of that
- 92. The next phase concerned judgments of the
- 93. The day after the second debate, subjects
- 94. Subjects were asked to endorse one of
- 97. The final phase of the investigation concerned
- 99. The Role of Attitude Strength: Two Possibilities
- 100. Stability of Intentions Perhaps more important, if
- 101. Stability of Intentions Instead of relying on
- 102. Stability of Intentions In one of these
- 103. Changes in Intentions Prior to Behavior (Sheeran,
- 104. Stability of Intentions For participants whose intentions

Слайд 2“… attitude is probably the most distinctive and indispensable concept in
“This … concept has been so widely adopted that it has virtually established itself as the keystone in the edifice of American social psychology.”
Centrality of the Attitude Construct
Gordon W. Allport (1968)

Слайд 3Why People Have Attitudes?
Attitudes are necessary and adaptive for humans.
They
Attitudes are mainly used to sort things into “good” and “bad” categories.

Слайд 4Definition
An attitude can be defined as a latent disposition or tendency


Слайд 6Attitude: Unidimensional Definition
Attitude is a hypothetical, latent construct. It is defined
The evaluative reaction can range from extremely negative to extremely positive, through the neutral point, on a dimension such as:
“good – bad” “pleasant – unpleasant “in favor – opposed”.
–
+

Слайд 7Attitude vs. Beliefs
Attitudes differ from beliefs.
Beliefs are pieces of information
Attitudes are different evaluations toward some object or issue (e.g., you like or dislike something, you are in favor of or opposed to some position).
 about")
Слайд 8Attitude vs. Beliefs
If you think that a certain person is president
Whether you like this person as president, or the clouds, is your attitude.
Logically, attitudes are for choosing, whereas beliefs are for explaining.
Beliefs and attitudes both serve interpersonal functions. People need to influence how others choose, and people also need to explain things to others.

Слайд 9Attitude vs. Affect
Attitude: Evaluation of a psychological object.
Affect: Somatic system

")
Слайд 11ABC model of attitudes
Affective component: this involves a person’s feelings /
Behavioral (or conative) component: the way the attitude we have influences how we act or behave. For example: “I will avoid spiders and scream if I see one”.
Cognitive component: this involves a person’s belief / knowledge about an attitude object. For example: “I believe spiders are dangerous”.

")

Слайд 14Direct Evaluations
Examples of Single-Item Measures
“Do you approve of the way the
____ Approve very much ____ Disapprove
____ Approve ____ Disapprove very much
“Were the tasks interesting and enjoyable? . . . Would you rate how you feel about them on a scale from –5 to +5, where –5 means they were extremely dull and boring, +5 means they were extremely interesting and enjoyable, and zero means they were neutral, neither interesting nor uninteresting.” (Festinger & Carlsmith, 1959)
“My attitude toward being religious is” (Fishbein & Ajzen, 1974)
extremely extremely
unfavorable :___:___:___:___:___:___:___:___:___:___:___: favorable
“I have high self-esteem” (Robins et al., 2001)
Not very true of me :____:____:____:____:____:____:____: Very true of me

Слайд 15Single-Item Measures: Potential Problems
Clerical errors in responding or coding
Momentary distraction
In phone
Item wording
Momentary mood

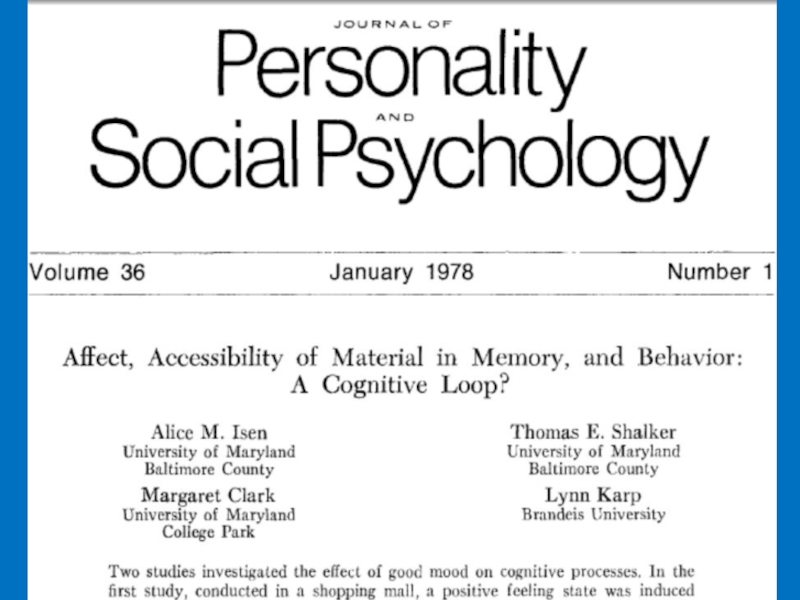
Слайд 17Effect of Mood: positive feeling state was induced by giving subjects

Слайд 18Direct Evaluations: Multi-Item Measures
Repeated Evaluations With Variations
Rosenberg (1965) Self-Esteem Scale
1. I
_____ Strongly agree
_____ Agree
_____ Disagree
_____ Strongly disagree
2. I feel that I have a number of good qualities.
3. All in all, I am inclined to feel that I am a failure.
4. I am able to do things as well as most other people.
5. I feel I do not have much to be proud of.
6. I take a positive attitude toward myself.
7. In the whole, I am satisfied with myself.
8. I wish I could have more respect for myself.
9. I certainly feel useless at times.
10. At times I think I am no good at all.
 Self-Esteem Scale 1. I feel that I")
Слайд 19Direct Attitude Assessment:
Evaluative Semantic Differential
One of the options being considered
Making Abortion is
desirable :______:______:______:______:______:______:______: undesirable
productive :______:______:______:______:______:______:______: destructive
bad :______:______:______:______:______:______:______: good
harmful :______:______:______:______:______:______:______: beneficial
right :______:______:______:______:______:______:______: wrong
cautious :______:______:______:______:______:______:______: rash
inconsistent :______:______:______:______:______:______:______: consistent
ugly :______:______:______:______:______:______:______: beautiful
foolish :______:______:______:______:______:______:______: wise
timely :______:______:______:______:______:______:______: untimely
useful :______:______:______:______:______:______:______: useless
progressive :______:______:______:______:______:______:______: regressive

Слайд 20Semantic Differential: Rotated Factor Loadings
(Osgood, Suci, & Tannenbaum, 1957)
I
1. good-bad .88 .05 .09 .09
2. large-small .06 .62 .34 .04
3. beautiful-ugly .86 .09 .0l .26
4. yellow-blue -.33 -.14 .12 .17
5. hard-soft -.48 .55 .16 .21
6. sweet-sour .83 -.14 -.09 .02
7. strong-weak .19 .62 .20 -.03
8. clean-dirty .82 -.05 .03 .02
9. high-low .59 .21 .08 .04
10. calm-agitated .61 .00 -.36 -.05
11. tasty-distasteful .77 .05 -.11 .00
12. valuable-worthless .79 .04 .13 .00
13. red-green -.33 -.08 .35 .22
14. young-old .31 -.30 .32 .01
15. kind-cruel .82 -.10 -.18 .13
16. loud-soft -.39 .44 .23 .22
17. deep-shallow .27 .46 .14 -.25
18. pleasant-unpleasant .82 -.05 .28 -.12
19. black-white -.64 .31 .01 -.03
20. bitter-sweet .80 .11 .20 .03
21. happy-sad .76 -.11 .00 .03
22. sharp-dull .23 .07 .52 -.10
23. empty-full -.57 -.26 -.03 .18
24. ferocious-peaceful -.69 .17 .41 .02
25. heavy-light -.36 .62 -.11 .06
I II III IV
26. wet-dry .08 .07 -.03 -.14
27. sacred-profane .81 .02 -.10 .01
28. relaxed-tense .55 .12 -.37 -.11
29. brave-cowardly .66 .44 .12 .03
30. long-short .20 .34 .13 -.23
31. rich-poor .59 .03 .10 -.16
33. hot-cold -.04 -.06 .46 .07
34. thick-thin -.06 .44 -.06 -.11
35. nice-awful .87 -.08 .19 .15
36. bright-dark .69 -.13 .26 .00
37. bass-treble -.33 .47 -.06 .02
38. angular-rounded -.17 .08 .43 .12
39. fragrant-foul .84 -.04 -.11 .05
40. honest-dishonest .85 .07 -.02 .16
41. active-passive .14 .04 .59 -.02
42. rough-smooth -.46 .36 .29 .10
43. fresh-stale .68 .0l .22 -.11
44. fast-slow .0l .00 .70 -.12
45. fair-unfair .83 .08 -.07 .11
46. rugged-delicate -.42 .60 .26 .27
47. near-far .41 .13 .11 -.05
48. pungent-bland -.30 .12 .26 .05
49. healthy-sick .69 .17 .09 .02
50. wide-narrow .26 .41 -.07 -.11
I II III IV
% Total Variance 33.78 7.62 6.24 1.52
% Common Variance 68.55 15.46 12.66 3.08
 I II III IV")
Слайд 21
The semantic differential technique reveals information on three basic dimensions of

Слайд 22
The semantic differential technique reveals information on three basic dimensions of
evaluation

Слайд 23
The semantic differential technique reveals information on three basic dimensions of
evaluation
potency (i.e. strength)
")
Слайд 24
The semantic differential technique reveals information on three basic dimensions of
evaluation
potency (i.e. strength)
activity

Слайд 25• Evaluation is concerned with whether a person thinks positively or
• Potency is concerned with how powerful the topic is for the person (e.g. cruel – kind, and strong - week).
• Activity is concerned with whether the topic is seen as active or passive (e.g. active – passive).

Слайд 26Semantic Differential: Rotated Factor Loadings
(Osgood, Suci, & Tannenbaum, 1957)
I
1. good-bad .88 .05 .09 .09
2. large-small .06 .62 .34 .04
3. beautiful-ugly .86 .09 .0l .26
4. yellow-blue -.33 -.14 .12 .17
5. hard-soft -.48 .55 .16 .21
6. sweet-sour .83 -.14 -.09 .02
7. strong-weak .19 .62 .20 -.03
8. clean-dirty .82 -.05 .03 .02
9. high-low .59 .21 .08 .04
10. calm-agitated .61 .00 -.36 -.05
11. tasty-distasteful .77 .05 -.11 .00
12. valuable-worthless .79 .04 .13 .00
13. red-green -.33 -.08 .35 .22
14. young-old .31 -.30 .32 .01
15. kind-cruel .82 -.10 -.18 .13
16. loud-soft -.39 .44 .23 .22
17. deep-shallow .27 .46 .14 -.25
18. pleasant-unpleasant .82 -.05 .28 -.12
19. black-white -.64 .31 .01 -.03
20. bitter-sweet .80 .11 .20 .03
21. happy-sad .76 -.11 .00 .03
22. sharp-dull .23 .07 .52 -.10
23. empty-full -.57 -.26 -.03 .18
24. ferocious-peaceful -.69 .17 .41 .02
25. heavy-light -.36 .62 -.11 .06
I II III IV
26. wet-dry .08 .07 -.03 -.14
27. sacred-profane .81 .02 -.10 .01
28. relaxed-tense .55 .12 -.37 -.11
29. brave-cowardly .66 .44 .12 .03
30. long-short .20 .34 .13 -.23
31. rich-poor .59 .03 .10 -.16
33. hot-cold -.04 -.06 .46 .07
34. thick-thin -.06 .44 -.06 -.11
35. nice-awful .87 -.08 .19 .15
36. bright-dark .69 -.13 .26 .00
37. bass-treble -.33 .47 -.06 .02
38. angular-rounded -.17 .08 .43 .12
39. fragrant-foul .84 -.04 -.11 .05
40. honest-dishonest .85 .07 -.02 .16
41. active-passive .14 .04 .59 -.02
42. rough-smooth -.46 .36 .29 .10
43. fresh-stale .68 .0l .22 -.11
44. fast-slow .0l .00 .70 -.12
45. fair-unfair .83 .08 -.07 .11
46. rugged-delicate -.42 .60 .26 .27
47. near-far .41 .13 .11 -.05
48. pungent-bland -.30 .12 .26 .05
49. healthy-sick .69 .17 .09 .02
50. wide-narrow .26 .41 -.07 -.11
I II III IV
% Total Variance 33.78 7.62 6.24 1.52
% Common Variance 68.55 15.46 12.66 3.08
 I II III IV")
Слайд 27Inferential Attitude Measures (Thurstone, Likert, Guttman Scaling) Potential Items to Assess Attitudes
1. It is better to have an abortion than to give birth to an unwanted child.
2. I have reservations about the easy availability of abortions.
3. Abortion is equivalent to murder.
4. The right of the mother to control her own body is more important than any rights of the unborn fetus.
5. I would be willing to sign a petition to make abortion illegal.
6. The question of abortion involves fundamental human values.
7. The Government should not provide funds for abortion clinics.
8. The decision to have an abortion during early pregnancy should be left up to the mother.
9. Doctors who perform abortions are despicable.
10. If abortion were outlawed, women would obtain abortions with the help of unqualified people, putting their lives in danger.
11. There are valid arguments on both sides of the abortion debate.
12. If I or my wife had an unwanted pregnancy, I would be willing to abort the child.
13. Abortion is justifiable only when the mother's life is in danger.
14. The Constitution of RF amended to guarantee women's right to freedom of choice in matters of abortion.
15. When I think about aborting a tiny fetus, I feel disgusted.
 Potential Items to Assess Attitudes Toward Abortion1. It")
Слайд 28Likert Scaling:
Construct large number of items.
Administer questionnaire: 5-point response scale:
Preliminary attitude score = sum of item scores.
Item selection: Criterion of internal consistency.
Retain items with high (pos or neg) item-total correlation.
, agree")

Слайд 30Attitudes Toward Illegal Immigrants: Sample Items from a Likert Scale (Ommundsen & Larsen,
1. Illegal aliens should not benefit from my tax dollars. (N .68)*
2. Our taxes should be used to help those residing illegally in the United States.
(P .67)
3. There is enough room in this country for everyone. (P .65)
4. Illegal aliens are not infringing on our country's resources. (P .67)
5. Illegal aliens are a nuisance to society. (N .67)
6. There should be open international borders. (P .62)
7. Access to this country is too easy. (N .76)
8. Illegal aliens should receive food stamps. (P .65)
9. Illegal aliens who give birth to children in the United States should be made
citizens. (P .65)
10. The United States should accept all political refugees. (P .59)
11. Illegal aliens cost the United States millions of dollars each year. (N .75)
12. Illegal aliens should be eligible for welfare. (P .66)
*Direction of items: N = negative, P = positive; item – total correlation.
1. Illegal")

Слайд 32Validation of Attitude Measures:
Predictive Validity
Primary criterion for validity of attitude measure:
Predictive
Question:
Do standard (explicit) attitude measures, such as Likert scales or the semantic differential, predict behavior?


Слайд 34Other Examples of Attitude-Behavior Relations
Corey (1937)
Attitude: Likert scale. Attitude toward cheating.
Behavior:
Attitude–behavior correlation: r = .02
Weitz & Nuckols (1953)
Attitude: 10-item scale. Attitude toward job.
Behavior: Turnover. Leaving job during subsequent 12-months period.
Attitude–behavior correlation: r = .20
Holman (1956)
Attitude: 12-item scale. Attitude toward football.
Behavior: Attendance of football games over 8 occasions.
Attitude–behavior correlation: r = .41.
Fischer (1971)
Attitude: Likert scale. Attitude toward helping.
Behavior: Joining a hospital companion program.
Attitude–behavior correlation: r = .27.
Attitude: Likert scale. Attitude toward cheating.Behavior: No. items changed on")
Слайд 35Narrative Review of Over 50 Studies of the Attitude – Behavior
"Taken as a whole, these studies suggest that it is considerably more likely that attitudes will be unrelated or only slightly related to behaviors."
"The present review provides little evidence to support the postulated existence of stable, underlying attitudes within the individual which influence both his verbal expressions and his action."
Alan Wicker, 1969

Слайд 36Wicker’s conclusions did not come as a surprise to sociologists who
It did, however, shatter the complacency of many psychologists who, like Gordon Allport (1968), considered attitude to be “the most distinctive and indispensable concept in contemporary American social psychology” (p. 59).
Attitude – Behavior Relation

Слайд 37Explanation I:
Inadequate Attitude Measurement
Major Critique
Attitudes assess only the evaluative (affective)
We must also assess the cognitive and conative components of attitude.
 component.We must also assess")
Слайд 38Prediction of 8 Behaviors from Attitude Toward the Church (Ostrom, 1969)
Mean
Cognition – Behavior: Mean r = .18
Affect – Behavior: Mean r = .22
Conation – Behavior: Mean r = .24
Mean CorrelationsCognition – Behavior: Mean")
Слайд 39Explanation II:
Other Additive Factors
Behavior
Personality traits
Ability
Motivation
Attitude
Habit
Needs
Social pressure
Other attitudes

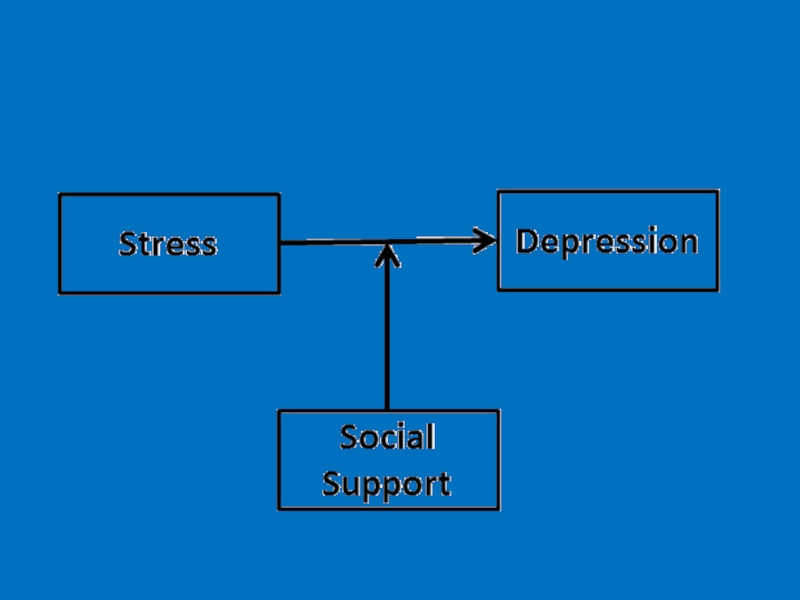
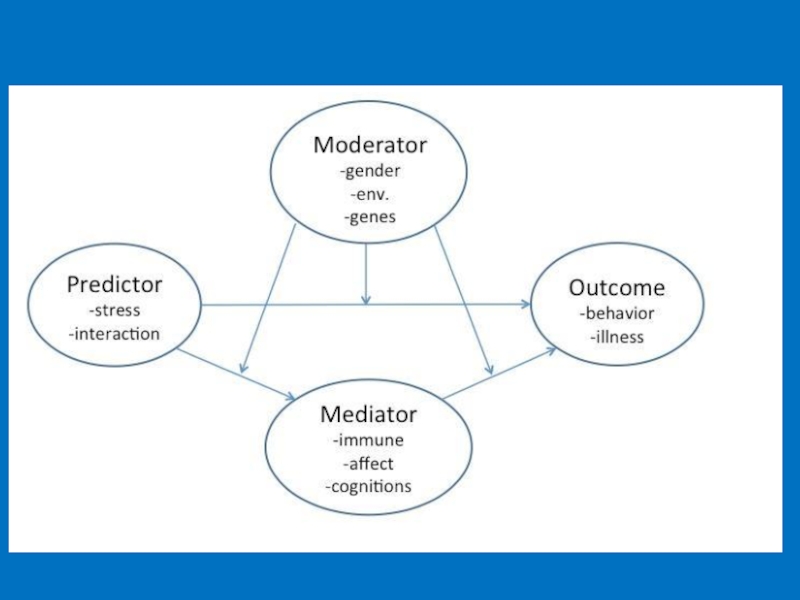
Слайд 40Explanation III:
Moderating Variables
Personality
Self-monitoring (Snyder & Swann, 1976)
Private self-consciousness (Scheier et al.,
Need for cognition (Cacioppo et al., 1986)
Attitude Attributes
Cognitive-affective consistency (Norman, 1975)
Reflection (Snyder & Swann, 1976)
Involvement (Sivacek & Crano, 1982)
Confidence (Warland & Sample, 1973)
Direct experience (Regan & Fazio, 1977; Fazio & Zanno, 1978)
Private self-consciousness (Scheier et al., 1978)Need for cognition")
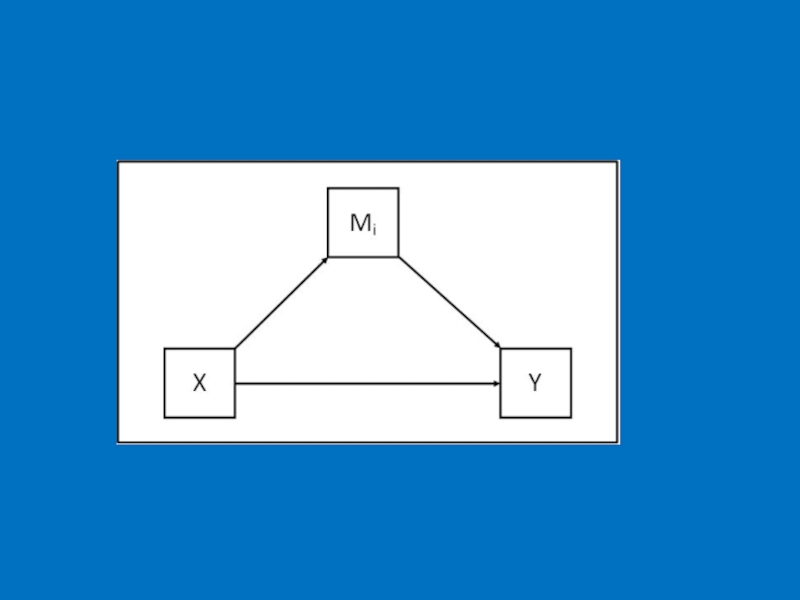
Слайд 45Explanation III:
Moderating Variables
Personality
Self-monitoring (Snyder & Swann, 1976)
Private self-consciousness (Scheier et al.,
Need for cognition (Cacioppo et al., 1986)
Attitude Attributes
Cognitive-affective consistency (Norman, 1975)
Reflection (Snyder & Swann, 1976)
Involvement (Sivacek & Crano, 1982)
Confidence (Warland & Sample, 1973)
Direct experience (Regan & Fazio, 1977; Fazio & Zanno, 1978)
Private self-consciousness (Scheier et al., 1978)Need for cognition")

Слайд 47Effect of Confidence on Attitude-Behavior Correlation – Student Government (Warland &
")
Слайд 48Problems of Moderating Variables Approach
1. High attitude-behavior correlation only for some

Слайд 49Problems of Moderating Variables Approach
1. High attitude-behavior correlation only for some
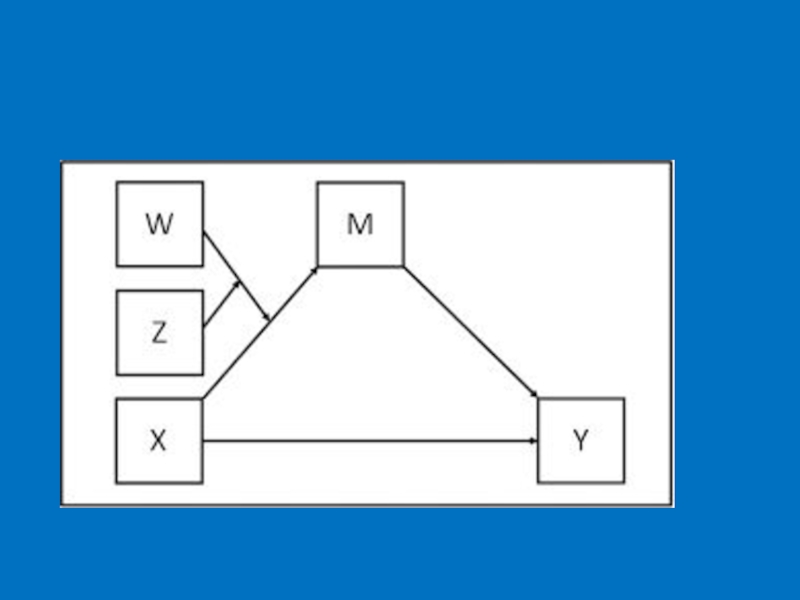
2. Higher-order interactions:
“Once we attend to interactions, we enter a hall of mirrors that extends to infinity. However far we carry our analysis — to third order or fifth order or any other — untested interactions of a still higher order can be envisioned” (Cronbach (1975).


Слайд 51Problems of Moderating Variables Approach
1. High attitude-behavior correlation only for some
2. Higher-order interactions:
“Once we attend to interactions, we enter a hall of mirrors that extends to infinity. However far we carry our analysis — to third order or fifth order or any other — untested interactions of a still higher order can be envisioned” (Cronbach (1975).
“Theoretically, any single instance of behavior can be predicted if all the right moderator variables are included. This is no more than to say that behavior is determined, and that if we knew everything that determined it, we could predict it. However, to do so might require the addition of so many moderator variables that they would generate interactions of such complexity as to make the procedure unfeasible and the results uninterpretable” (Epstein, 1983).

Слайд 53Response Biases
Long before it became evident that attitudes are poor predictors
social desirability

Слайд 54The methods available to avoid social desirability bias were of two
1) Disguised procedures of a verbal nature, such as Hammond’s (1948) error-choice technique or Waly and Cook’s (1965) plausibility technique, were based on the assumption that when the purpose of the instrument is not apparent, respondents are less likely to distort or falsify their answers to attitudinal inquiries.
2) Alternatively, physiological reactions (e.g., galvanic skin response, heart rate) were assumed to prevent bias by assessing involuntary responses over which the individual has little or no control (for a review, see Kidder & Campbell, 1970).
 Disguised procedures of")

Слайд 56Graphic representation of modalities on the two factor axes of FA

Слайд 57Graphic representation of modalities on the two factor axes of FA

Слайд 58Graphic representation of modalities on the two factor axes of FA

Слайд 59Graphic representation of modalities on the two factor axes of FA

Слайд 60Graphic representation of modalities on the two factor axes of FA

Слайд 61The methods available to avoid social desirability bias were of two
1) Disguised procedures of a verbal nature, such as Hammond’s (1948) error-choice technique or Waly and Cook’s (1965) plausibility technique, were based on the assumption that when the purpose of the instrument is not apparent, respondents are less likely to distort or falsify their answers to attitudinal inquiries (for a recent version of the plausibility technique, see Saucier & Miller, 2003).
2) Alternatively, physiological reactions (e.g., galvanic skin response, heart rate) were assumed to prevent bias by assessing involuntary responses over which the individual has little or no control (for a review, see Kidder & Campbell, 1970).
 Disguised procedures of")
Слайд 62PREDICTING SINGLE BEHAVIORS
Investigators are often interested not in a broad multiple-act
Many examples are found in the health domain where investigators have a substantive interest in understanding and influencing such behaviors as cigarette smoking or categories of behavior, such as exercising or eating a low-fat diet. Similarly, in the domain of environmental protection, investigators are concerned with such behaviors as recycling of glass, plastic, and paper; or categories of behavior such as conserving water or reducing the consumption of energy.

Слайд 63Principle of Compatibility
A single behavior can be viewed as involving an

Слайд 64Principle of Compatibility
For example, we may be interested in understanding why
In this example, we would have to assess attitude to enroll in a continuing special course at MP the next time it is offered or, in the more general case, to enroll in a continuing education course in the next 2 months.

Слайд 65Principle of Compatibility
The principle of compatibility (Ajzen, 1988; Ajzen & Fishbein,
To the extent that the indicators used to assess attitude and behavior comply with the principle of compatibility, they should correlate highly with each other.
 requires that measures")
Слайд 66PREDICTING SINGLE BEHAVIORS: Principle of Compatibility
Attitude
Target
Action
Context
Time
Behavior
Target
Action
Context
Time
Empirical research has shown that specific

Слайд 67Manstead, Proffitt, and Smart (1983) reported a study on infant feeding
 reported a study on infant feeding practices. Toward the end")
Слайд 68Many studies have examined the relation between attitudes and behavior in

Слайд 69In a meta-analysis of 8 studies that manipulated level of compatibility


Слайд 71Intentions as Predictors of Behavior
The previous discussion indicates that, consistent with
Carrying this idea further, a number of theorists have proposed that the intention to perform a behavior, rather than attitude, is the closest cognitive antecedent of actual behavioral performance.
This implies that we should be able to predict specific behaviors with considerable accuracy from intentions to engage in the behaviors under consideration.

Слайд 72Intentions as Predictors of Behavior
Many studies have substantiated the predictive validity
Meta-analyses covering diverse behavioral domains have reported mean intention–behavior correlations of 0.45 – 0.62.

Слайд 73
The respondents were asked the following question: “Are you thinking about
Next, we selected respondents for further analysis.
- 269 respondents answered this question either “Yes”, or “Maybe”.

Слайд 74One year later, we re-interviewed by telephone the “intenders”. The purpose
We managed to locate and re-interview 163 respondents (out of the original 269) - 61% of the ”intenders.” Of these, 38 (23, 3%) opened their own business. The remaining 106 respondents - 39% of the “intenders” - either changed their contact details or refused to participate in the study a second time.

Слайд 75Low Intention–Behavior Relations
However, notwithstanding these encouraging findings, there is also considerable
Several factors may be responsible for low relations between intentions and behavior.

")
Слайд 77Reasons for Failure to Carry Out Intention
Low control (INT-BEH moderated by
Forgetting – Failure of “prospective memory.” Motivation can be high.
Procrastination (postpone something)
Low or moderate motivation. Fails to exceed threshold needed to overcome inertia or distaste for activity.
Ambivalent motivation. Approach-avoidance conflict.
Change of mind – due to new information or re-evaluation of existing information; person no longer motivated to perform the behavior.
Behavior on single occasion. New information prior to behavior.
Repeated behavior. New information due to feedback.
Hypothetical vs. Real – Different types of information accessible. Motivation high in hypothetical, low in real.
.Forgetting – Failure of")
Слайд 78Attitudes toward specific behaviors are good predictors of single actions.
General
Correlations of single behaviors with general attitudes tend to be modest at best.
Attitudes and Behavior

Слайд 79
New models of relation between attitude and behavior appeared as a
Nevertheless, many investigators continue to be interested in broad attitudinal dispositions and their possible effects on specific behaviors.
Attitudes and Behavior

Слайд 80From General Attitudes to Specific Behaviors: Automatic and Deliberative Processes (Fazio,
The most direct and sophisticated attempt to deal with the processes whereby general attitudes may influence performance of specific behaviors can be found in Fazio’s MODE model.
The acronym MODE is used to suggest that “motivation and opportunity act as determinants of spontaneous versus deliberative attitude-to-behavior processes” (Fazio, 1995, p. 257).
Russell H. Fazio
Ohio State University
 The most direct")
Слайд 81From General Attitudes to Specific Behaviors: Automatic and Deliberative Processes (Fazio,
Attitude is the link in memory between an object and an evaluation.
The stronger is the link, the stronger is the attitude.
Direct experience, repeated attitude expressions, and other factors produce strong attitudes.
Attitude strength is indicated by low response latency.
Attitude must be activated from memory to influence behavior.
Only strong attitudes are automatically activated.
Biased processing results are consequences of strong attitude-behavior correlation.
Attitude is the link")
 – Fazio (1990)")
Слайд 83
Thus, automatic attitude activation occurs when a strong link has been
The degree of accessibility (i.e., attitude strength) is usually operationalized by measuring the latency of responses to attitudinal questions: the faster is the response, the more accessible the attitude is assumed to be.
The MODE Model (Motivation and Opportunity as Determinants) – Fazio (1990)

Слайд 84Studies that were designed to test directly the MODE model’s predictions
Empirical Support for the MODE Model

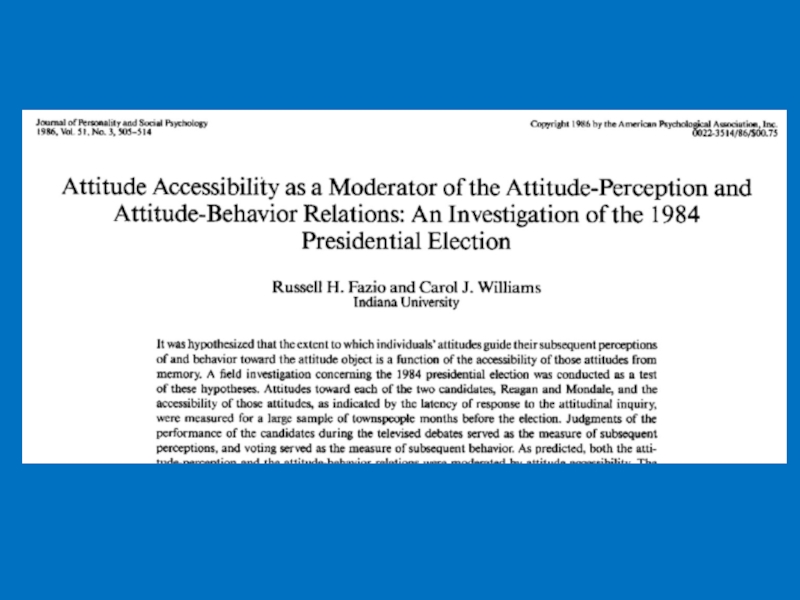
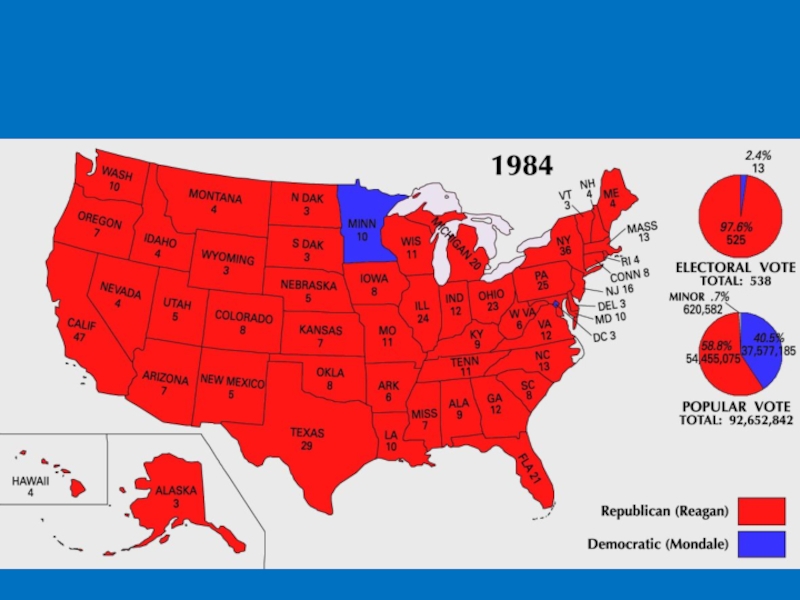
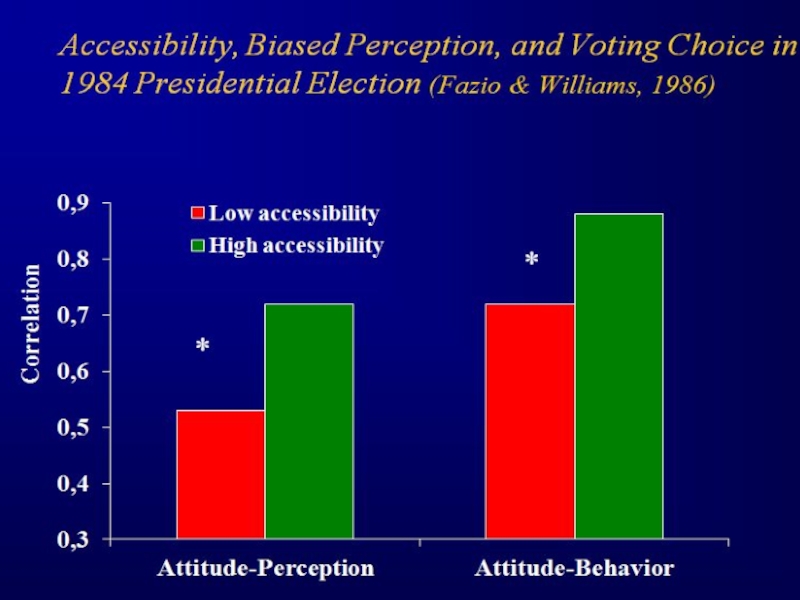
Слайд 85Fazio and Williams (1986) predicted voting choice in the 1984 presidential
In addition to attitude valence, the investigators also assessed the accessibility of these attitudes by asking participants to respond as quickly as possible to the attitude questions and by recording response latencies. As it was expected the prediction of voting choice was significantly better for participants with relatively accessible (low latency) attitudes toward the candidates than for participants with relatively inaccessible attitudes.
Empirical Support for the MODE Model
 predicted voting choice in the 1984 presidential election from attitudes toward")


Слайд 89A total of 245 voting age residents of the Bloomington, Indiana
Twenty-five of these individuals responded to an advertisement in the local newspaper.
Another 16 people were recruited and interviewed at the public library.
The majority of the sample, the remaining 204 individuals, were shoppers at a local mall who agreed to participate in a political survey.
The subjects were paid $3.00 for participating in the survey. All interviews were conducted during June and July of 1984.
Experiment

Слайд 90Experiment
The first five statements were intended to serve as practice items
Of the remaining 20 statements, 5 were factual items (e.g., "The capital of Indiana is Terre Haute") and 15 were opinion items concerning attitudes toward such issues as school prayer, gun control, and nuclear power plants in addition to the two major-party candidates for the presidency.
These two critical statements were "A good president for the next 4 years would be Ronald Reagan" and "A good president for the next 4 years would be Walter Mondale"

Слайд 91The answers of the participants of that experiment was recorded on
The participants had to fill a special blank in which they should have written down personal data: name, family name, address and phone number to receive money for the answers. Therefore, the researchers softly-softly received personal information about the participants, which helped them in the future to get in touch with the participants on the next two stages of the research.
Experiment

Слайд 92The next phase concerned judgments of the candidates' performances during the
Experiment

Слайд 93The day after the second debate, subjects were mailed a letter
Experiment

Слайд 94Subjects were asked to endorse one of five statements: "Reagan was
Experiment

Слайд 97The final phase of the investigation concerned voting behavior. Beginning the
Experiment

Слайд 99The Role of Attitude Strength: Two Possibilities
Response latency is an indicator
MODE model: Accessibility is the crucial facet. Accessibility increases bias and thus produces attitude-consistent.
Alternative explanation: Stability is the crucial facet. Strong attitudes are more stable over time and therefore more predictive of later behavior.

Слайд 100Stability of Intentions
Perhaps more important, if intentions change after they are
Meta-analyses of intention–behavior correlations show the expected pattern over time, although the effect is not always significant.

Слайд 101Stability of Intentions
Instead of relying on time interval as an indication

Слайд 102Stability of Intentions
In one of these investigations (Sheeran, Orbell, & Trafimow,
After returning from the winter vacation, they reported on how many days a week they had actually studied.
, undergraduate college students")
Слайд 103Changes in Intentions Prior to Behavior (Sheeran, Orbell, & Trafimow, 1999)
Behavior:
Intention: Measured twice, 5 weeks apart prior to winter vacation.
Overall intention-behavior correlation: .38**
Results of moderated regression analysis:
Behavior: Self-reported studying during winter")
Слайд 104Stability of Intentions
For participants whose intentions remained relatively stable during the