- Главная
- Разное
- Дизайн
- Бизнес и предпринимательство
- Аналитика
- Образование
- Развлечения
- Красота и здоровье
- Финансы
- Государство
- Путешествия
- Спорт
- Недвижимость
- Армия
- Графика
- Культурология
- Еда и кулинария
- Лингвистика
- Английский язык
- Астрономия
- Алгебра
- Биология
- География
- Детские презентации
- Информатика
- История
- Литература
- Маркетинг
- Математика
- Медицина
- Менеджмент
- Музыка
- МХК
- Немецкий язык
- ОБЖ
- Обществознание
- Окружающий мир
- Педагогика
- Русский язык
- Технология
- Физика
- Философия
- Химия
- Шаблоны, картинки для презентаций
- Экология
- Экономика
- Юриспруденция
Market structure, market power, and welfare ( lecture 2 ) презентация
Содержание
- 1. Market structure, market power, and welfare ( lecture 2 )
- 2. Outline Perfect competition and monopoly. Welfare Allocative
- 3. Typology of market structures
- 4. Indicators of declining competition Increased concentration in many industries…
- 5. Indicators of declining competition Return on invested capital has become increasingly concentrated (increased rents)…
- 6. Indicators of declining competition Decline in the
- 7. Causes of declining competition Mergers: in 2015,
- 8. Profit function: First order
- 9. Perfect competition Assumptions: Large number of buyers
- 10. Perfect competition (another way to look at it, LWG)
- 11. Perfect competition: Pre-entry Profit maximization requires price
- 12. Perfect competition: Post-entry Entry leads to increased
- 13. Profit function for the monopolist: Profit maximization: Monopoly
- 14. Market power: The ability to set prices
- 15. Monopoly If follows that the monopoly output is lower than the output of perfect competition.
- 16. Welfare depends on both allocative efficiency and
- 17. Productive efficiency is made of Technical
- 18. Allocative efficiency Perfect competition: the condition for
- 19. Allocative efficiency: An example
- 20. Allocative efficiency: An example
- 21. Harberger (1954): By examining 73 manufacturing industries,
- 22. Allocative efficiency: Quantifying the DWL
- 23. Productive efficiency Nearly all studies find that
- 24. Productive efficiency ‘Complacent monopolist’: Costs may increase
- 25. Japan’s export success stories are in industries
- 26. Productive efficiency: Natural monopoly Sometimes, less competition
- 27. Welfare: TS or CS? Pittman (2007): Wealth
- 28. Welfare and competition policy Source: Shan et
- 29. Welfare and competition policy China’s AML was
- 30. Welfare and competition policy Case 1: Coca-Cola/Huiyuan,
- 31. Recall that: With MR=MC in equilibrium,
- 32. The Lerner index Perfect competition: L=0 Monopoly:
- 33. Competition and welfare: More than just prices…
- 34. Additional welfare costs arise due to the
- 35. Rent seeking Campaign contributions to the 2012 US election cycle:
- 36. Entry threats play an important role in
- 37. Incumbents drop average fares substantially on threatened
- 38. Internet monopolies (The Economist, 2016)
- 39. Internet monopolies Capturing a dominant share of
- 40. Internet monopolies Q: Does the internet favour
- 42. Internet monopolies Once growth begins, network effects
- 43. Internet monopolies Q: Are digital monopolies less
- 44. Internet monopolies Network effects do not amount
- 45. Internet monopolies Opposite arguments: Internet giants have
- 47. Internet monopolies Q: Do internet giants abuse
- 48. Internet monopolies
- 49. Internet monopolies
- 50. Internet monopolies Tim WU (FTC): Info-monopolies tend
- 51. More competition is associated with higher welfare

Слайд 2Outline
Perfect competition and monopoly.
Welfare
Allocative efficiency
Surplus standard
Productive efficiency
The Lerner index
Welfare: more than
just quantity
Market power and entry threats
Application: Internet monopolies
Market power and entry threats
Application: Internet monopolies


Слайд 5Indicators of declining competition
Return on invested capital has become increasingly concentrated
(increased rents)…
…")
Слайд 6Indicators of declining competition
Decline in the number of new firms (due
to entry barriers)…
…")
Слайд 7Causes of declining competition
Mergers: in 2015,
Global M&A volume hit $5 trillion,
U.S. M&A made up 50% of the total.
69 deals over $10 billion, and 10 deals over $50 billion.
Pfizer’s $160 billion acquisition of Allergan.
Anheuser-Busch InBev’s $117 billion acquisition of SABMiller.
Firm conduct
R&D
Advertising
Collusion
Erecting entry barriers
69 deals over $10 billion, and 10 deals over $50 billion.
Pfizer’s $160 billion acquisition of Allergan.
Anheuser-Busch InBev’s $117 billion acquisition of SABMiller.
Firm conduct
R&D
Advertising
Collusion
Erecting entry barriers

Слайд 8Profit function:
First order condition for profit maximization:
What if… cost reduction will
dominate revenue reduction
Profit maximization
(Church ch2)

Слайд 9Perfect competition
Assumptions: Large number of buyers and sellers, free entry, identical
goods, perfect information, no transport costs.
Firms are price takers:
Profit maximization implies that q is such that – price is equal to marginal cost:
Firms are price takers:
Profit maximization implies that q is such that – price is equal to marginal cost:

")
Слайд 11Perfect competition: Pre-entry
Profit maximization requires price to be equal to the
short-run MC
Industry short-run supply determines Q1.
Note: Existence of abnormal profits.
Industry short-run supply determines Q1.
Note: Existence of abnormal profits.

Слайд 12Perfect competition: Post-entry
Entry leads to increased supply, and lower price (P1→P2).
The
equilibrium quantity for each firm drops; but the industry output increases to Q2.
Abnormal profits are eliminated.
Abnormal profits are eliminated.
.The equilibrium quantity for each")


Слайд 15Monopoly
If follows that the monopoly output is lower than the output
of perfect competition.

Слайд 16Welfare depends on both allocative efficiency and production efficiency
Allocative efficiency: there
is no possible reallocation of resources that could make one agent better off without making at least one other agent worse off.
Requires the marginal benefit of an additional unit of output to be equal to the MC of production.
Requires the marginal benefit of an additional unit of output to be equal to the MC of production.
Welfare

Слайд 17Productive efficiency is made of
Technical efficiency (x-efficiency): Producing as much
output as is technologically feasible, given the inputs.
Economic efficiency: Best possible selection of factor inputs to produce the current output level at the lowest possible cost.
Welfare is conventionally measured by the total surplus
Total surplus = consumer surplus + producer surplus
Economic efficiency: Best possible selection of factor inputs to produce the current output level at the lowest possible cost.
Welfare is conventionally measured by the total surplus
Total surplus = consumer surplus + producer surplus
Welfare
: Producing as much output as is technologically")
Слайд 18Allocative efficiency
Perfect competition: the condition for allocative efficiency is satisfied. Total
surplus = Consumer surplus = A+B+C
Monopoly: the condition for allocative efficiency is NOT satisfied.
Total surplus = A+B . Loss of welfare = C (‘deadweight loss’)
Monopoly: the condition for allocative efficiency is NOT satisfied.
Total surplus = A+B . Loss of welfare = C (‘deadweight loss’)


Слайд 21Harberger (1954): By examining 73 manufacturing industries, he calculated DWL to
be around 0.1% of the US GDP.
Cowling and Mueller (1975) re-estimated deadweight losses in USA and UK taking with improved methodology
Empirical estimation of PED
Data at the firm level
They estimated DWL to be 3.9% of GDP in US and 3.8% in UK.
Bhuyan (2000). Estimates for the US:
DWL triangle = 5.5% of sales on average.
Wide range, e.g. 33.45% for cereal production, 10.2% for canned drinks, < 0.5% for pet food and sweets.
Allocative efficiency: Quantifying the DWL
: By examining 73 manufacturing industries, he calculated DWL to be around 0.1% of")

Слайд 23Productive efficiency
Nearly all studies find that more competition leads to increased
productivity.
More competition usually leads to high productive efficiency as there are intense pressures to lower the costs
→ to be incorporated in the welfare analysis
More competition usually leads to high productive efficiency as there are intense pressures to lower the costs
→ to be incorporated in the welfare analysis

Слайд 24Productive efficiency
‘Complacent monopolist’: Costs may increase will less competition
TS falls further
by F+H+J+K to D+E+G
Increased cost of production causes a welfare loss, both directly and through the lower quantity.
Increased cost of production causes a welfare loss, both directly and through the lower quantity.

Слайд 25Japan’s export success stories are in industries where there is domestic
competition (automobiles, electronics). Industries with little competition (such as chemicals) have not been able to export.
US banking industry: X-inefficiency is positively related to market power. The DWL is several times larger than the inefficiency loss. [Berger and Hannan (1998)]
US retail markets: The entry of Wal-Mart leads existing firms to improve their productivity. Existing firms reduce stockouts by 24% thanks to investment in computers tracking inventories. [Matsa (2009)]
Productive efficiency: Empirical evidence
. Industries")
Слайд 26Productive efficiency: Natural monopoly
Sometimes, less competition may lower the costs because
of scale economies (e.g. water, gas utilities).

Слайд 27Welfare: TS or CS?
Pittman (2007): Wealth transfers from producers to consumers
can be difficult to set up. In addition, the same amount of wealth means much more to consumers than to producers. Thus, the CS standard is more appropriate.
Majority of economist still consider the TS as the most appropriate standard for measuring welfare.
Using the CS standard, the negative impact of monopoly on welfare is even greater.
Majority of economist still consider the TS as the most appropriate standard for measuring welfare.
Using the CS standard, the negative impact of monopoly on welfare is even greater.
: Wealth transfers from producers to consumers can be difficult to")
Слайд 28Welfare and competition policy
Source: Shan et al. (2012).
United States antitrust policy
(Sherman act):
Focus on the CS.
Efficiency gains are taken into account only if they are likely to increase the CS (via lower prices)
In practice, the CS standard has been translated into a price standard.
E.g. proposed merger of Staples and Office Depot
It was estimated that the merger would increase prices by 7.1%: +7.3% due to market power, and -0.15% due to efficiency gains
.United States antitrust policy (Sherman act):Focus on the")
Слайд 29Welfare and competition policy
China’s AML was adopted in 2007. What is
the welfare standard used China?
AML article 1:
“This law will be enacted for the purpose of guarding against or ceasing monopolistic conduct, safeguarding and promoting the order of market competition, improving economic efficiency, protecting the consumer’s interest, protecting the public interest, and promoting the healthy development of the socialist market economy.”
Article 28 states that even if a merger eliminates or restricts market competition, the Anti-Monopoly Enforcement Authority may decide not to prohibit it if the advantages of implementing the merger exceed the disadvantages.

Слайд 30Welfare and competition policy
Case 1: Coca-Cola/Huiyuan, 2009
Concern that the merged firm
would leverage its strong position in the carbonate soft drink market to the fruit juice market.
Merger was blocked to prevent consumers from being harmed by higher prices in the future.
Case 2: Pfizer/Wyeth, 2009
The merged firm would have 49% market share.
Merger blocked, to prevent post-merger price increases. No evidence that efficiency gains have been considered
Overall, evidence that AML in China placed some weigh on the CS in cases where the M&A was rejected.

Слайд 31Recall that:
With MR=MC in equilibrium, we can rearrange:
The Lerner index provides
a measure of market power based on the relationship between P and MC.
The key determinant of market power is the elasticity of demand.
The key determinant of market power is the elasticity of demand.
The Lerner index

Слайд 32The Lerner index
Perfect competition: L=0
Monopoly: L>0
Market power is associated with low
quantity and a smaller TS.
Example:
Supermarkets: PED of -10 → L=0.1 (10% mark-up)
Convenience stores: PED of -5 → L=0.2 (20% mark-up)
Drug pricing: PED of -1.1 → L=0.9 (90% mark-up)
Example:
Supermarkets: PED of -10 → L=0.1 (10% mark-up)
Convenience stores: PED of -5 → L=0.2 (20% mark-up)
Drug pricing: PED of -1.1 → L=0.9 (90% mark-up)

Слайд 33Competition and welfare: More than just prices…
How does competition benefits society
(beyond quantity)?
Product variety
Product quality
Innovation
Rent-seeking
A firm with market power may develop monopsony power…
With suppliers (low price for inputs)
With specialized workers (low wages)
Product variety
Product quality
Innovation
Rent-seeking
A firm with market power may develop monopsony power…
With suppliers (low price for inputs)
With specialized workers (low wages)
?Product varietyProduct qualityInnovationRent-seekingA")
Слайд 34Additional welfare costs arise due to the efforts of firms to
acquire and maintain monopoly.
Firms may lobby the government through the political action committees and campaign donations. Their objectives include:
Protect trade barriers
Obtain public contracts
Fight environment regulations
Rent seeking is wasteful: Resources spent on rent-seeking produce no social benefit.
Rent dissipation: Firms are willing to incur costs up to the value of the rents and the entire value of monopoly profit is wasted
Rent seeking


Слайд 36Entry threats play an important role in preventing firms from abusing
market power.
Application: Entry deterrence in the Airlines industry [Goolsbee and Syverson, 2004].
Consider situations where Southwest begins operating in both endpoint airports of a route but before it starts flying the route itself.
Application: Entry deterrence in the Airlines industry [Goolsbee and Syverson, 2004].
Consider situations where Southwest begins operating in both endpoint airports of a route but before it starts flying the route itself.
Market power and entry threats
Philadelphia
SW presence 2004
Jacksonville
SW presence 1997
Tampa
SW presence 1996
SW threatens
entry here

Слайд 37Incumbents drop average fares substantially on threatened routes before Southwest actually
enters the route (or even if they do not enter at all by the end of our sample).
The fare cuts are only on the threatened route itself; prices do not fall on routes to nearby airports.
There is some evidence that airlines expand flight or seat capacity to deter entry.
The fare cuts are only on the threatened route itself; prices do not fall on routes to nearby airports.
There is some evidence that airlines expand flight or seat capacity to deter entry.
Market power and entry threats

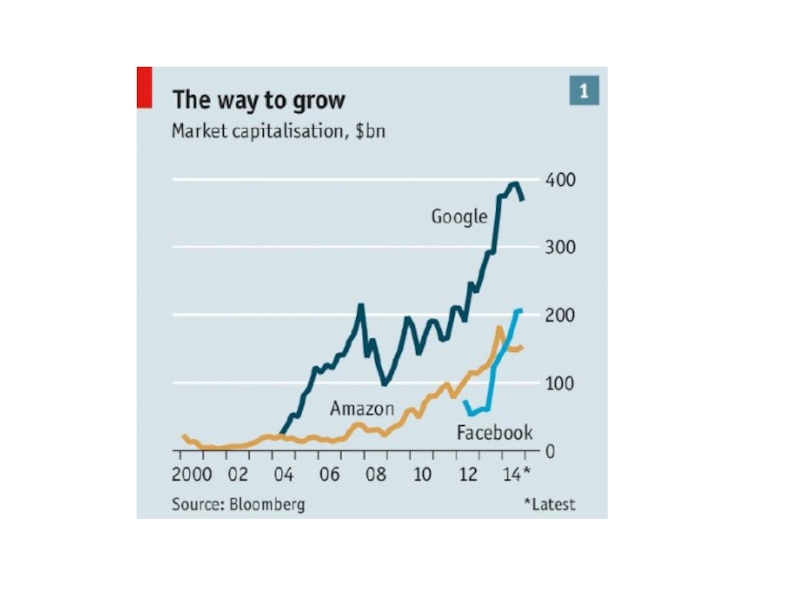
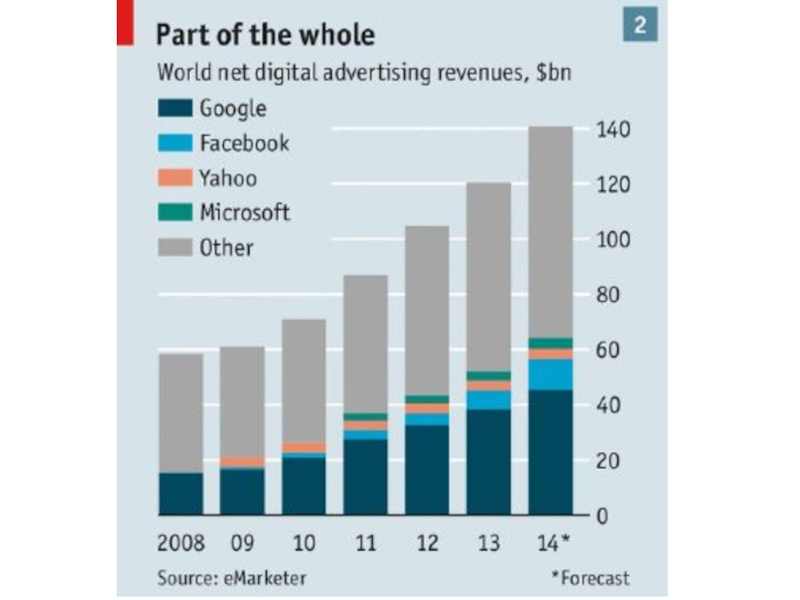
Слайд 38Internet monopolies
(The Economist, 2016)
How worried should we be about internet
monopolies?
Are they similar to traditional monopolies?
Are they similar to traditional monopolies?
How worried should we be about internet monopolies?Are they similar to")
Слайд 39Internet monopolies
Capturing a dominant share of the global market is possible:
Amazon
(>50% of America’s book market)
Alibaba (>80% of e-commerce in China)
Facebook (1.5bn active members worldwide)
Google (68% of online searches in America, >90% in Europe)
Alibaba (>80% of e-commerce in China)
Facebook (1.5bn active members worldwide)
Google (68% of online searches in America, >90% in Europe)

Слайд 40Internet monopolies
Q: Does the internet favour such quasi-monopolies?
Internet start-ups picked markets
that are not yet mature. Although they were not first to enter the market, they had features that allowed them to gain a dominant position.
Facebook vs MySpace, Google vs AltaVista, Amazon
Valuation can increase rapidly
Uber launched in 2010 in San Francisco
Later raised $1.5bn in VC, giving it a valuation of $17bn
Later expanded to more cities, giving it a valuation of $60bn+
Difference with traditional industries: low trade barriers, online space allowing fast global growth.

Слайд 42Internet monopolies
Once growth begins, network effects start to kick in. Examples:
Facebook:
having more members increases the membership benefits.
Ebay: indirect effect: Having more buyers does not directly help existing buyers. But more buyers means a better market for sellers, and more sellers means a better market for buyers…
Uber: more drivers attract more passengers, and vice-versa – self-enforcing – may lead to a large market share fast, grow fast because of the simplicity and the network effect.

Слайд 43Internet monopolies
Q: Are digital monopolies less harmful than traditional monopolies?
They are
not ‘real’ monopolies, either because there is no selling going on (other than advertising), or because the market they dominate is not the whole story.
Google has no direct revenue from internet searches.
Google is dominant for online searches, but it competes with many other firms for online advertising. (issue of market definition) – does not have typical welfare implications;
Google has no direct revenue from internet searches.
Google is dominant for online searches, but it competes with many other firms for online advertising. (issue of market definition) – does not have typical welfare implications;

Слайд 44Internet monopolies
Network effects do not amount to barriers to entry. Facebook
and Google faced competitors with many more users. Many small firms try to take on Google and Facebook.
Competition is only one click away, which limits Google ability to act anti-competitively. (same for Amazon, Skype etc.) if they do so, consumers will simply switch to other providers.
Competition is only one click away, which limits Google ability to act anti-competitively. (same for Amazon, Skype etc.) if they do so, consumers will simply switch to other providers.

Слайд 45Internet monopolies
Opposite arguments:
Internet giants have a huge advantage over competitors: Information.
This allows them to have a profitable business.
Google, Amazon: Data on what people want to buy
Facebook: Data on the area of interests
Even though competition is one-click away, most users do not seem interested in taking the step. There are some switching costs (mail and map apps habits).
Different types of market power:
Traditional economy: power to increase prices without loosing (much) business
Digital Economy: power to stop innovating without loosing (much) business

Слайд 47Internet monopolies
Q: Do internet giants abuse market power?
Google
Reserves top spots on
its search-result pages for links to its own services. (Google Shopping, Google Maps)
Could it become the ultimate digital monopoly?
The business of mining any and all data it can for new profits streams.
Google could use its assets (data) to take control of other industries (it is entering the markets of self-driving cars, smart homes, robotics, health care).
Could it become the ultimate digital monopoly?
The business of mining any and all data it can for new profits streams.
Google could use its assets (data) to take control of other industries (it is entering the markets of self-driving cars, smart homes, robotics, health care).


Слайд 50Internet monopolies
Tim WU (FTC): Info-monopolies tend to be good in the
short term and bad in the long term. For a time, firms deliver powerful efficiencies and dazzling innovations. Today, a single search engine has made virtually everyone’s life simpler, just as a single phone network did 100 years ago. Monopolies also generate profits that can be reinvested into research and even public projects: AT&T wired America and invented the transistor; Google is scanning the world’s libraries.
"The downside shows up later, as the monopolist ages and the will to innovate is replaced by will to power. In the 1930s, AT&T took the measure of suppressing its own invention of magnetic recording, for fear it would deter use of the telephone.
"The downside shows up later, as the monopolist ages and the will to innovate is replaced by will to power. In the 1930s, AT&T took the measure of suppressing its own invention of magnetic recording, for fear it would deter use of the telephone.
: Info-monopolies tend to be good in the short term and bad")
Слайд 51More competition is associated with higher welfare (allocative efficiency, productive efficiency).
The
Lerner index as a proxy for market power.
Entry threats key in determining whether firms can abuse market power.
Internet monopolies: differences and similarities with traditional monopolies.
Entry threats key in determining whether firms can abuse market power.
Internet monopolies: differences and similarities with traditional monopolies.
Summary
.The Lerner index as a")