- Главная
- Разное
- Дизайн
- Бизнес и предпринимательство
- Аналитика
- Образование
- Развлечения
- Красота и здоровье
- Финансы
- Государство
- Путешествия
- Спорт
- Недвижимость
- Армия
- Графика
- Культурология
- Еда и кулинария
- Лингвистика
- Английский язык
- Астрономия
- Алгебра
- Биология
- География
- Детские презентации
- Информатика
- История
- Литература
- Маркетинг
- Математика
- Медицина
- Менеджмент
- Музыка
- МХК
- Немецкий язык
- ОБЖ
- Обществознание
- Окружающий мир
- Педагогика
- Русский язык
- Технология
- Физика
- Философия
- Химия
- Шаблоны, картинки для презентаций
- Экология
- Экономика
- Юриспруденция
Macroeconomics Productivity GDP per capita Venezuela. (Lecture 6) презентация
Содержание
- 1. Macroeconomics Productivity GDP per capita Venezuela. (Lecture 6)
- 2. GDP Per Capita / GDP PPP (purchasing
- 3. Why do we need GDP per capita?
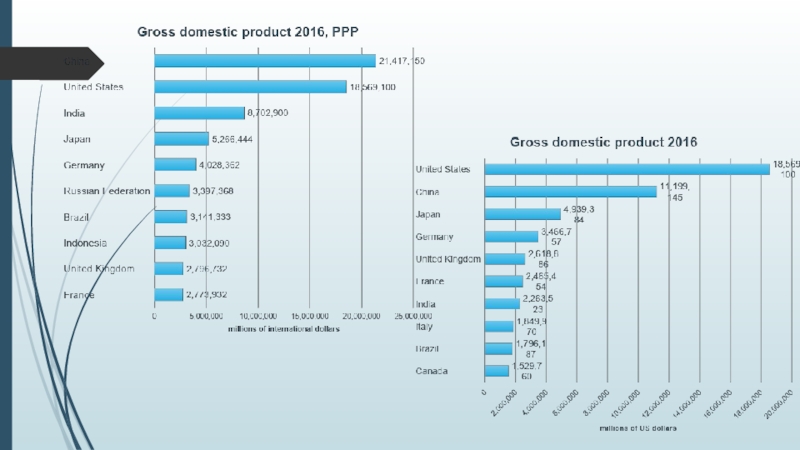
- 4. GDP (2016) GDP per capita (2016)
- 5. Why do we need GDP per capita?
- 6. The most productive countries (2015) NB: Working
- 8. Labour productivity Labour productivity is defined as
- 10. Labour productivity and utilization Labour productivity growth
- 12. Multifactor productivity Multifactor productivity (MFP) reflects the
- 14. What Is Purchasing Power Parity? Macroeconomic analysis
- 15. PPP calculation Problem: To make a comparison
- 16. The Big Mac Index: an example of
- 18. GDP with PPP Example: One way to
- 19. Transport Costs: Goods that are not available
- 20. Venezuela case
- 21. From the 10 years of military dictatorship
- 22. By 1950, as the rest of the
- 23. The Downfall of Venezuela’s Economy From 1950
- 25. Although oil revenues are tempting to rely
- 26. The graphic shows Venezuela’s oil revenues (in
- 27. Nicolás Maduro, who took over after the
- 28. The details of today’s crisis and intense
Prof. Zharova LiubovZharova_l@ua.fm")
Слайд 2GDP Per Capita / GDP PPP (purchasing parity power)
GDP per
capita = GDP / Population (number of people in the country)
The per capita GDP is especially useful when comparing one country to another, because it shows the relative performance of the countries. A rise in per capita GDP signals growth in the economy and tends to reflect an increase in productivity.
The per capita GDP is especially useful when comparing one country to another, because it shows the relative performance of the countries. A rise in per capita GDP signals growth in the economy and tends to reflect an increase in productivity.
 GDP per capita = GDP /")
Слайд 3Why do we need GDP per capita?
sometimes used as an indicator
of standard of living, with higher per capita GDP equating to a higher standard of living.
NB: A standard of living is the level of wealth, comfort, material goods and necessities available to a certain socioeconomic class or a certain geographic area. The standard of living includes factors such as income, gross domestic product, national economic growth, economic and political stability, political and religious freedom, environmental quality, climate, and safety. The standard of living is closely related to quality of life.
NB: A standard of living is the level of wealth, comfort, material goods and necessities available to a certain socioeconomic class or a certain geographic area. The standard of living includes factors such as income, gross domestic product, national economic growth, economic and political stability, political and religious freedom, environmental quality, climate, and safety. The standard of living is closely related to quality of life.

GDP per capita (2016)")
Слайд 5Why do we need GDP per capita?
can also be used to
measure the productivity of a country's workforce, as it measures the total output of goods and services per each member of the workforce in a given nation. (better measure of worker productivity may be GDP per hours worked (?) - per capita GDP does not take into account the influence of technology over a worker's output. If two countries each have a workforce that possesses an equal measure of per capita GDP, it appears that both nations hold an equal standard of living. However, a further examination of GDP per hours worked offers a different view of worker efficiency. The country with the lower GDP per hours worked actually enjoys more leisure time.)
Methodology: Productivity is calculated by dividing each country's GDP by the average number of hours worked annually by all employed citizens. Hours worked include full-time and part-time workers, excluding holidays and vacation time.
Methodology: Productivity is calculated by dividing each country's GDP by the average number of hours worked annually by all employed citizens. Hours worked include full-time and part-time workers, excluding holidays and vacation time.

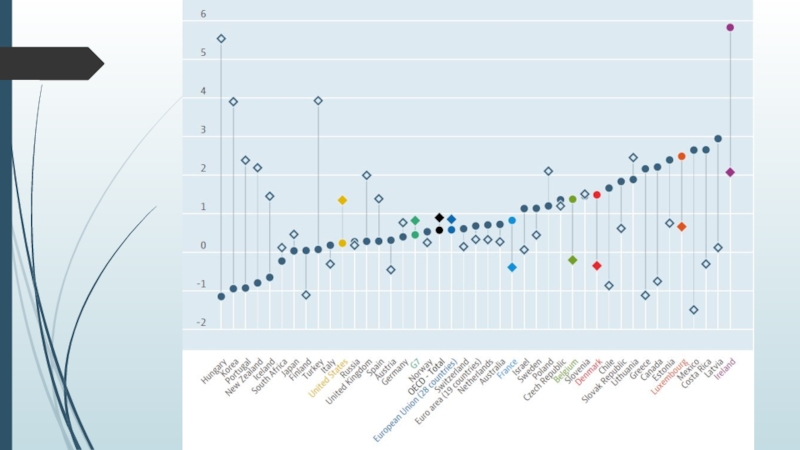
Слайд 6The most productive countries (2015)
NB: Working longer hours doesn't necessarily result
in increased productivity. Mexico—the least productive of the 38 countries listed in 2015 data from the Organization for Economic Cooperation and Development (OECD)—has the world's longest average work week at 41.2 hours (including full-time and part-time workers). At the other end of the spectrum, Luxembourg, the most productive country, has an average workweek of just 29 hours.
NB: Working longer hours doesn't necessarily result in increased productivity. Mexico—the")
Слайд 8Labour productivity
Labour productivity is defined as real gross domestic product (GDP)
per hour worked.
This captures the use of labour inputs better than just output per employee, with labour input defined as total hours worked by all persons involved.
The data are derived as average hours worked multiplied by the corresponding and consistent measure of employment for each particular country. Forecast is based on an assessment of the economic climate in individual countries and the world economy, using a combination of model-based analyses and expert judgement. This indicator is measured as an index with 2010=1.
 per hour worked. This")
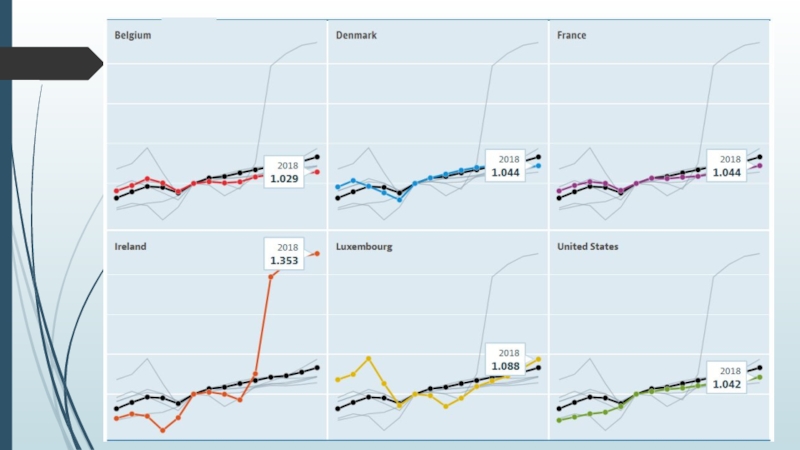
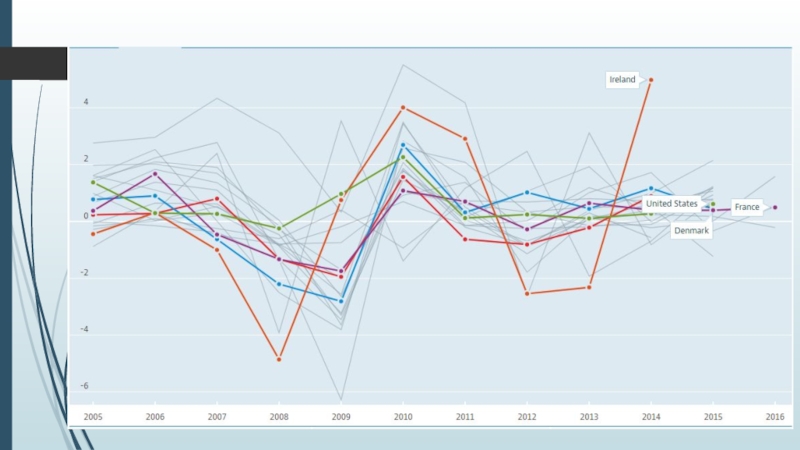
Слайд 10Labour productivity and utilization
Labour productivity growth is a key dimension of
economic performance and an essential driver of changes in living standards. Growth in gross domestic product (GDP) per capita can be broken down into growth in labour productivity, measured as growth in GDP per hour worked, and changes in the extent of labour utilisation, measured as changes in hours worked per capita. High labour productivity growth can reflect greater use of capital, and/or a decrease in the employment of low-productivity workers, or general efficiency gains and innovation

Слайд 12Multifactor productivity
Multifactor productivity (MFP) reflects the overall efficiency with which labour
and capital inputs are used together in the production process. Changes in MFP reflect the effects of changes in management practices, brand names, organizational change, general knowledge, network effects, spillovers from production factors, adjustment costs, economies of scale, the effects of imperfect competition and measurement errors.
Growth in MFP is measured as a residual, i.e. that part of GDP growth that cannot be explained by changes in labour and capital inputs. In simple terms therefore, if labour and capital inputs remained unchanged between two periods, any changes in output would reflect changes in MFP. This indicator is measured as an index and in annual growth rates.
Growth in MFP is measured as a residual, i.e. that part of GDP growth that cannot be explained by changes in labour and capital inputs. In simple terms therefore, if labour and capital inputs remained unchanged between two periods, any changes in output would reflect changes in MFP. This indicator is measured as an index and in annual growth rates.
 reflects the overall efficiency with which labour and capital inputs are")
Слайд 14What Is Purchasing Power Parity?
Macroeconomic analysis relies on several different metrics
to compare economic productivity and standards of living between countries and across time. One popular metric is purchasing power parity (PPP).
Purchasing Power Parity (PPP) is an economic theory that compares different countries' currencies through a market "basket of goods" approach. According to this concept, two currencies are in equilibrium or at par when a market basket of goods (taking into account the exchange rate) is priced the same in both countries.
Purchasing Power Parity (PPP) is an economic theory that compares different countries' currencies through a market "basket of goods" approach. According to this concept, two currencies are in equilibrium or at par when a market basket of goods (taking into account the exchange rate) is priced the same in both countries.
Where:
S represents exchange rate of currency 1 to currency 2
P1 represents the cost of good "x" in currency 1
P2 represents the cost of good "x" in currency

Слайд 15PPP calculation
Problem: To make a comparison of prices across countries that
holds any type of meaning, a wide range of goods and services must be considered. The amount of data that must be collected, and the complexity of drawing comparisons makes this process difficult.
Solution: To facilitate this, the International Comparisons Program (ICP) (established in 1968 by the University of Pennsylvania and UN). Purchasing power parities generated by the ICP are based on a worldwide price survey that compares the prices of hundreds of various goods. This data, in turn, helps international macroeconomists come up with estimates of global productivity and growth.
Correction & Updating: Every three years, the World Bank constructs and releases a report that compares various countries in terms of PPP and U.S. dollars.
Usage: Both the International Monetary Fund (IMF) and the Organization for Economic Cooperation and Development (OECD) use weights based on PPP metrics to make predictions and recommend economic policy.
These actions often impact financial markets in the short run. Some forex traders also use PPP to find potentially overvalued or undervalued currencies. Investors who hold stock or bonds of foreign companies may survey PPP figures to predict the impact of exchange-rate fluctuations on a country's economy.

Слайд 16The Big Mac Index: an example of PPP
(The Economist)
Prehistory: The Economist
has tracked the price of McDonald's Corp.’s (MCD) Big Mac burger in many countries since 1986.The highly publicized Big Mac Index is used to measure the purchasing power parity (PPP) between nations, using the price of a Big Mac as the benchmark. The Big Mac index suggests that, in theory, changes in exchange rates between currencies should affect the price that consumers pay for a Big Mac in a particular nation, replacing the "basket" with the famous hamburger.
Example: if the price of a Big Mac is $4.00 in the U.S. as compared to 2.5 pounds sterling in Britain, we would expect that the exchange rate would be 1.60 (4/2.5 = 1.60). If the exchange rate of dollars to pounds is any greater, the Big Mac Index would state that the pound was overvalued, any lower and it would be under-valued.
Flaws: (1) the Big Mac's price is decided by McDonald's Corp. and can significantly affect the Big Mac index. (2) the Big Mac differs across the world in size, ingredients, and availability.
Prehistory: The Economist has tracked the")
Слайд 18GDP with PPP
Example: One way to think of what GDP with
PPP represents is to imagine the total collective purchasing power of Japan if it were used to make the same purchases in U.S. markets. This only works after all yen are exchanged for dollars, otherwise, the comparison does not make sense. The net effect is to describe how many dollars it takes to buy $1 worth of goods in Japan as opposed to in the U.S.
GDP at PPP reflects the purchasing power of a citizen in one country to a citizen of another.
BUT (!) empirical evidence has shown that for many goods and baskets of goods, PPP is not observed in the short-term, and there is uncertainty over whether it applies in the long-term
GDP at PPP reflects the purchasing power of a citizen in one country to a citizen of another.
BUT (!) empirical evidence has shown that for many goods and baskets of goods, PPP is not observed in the short-term, and there is uncertainty over whether it applies in the long-term
“Burgernomics” by Michael Pakko and Patricia Pollard (2003) explores the Big Mac Index and PPP and cites several confounding factors as to why PPP theory does not line up with reality.

Слайд 19Transport Costs: Goods that are not available locally will need to
be imported, resulting in transport costs. Imported goods will consequently sell at a relatively higher price than the same goods available from local sources.
Taxes: When government sales taxes, such as value-added tax (VAT), are high in one country relative to another, this means goods will sell at a relatively higher price in the high-tax country.
Government Intervention: Import tariffs add to the price of imported goods. Where these are used to restrict supply, demand rises, causing the price of the goods to rise as well. In countries where the same good is unrestricted and abundant, its price will be lower. Governments that restrict exports will see a good's price rise in importing countries facing a shortage, and fall in exporting countries where its supply is increasing.
Non-Traded Services: those costs are unlikely to be at parity internationally. These costs can include the cost of the storefront, and other expenses such as insurance, heating and the cost of labor.
Market Competition: Goods might be deliberately priced higher in a country because the company has a competitive advantage over other sellers, either because it has a monopoly or is part of a cartel of companies that manipulate prices. The company's sought-after brand might allow it to sell at a premium price as well. Conversely, it might take years of offering goods at a reduced price to establish a brand and add a premium, especially if there are cultural or political hurdles to overcome.


Слайд 21From the 10 years of military dictatorship between 1948-1958 to the
impeachment of Carlos Andrés Pérez for corruption in 1993, Venezuelan politics have often been both rocky and eventful.
But despite these challenges throughout its history, no one has ever denied Venezuela’s economic potential. After the discovery of oil in the early 20th century, the nation quickly built its economy on back of black gold – and even today, Venezuela leads the world in proven oil reserves with 300 billion barrels.
But despite these challenges throughout its history, no one has ever denied Venezuela’s economic potential. After the discovery of oil in the early 20th century, the nation quickly built its economy on back of black gold – and even today, Venezuela leads the world in proven oil reserves with 300 billion barrels.

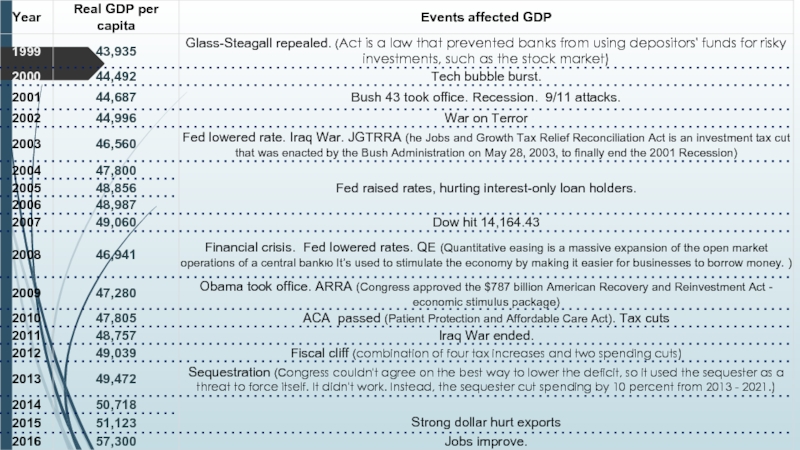
Слайд 22By 1950, as the rest of the world was struggling to
recover from World War II, Venezuela had the fourth-richest GDP per capita on Earth. The country was 2x richer than Chile, 4x richer than Japan, and 12x richer than China!
Unfortunately for Venezuela, this wealth wouldn’t last – and an over-reliance on oil would soon decimate the economy in unexpected ways.

Слайд 23The Downfall of Venezuela’s Economy
From 1950 to the early 1980s, the
Venezuelan economy experienced steady growth.
By 1982, Venezuela was still the richest major economy in Latin America. The country used its vast oil wealth to pay for social programs, including health care, education, transport, and food subsidies. Workers in Venezuela were among the highest paid in the region.
However, from there things went quickly downhill. In the mid-1980s, an oil glut and a free-falling oil price ended up decimating the Venezuelan economy, which was unable to diversify away from energy.
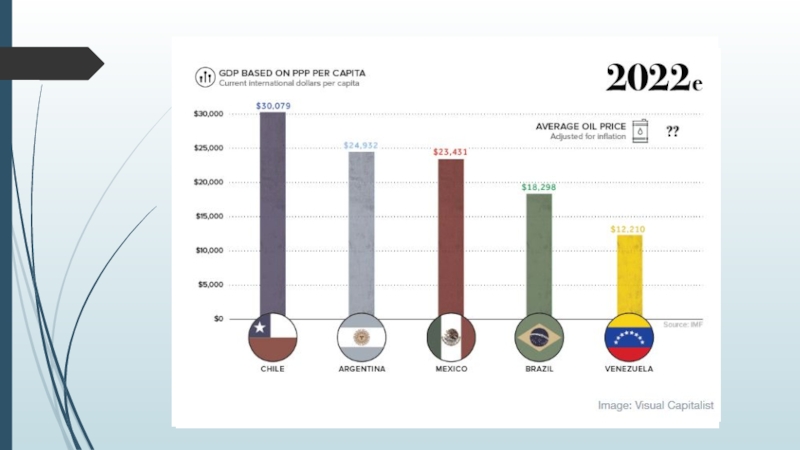
Today, Venezuela has one of the poorest major economies in Latin America – and as the current crisis rides itself out, the IMF foresees it getting far worse. By 2022, the organization predicts Venezuela’s GDP per capita (PPP) will be just $12,210, which would be a massive economic setback – the Venezuelan economy would be even poorer than it was many years before the Chávez era started.
By 1982, Venezuela was still the richest major economy in Latin America. The country used its vast oil wealth to pay for social programs, including health care, education, transport, and food subsidies. Workers in Venezuela were among the highest paid in the region.
However, from there things went quickly downhill. In the mid-1980s, an oil glut and a free-falling oil price ended up decimating the Venezuelan economy, which was unable to diversify away from energy.
Today, Venezuela has one of the poorest major economies in Latin America – and as the current crisis rides itself out, the IMF foresees it getting far worse. By 2022, the organization predicts Venezuela’s GDP per capita (PPP) will be just $12,210, which would be a massive economic setback – the Venezuelan economy would be even poorer than it was many years before the Chávez era started.

Слайд 25Although oil revenues are tempting to rely on to maintain social
order, they come with a degree of unpredictability. According to OPEC, Venezuela still relies on oil for 95% of its exports, which means that any fluctuations in oil price can be the difference between immense wealth and near-poverty.
After the oil glut in the 1980s, Venezuela’s oil revenues dropped significantly. It was then that Venezuela had its first bout with inflation, where rates peaked in 1989 (84.5% inflation) and later in 1996 (99.9% inflation). Without sufficient money coming in, the country had to rely on its printing presses in an attempt to maintain living standards
In 1998, Hugo Chávez was elected with the promise that Venezuela could reduce poverty and step up living standards by leaning even more heavily on its energy wealth. The recovery of oil prices helped this come true in the 2000s, and Chávez later passed away in office in 2013.

Слайд 26The graphic shows Venezuela’s oil revenues (in 2000 dollars) against the
rate of inflation – and it symbolizes the story of Venezuela’s recent economic history as succinctly as possible.
 against the rate of inflation –")
Слайд 27Nicolás Maduro, who took over after the death of his predecessor,
saw oil prices crash almost immediately, and it was clear that Venezuela’s intense battle with inflation was only just beginning. The national currency, the Venezuelan bolívar, would soon be almost worthless.

Слайд 28The details of today’s crisis and intense hyperinflation are widely shared.
(http://money.visualcapitalist.com/trajectory-venezuelan-hyperinflation-familiar/)
The country has massive shortages of food, electricity, and other essential goods, and violence is escalating in Caracas. More recently, the government is attempting to tighten its grip around power, and mismanagement of the economy has led to people starving on the streets. People are calling the situation a humanitarian crisis, which is extremely disheartening to see in what was once one of the richest countries on the planet.
And while the current condition of Venezuela is a tragedy in itself, the country’s inability to live up to its true economic potential is nearly just as devastating.
 The country has")