- Главная
- Разное
- Дизайн
- Бизнес и предпринимательство
- Аналитика
- Образование
- Развлечения
- Красота и здоровье
- Финансы
- Государство
- Путешествия
- Спорт
- Недвижимость
- Армия
- Графика
- Культурология
- Еда и кулинария
- Лингвистика
- Английский язык
- Астрономия
- Алгебра
- Биология
- География
- Детские презентации
- Информатика
- История
- Литература
- Маркетинг
- Математика
- Медицина
- Менеджмент
- Музыка
- МХК
- Немецкий язык
- ОБЖ
- Обществознание
- Окружающий мир
- Педагогика
- Русский язык
- Технология
- Физика
- Философия
- Химия
- Шаблоны, картинки для презентаций
- Экология
- Экономика
- Юриспруденция
Industrial Economics A: Structure, Conduct and Performance ( lecture 1 ) презентация
Содержание
- 1. Industrial Economics A: Structure, Conduct and Performance ( lecture 1 )
- 2. Module logistics See the module outline for
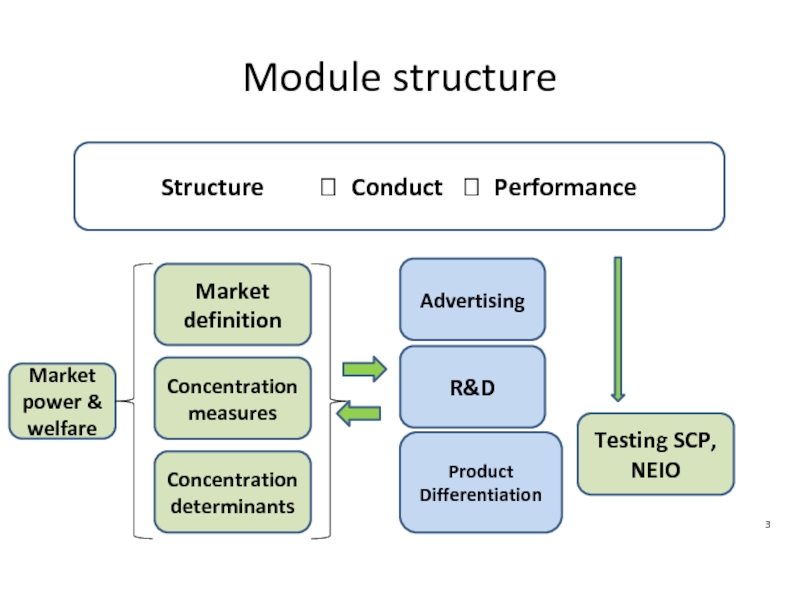
- 3. Module structure Structure
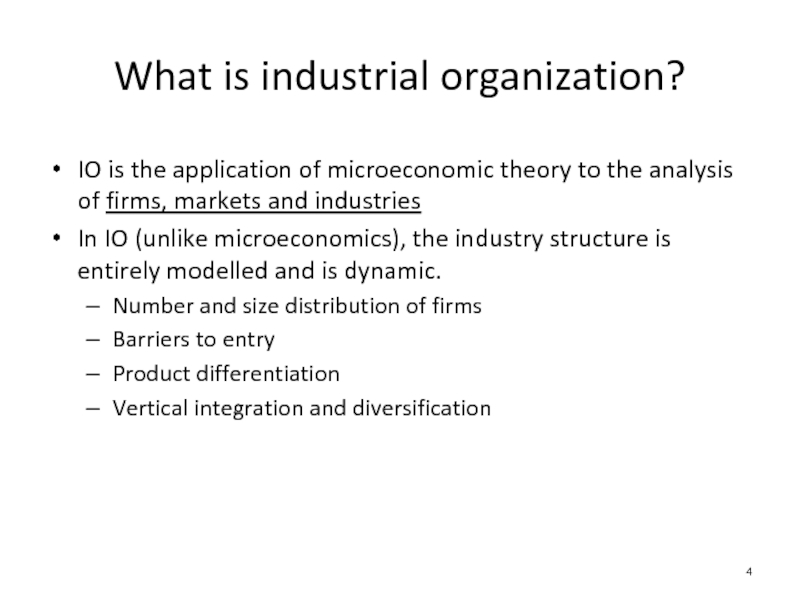
- 4. IO is the application of microeconomic theory
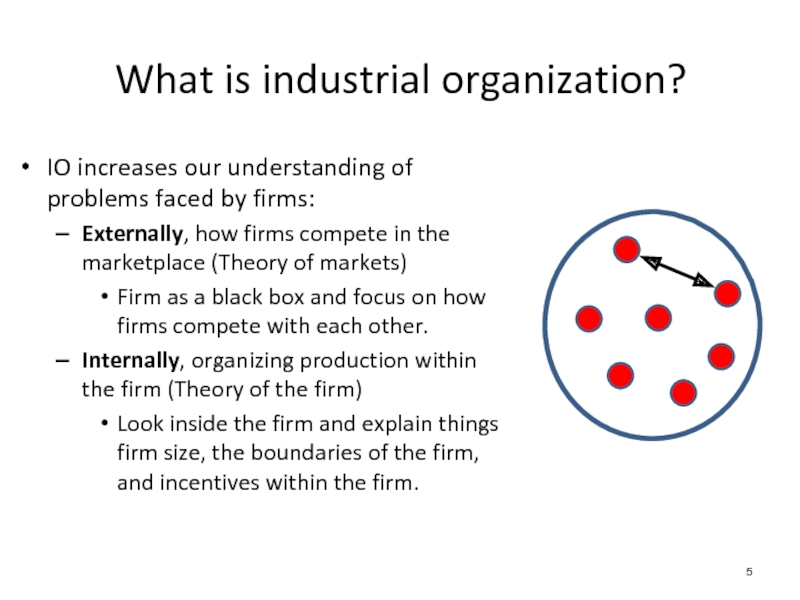
- 5. IO increases our understanding of problems faced
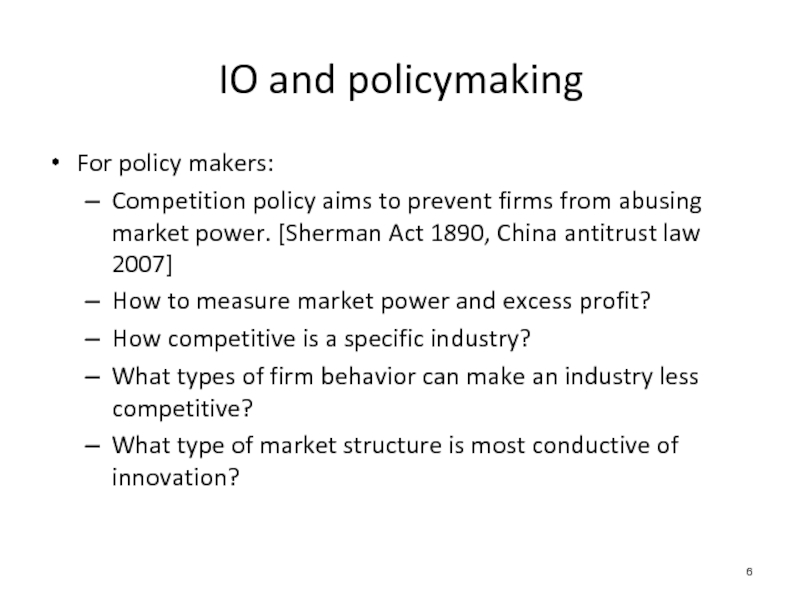
- 6. For policy makers: Competition policy aims to
- 7. 2010: The EU commission accuses Google of
- 8. Google could face a 3bn euros fine.
- 9. Typology of market structures
- 10. Dynamic theory where markets are changing due
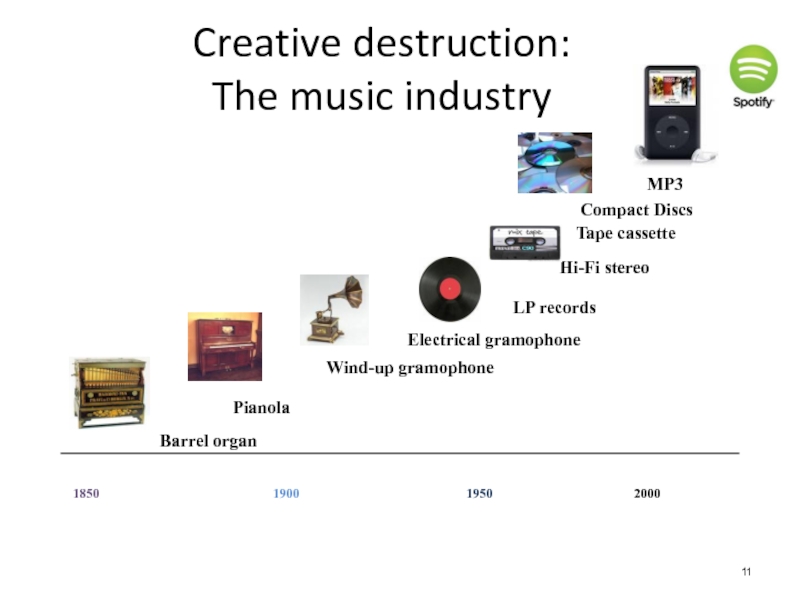
- 11. Creative destruction: The music industry 1850
- 12. The Chicago School The Chicago School (1970-80s):
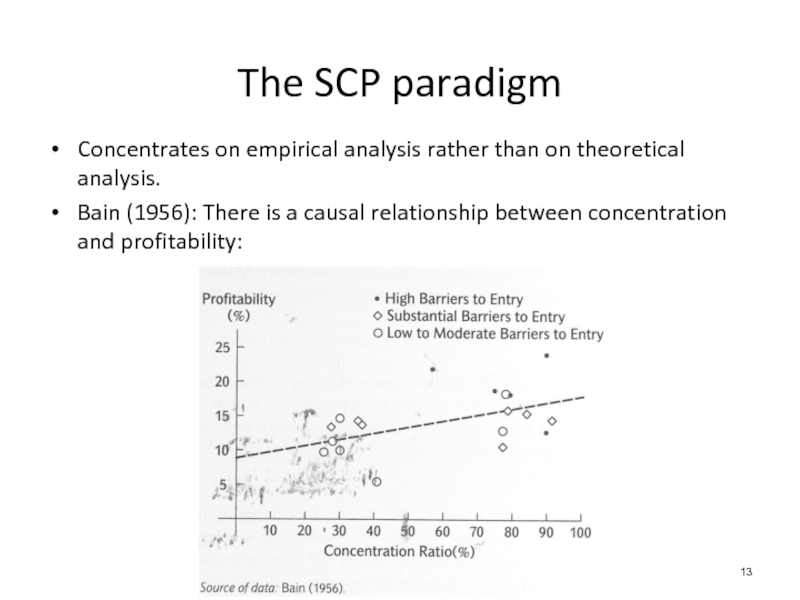
- 13. Concentrates on empirical analysis rather than on
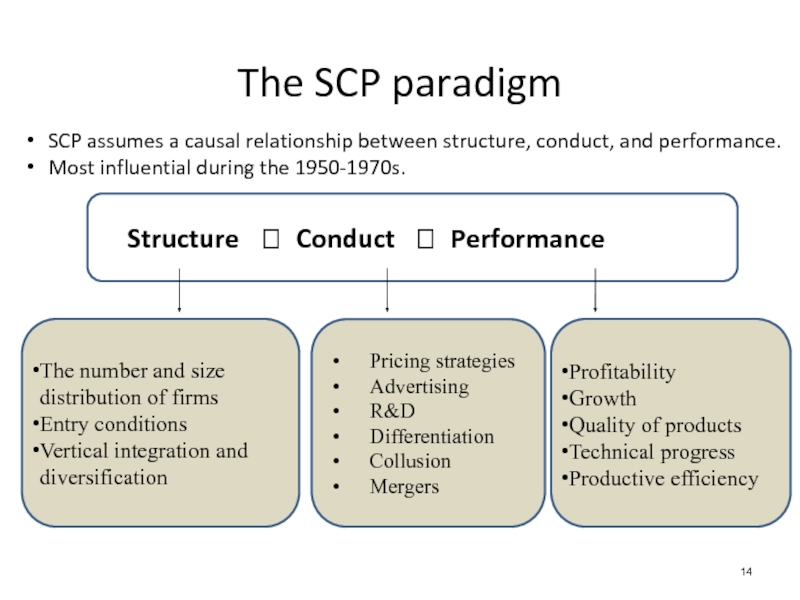
- 14. Structure ? Conduct ? Performance
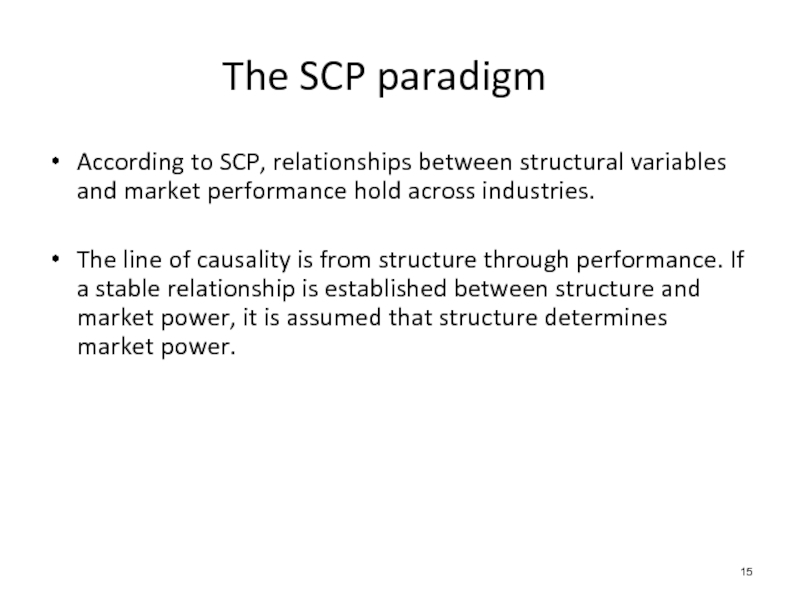
- 15. According to SCP, relationships between structural variables
- 16. SCP & European banking: Structure 1980s: European
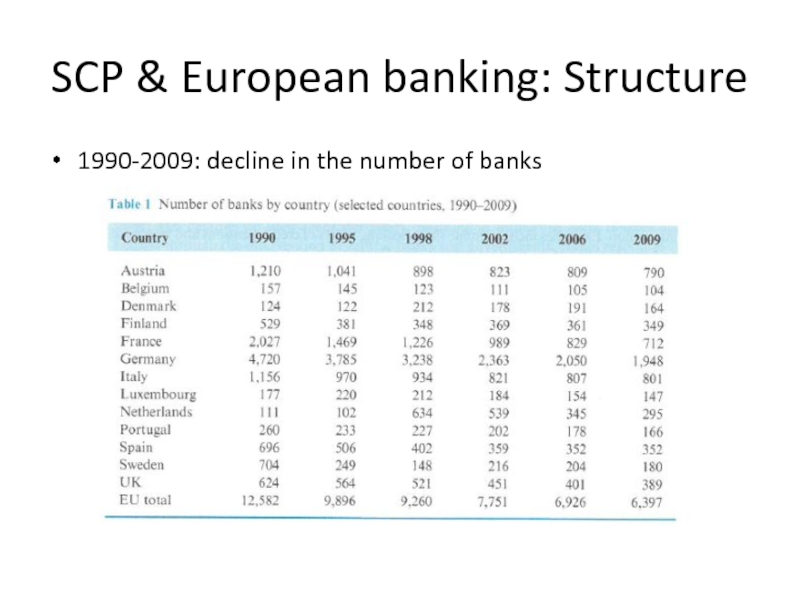
- 17. SCP & European banking: Structure 1990-2009: decline in the number of banks
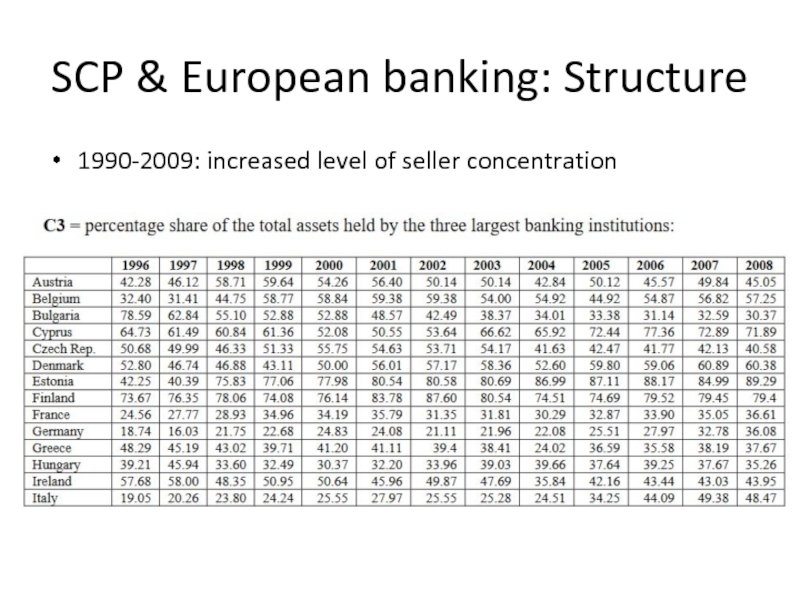
- 18. SCP & European banking: Structure 1990-2009: increased
- 19. SCP & European banking: Conduct Following the
- 20. SCP & European banking: Performance 1990-2006: increased
- 21. Structure ? Conduct
- 22. Structure ? Conduct
- 23. Profits in America and the practical
- 24. Profits in America
- 25. Profits in America - Historical developments In
- 26. Profits in America
- 27. Profits in America
- 28. Profits in America About 25% of America’s
- 29. Production and costs
- 30. Production and costs
- 31. Short run production
- 32. Short run costs
- 33. Long run costs In the long-run, firms
- 34. Long run costs
- 35. Application to oil pipelines Costs associated with
- 36. Application to oil pipelines Electricity costs vary
- 37. Economies of scale Economies of scale impact
- 38. Economies of scale
- 39. Empirical studies of economies of scale Some
- 40. Empirical studies of economies of scale Survivorship
- 41. Economies of scope Economies of scope are
- 42. Economies of scope Example 3: Umbrella advertising
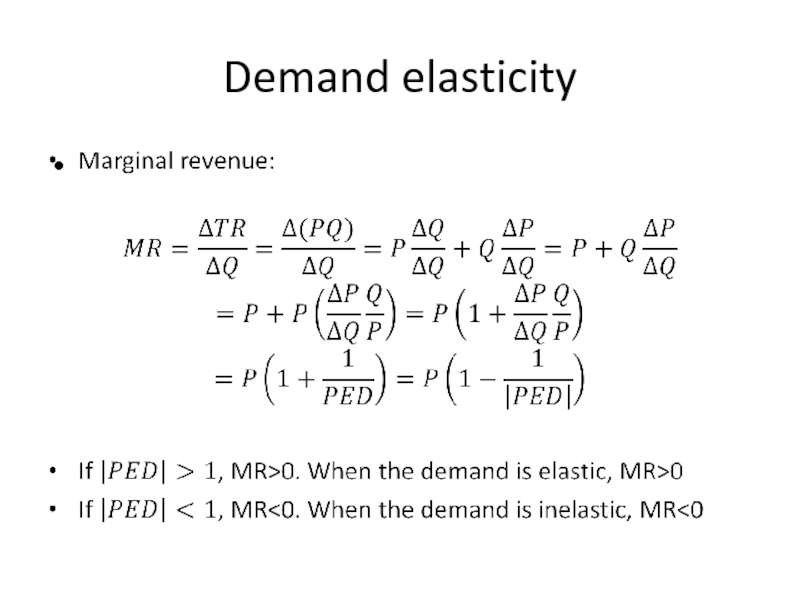
- 43. Demand elasticity
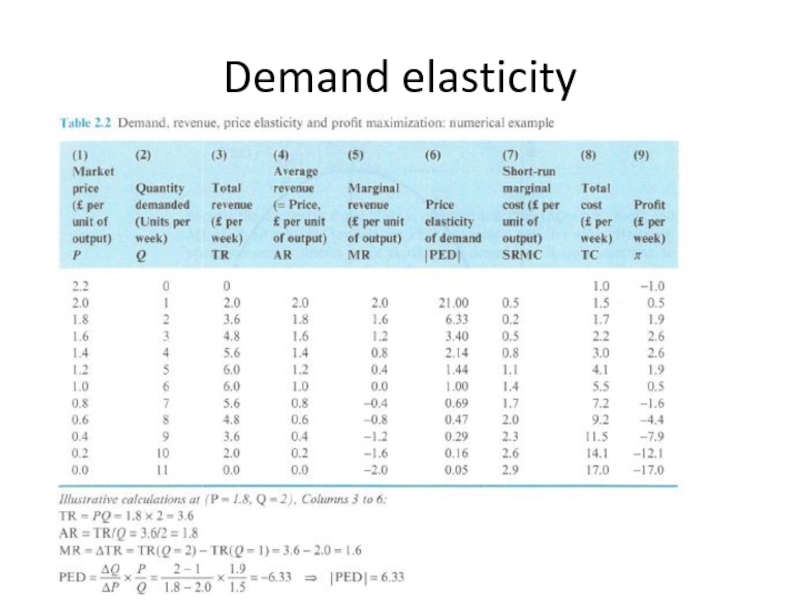
- 44. Demand elasticity
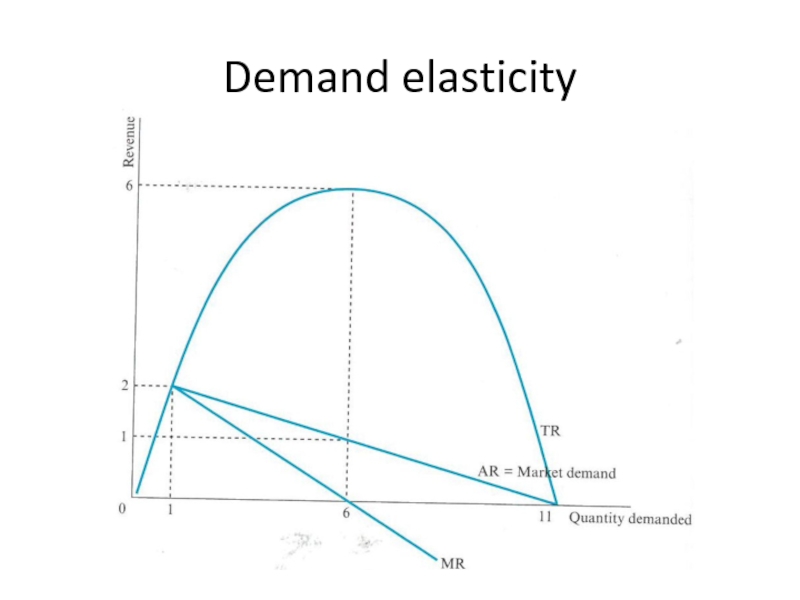
- 45. Demand elasticity
- 46. Demand elasticity
- 47. Cross-price elasticity of demand
- 48. IO views industries as dynamic entities Practical
Слайд 2Module logistics
See the module outline for details.
Some highlights:
Textbooks:
Lipczynski, Wilson and
Church
Assessment: 1.5 hour exam (70%), and an individual coursework (30%)
The seminar will take place during teaching weeks 9 and 10 (depending on your group).
Слайд 3Module structure
Structure ? Conduct
Market definition
Concentration measures
Concentration determinants
Testing SCP, NEIO
Advertising
R&D
Market power & welfare
Product Differentiation
Слайд 4IO is the application of microeconomic theory to the analysis of
In IO (unlike microeconomics), the industry structure is entirely modelled and is dynamic.
Number and size distribution of firms
Barriers to entry
Product differentiation
Vertical integration and diversification
What is industrial organization?
Слайд 5IO increases our understanding of problems faced by firms:
Externally, how firms
Firm as a black box and focus on how firms compete with each other.
Internally, organizing production within the firm (Theory of the firm)
Look inside the firm and explain things firm size, the boundaries of the firm, and incentives within the firm.
What is industrial organization?
Слайд 6For policy makers:
Competition policy aims to prevent firms from abusing market
How to measure market power and excess profit?
How competitive is a specific industry?
What types of firm behavior can make an industry less competitive?
What type of market structure is most conductive of innovation?
IO and policymaking
Слайд 72010: The EU commission accuses Google of promoting its shopping service
Google is accused of systematically favouring its own comparison shopping product in its general search results pages
http://europa.eu/rapid/press-release_IP-15-4780_en.htm
Google’s response:
“Economic data (…), and statements from complainants all confirm that product search is robustly competitive”.
Google claims that Google shopping is operating in a field that includes Amazon and eBay, where shoppers go to compare prices.
IO and policymaking: The Google
antitrust case
Слайд 8Google could face a 3bn euros fine.
Related to that case, IO
How to define a market?
How to measure market power?
How to stop dominant firms from abusing market power?
IO and policymaking: The Google
antitrust case
Слайд 10Dynamic theory where markets are changing due to the activities of
“Creative destruction” (Schumpeter, 1928): Competition is driven by innovation
Innovation destroys old products and processes and replaces them with new ones.
Innovators earn profits and imitation gradually erodes these profits by cutting prices and raising input costs.
Abnormal profits and market power are necessary to motivate firms to innovate, and improve products in the long run
Austrian School: Schumpeter
Слайд 11Creative destruction:
The music industry
1850
1900
1950
2000
Wind-up gramophone
Barrel organ
Pianola
Hi-Fi stereo
LP records
Tape cassette
MP3
Compact Discs
Electrical
Слайд 12The Chicago School
The Chicago School (1970-80s): Also argues against government intervention
Large
In the long run abuse of market power is unlikely, e.g. collusive agreements are unstable
Markets have a tendency to revert towards competition, without the need for government intervention
Слайд 13Concentrates on empirical analysis rather than on theoretical analysis.
Bain (1956): There
The SCP paradigm
Слайд 14
Structure ? Conduct ? Performance
The SCP paradigm
The number and size
Entry conditions
Vertical integration and diversification
Pricing strategies
Advertising
R&D
Differentiation
Collusion
Mergers
Profitability
Growth
Quality of products
Technical progress
Productive efficiency
SCP assumes a causal relationship between structure, conduct, and performance.
Most influential during the 1950-1970s.
Слайд 15According to SCP, relationships between structural variables and market performance hold
The line of causality is from structure through performance. If a stable relationship is established between structure and market power, it is assumed that structure determines market power.
The SCP paradigm
Слайд 16SCP & European banking: Structure
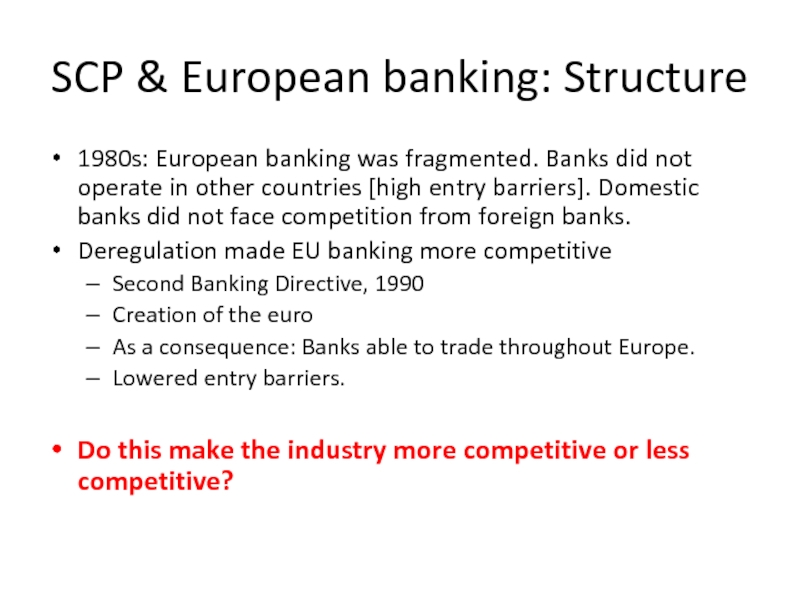
1980s: European banking was fragmented. Banks did
Deregulation made EU banking more competitive
Second Banking Directive, 1990
Creation of the euro
As a consequence: Banks able to trade throughout Europe.
Lowered entry barriers.
Do this make the industry more competitive or less competitive?
Слайд 19SCP & European banking: Conduct
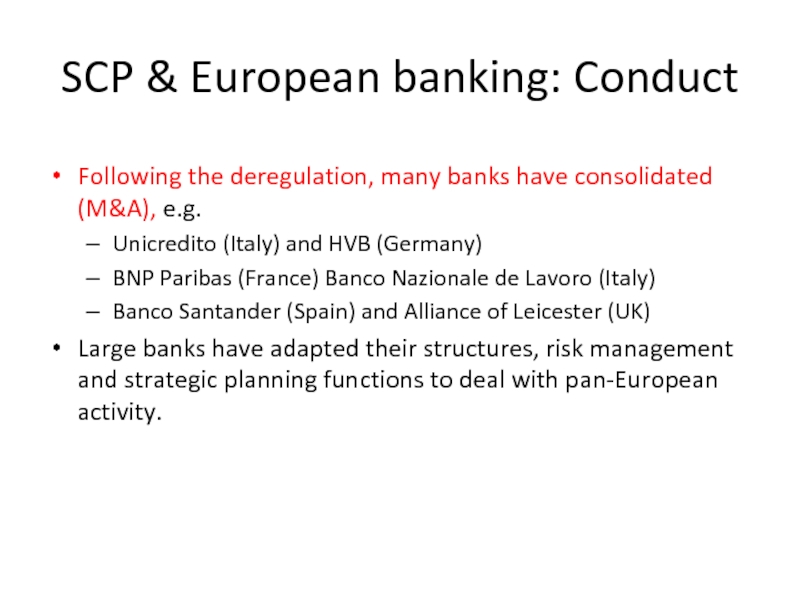
Following the deregulation, many banks have consolidated
Unicredito (Italy) and HVB (Germany)
BNP Paribas (France) Banco Nazionale de Lavoro (Italy)
Banco Santander (Spain) and Alliance of Leicester (UK)
Large banks have adapted their structures, risk management and strategic planning functions to deal with pan-European activity.
Слайд 20SCP & European banking: Performance
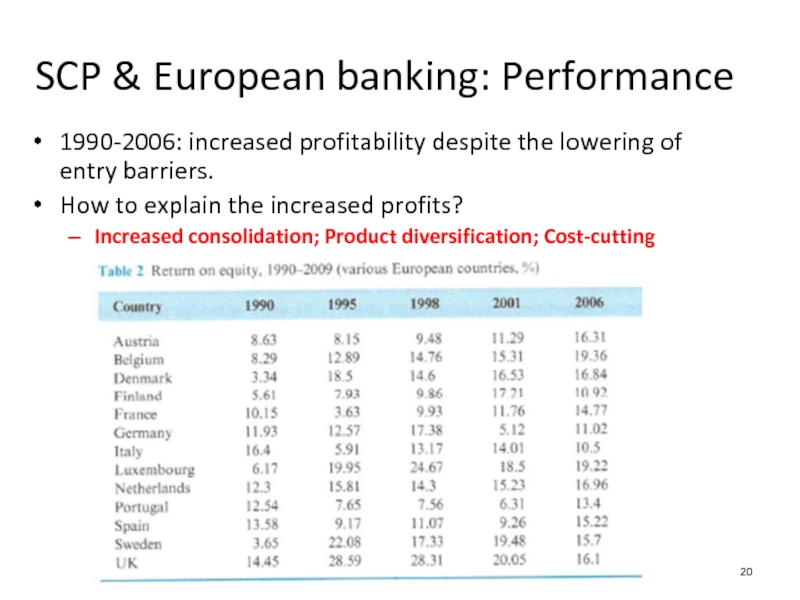
1990-2006: increased profitability despite the lowering of
How to explain the increased profits?
Increased consolidation; Product diversification; Cost-cutting
Слайд 21
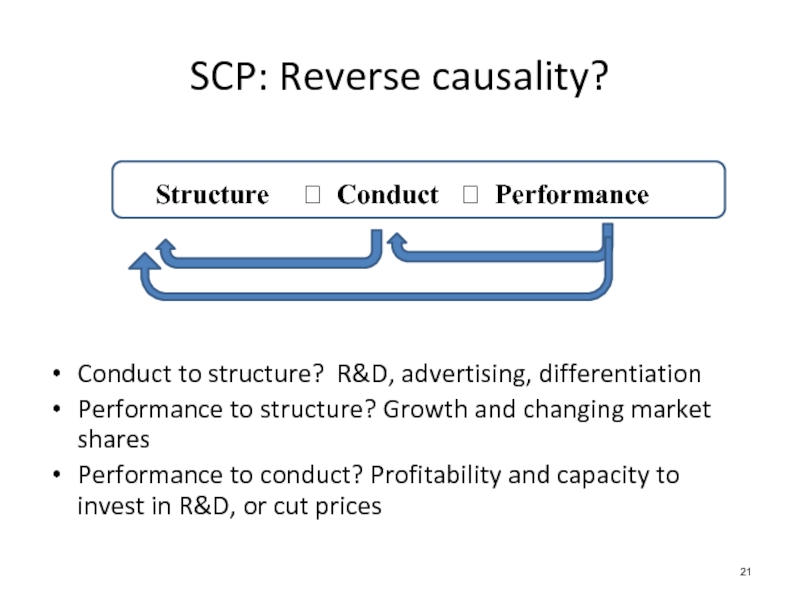
Structure ? Conduct ? Performance
Conduct to structure? R&D,
Performance to structure? Growth and changing market shares
Performance to conduct? Profitability and capacity to invest in R&D, or cut prices
SCP: Reverse causality?
Слайд 22
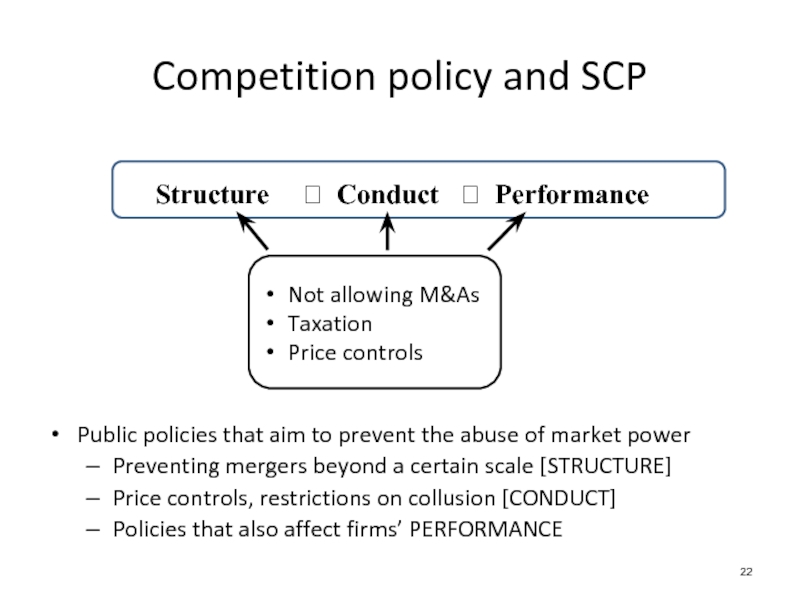
Structure ? Conduct ? Performance
Public policies that aim
Preventing mergers beyond a certain scale [STRUCTURE]
Price controls, restrictions on collusion [CONDUCT]
Policies that also affect firms’ PERFORMANCE
Competition policy and SCP
Not allowing M&As
Taxation
Price controls
Слайд 23Profits in America and the
practical relevance of IO
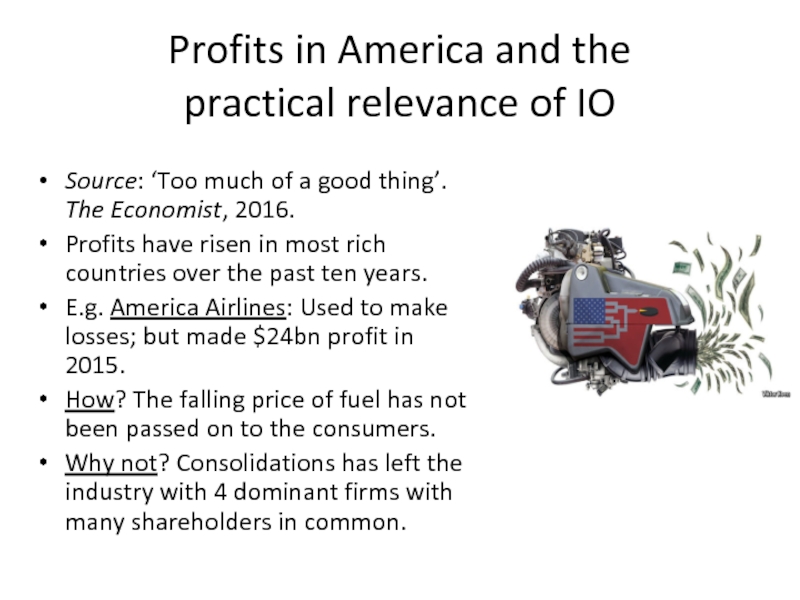
Source: ‘Too much
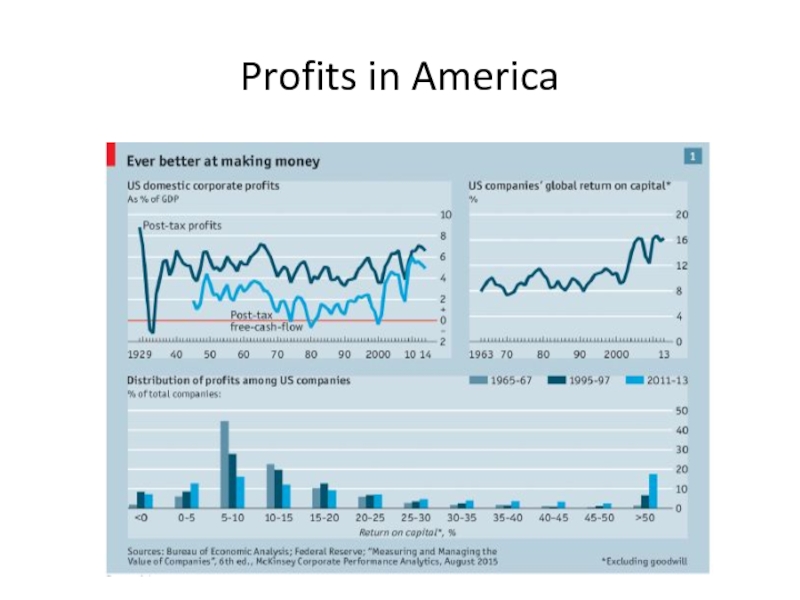
Profits have risen in most rich countries over the past ten years.
E.g. America Airlines: Used to make losses; but made $24bn profit in 2015.
How? The falling price of fuel has not been passed on to the consumers.
Why not? Consolidations has left the industry with 4 dominant firms with many shareholders in common.
Слайд 25Profits in America
- Historical developments
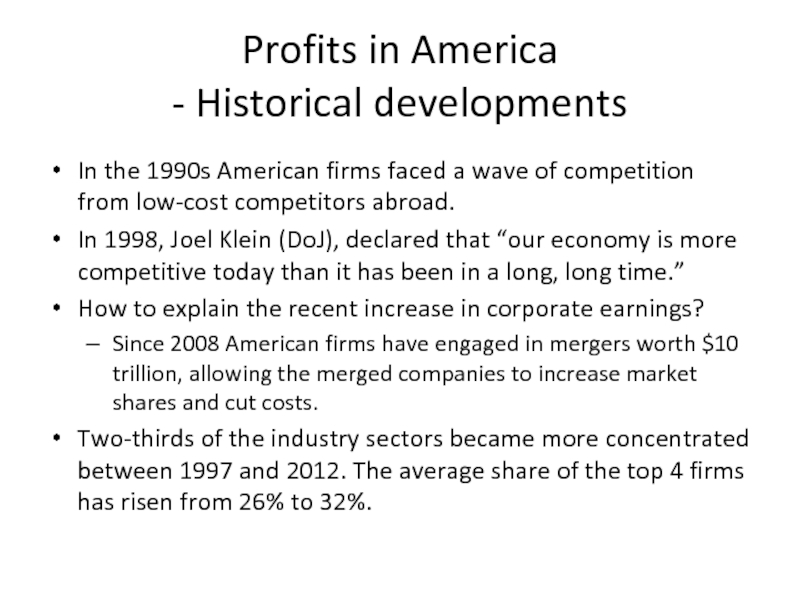
In the 1990s American firms faced a
In 1998, Joel Klein (DoJ), declared that “our economy is more competitive today than it has been in a long, long time.”
How to explain the recent increase in corporate earnings?
Since 2008 American firms have engaged in mergers worth $10 trillion, allowing the merged companies to increase market shares and cut costs.
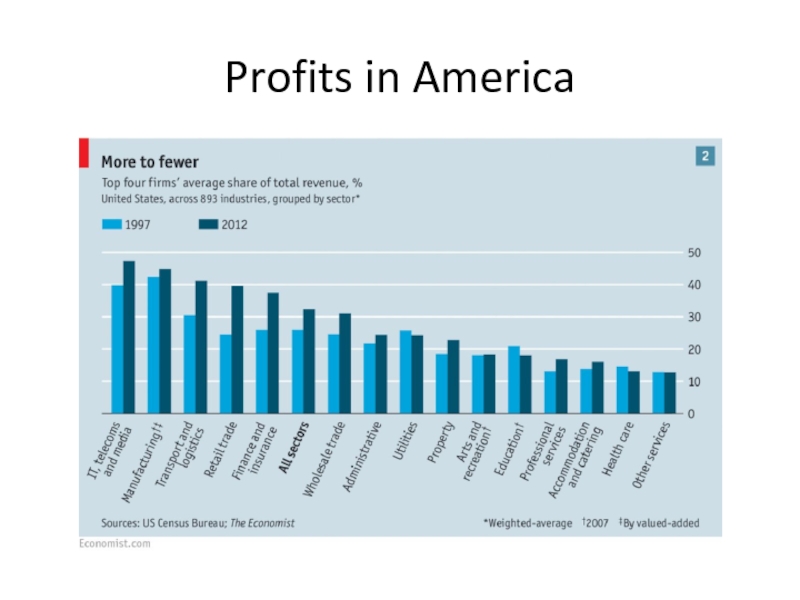
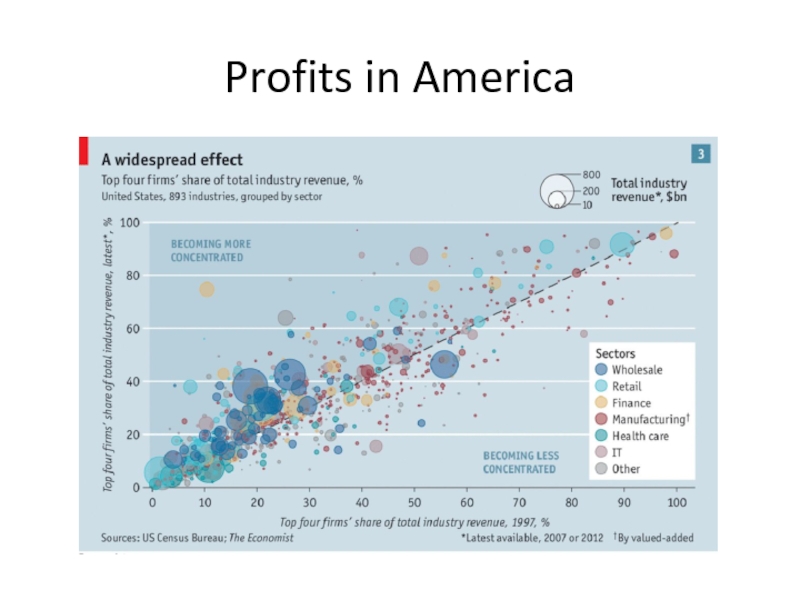
Two-thirds of the industry sectors became more concentrated between 1997 and 2012. The average share of the top 4 firms has risen from 26% to 32%.
Слайд 28Profits in America
About 25% of America’s abnormal profits are spread across
Another 25% comes from the health-care industry (pharmaceutical and medical-equipment). Patent rules allow temporary monopolies on new drugs and inventions. Much of health-care purchasing is controlled by insurance firms. Four of the largest, Anthem, Cigna, Aetna and Humana, are planning to merge into two larger firms.
The remaining 50% abnormal profits are in the technology sector, where firms such as Google and Facebook enjoy market shares of 40% or more.
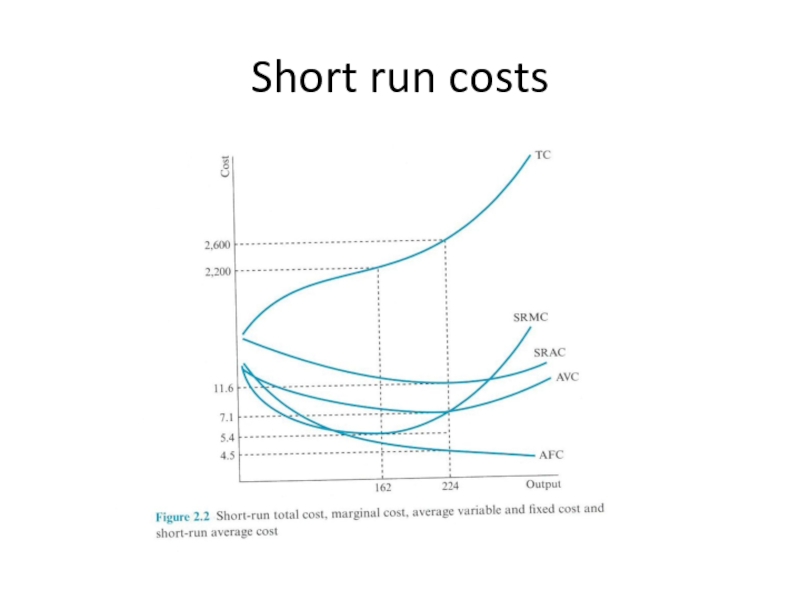
Слайд 33Long run costs
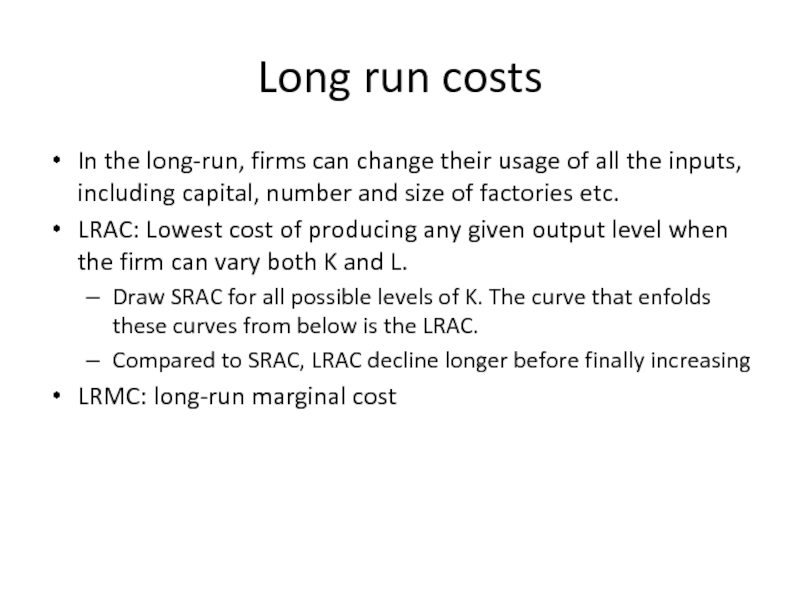
In the long-run, firms can change their usage of
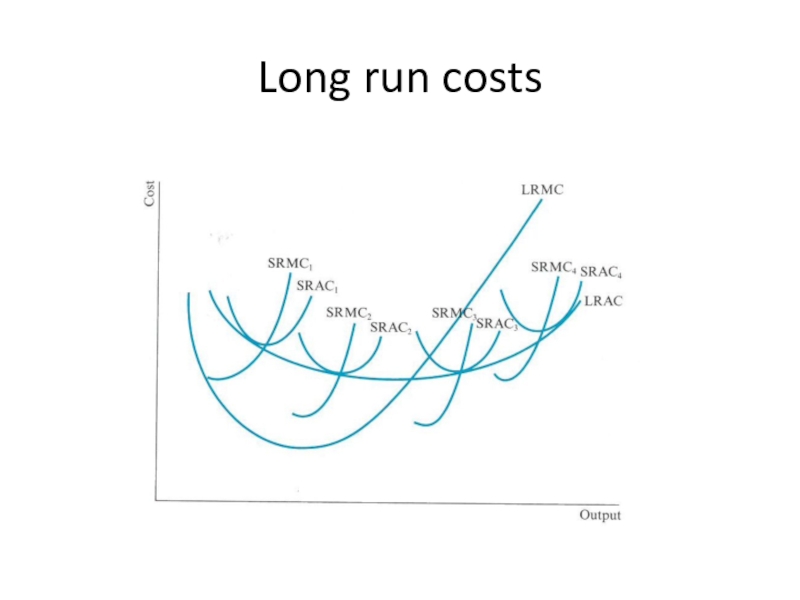
LRAC: Lowest cost of producing any given output level when the firm can vary both K and L.
Draw SRAC for all possible levels of K. The curve that enfolds these curves from below is the LRAC.
Compared to SRAC, LRAC decline longer before finally increasing
LRMC: long-run marginal cost
Слайд 35Application to oil pipelines
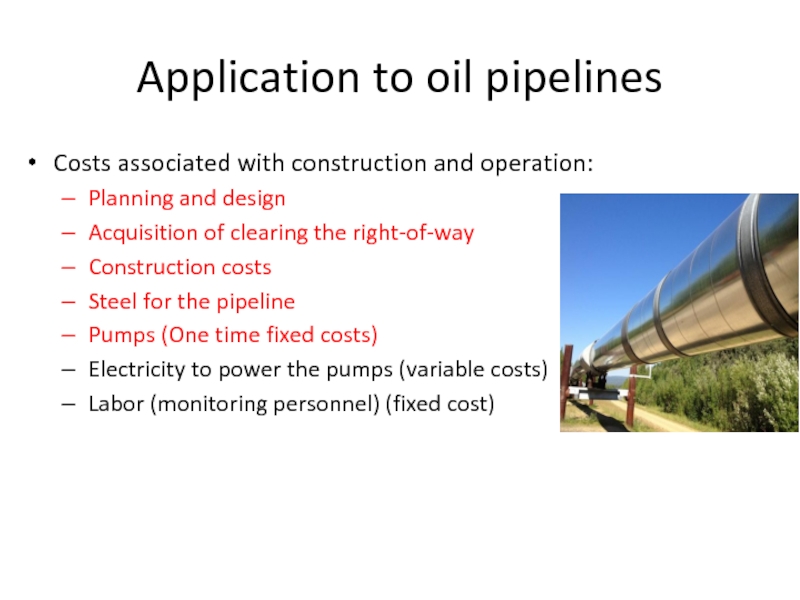
Costs associated with construction and operation:
Planning and design
Acquisition
Construction costs
Steel for the pipeline
Pumps (One time fixed costs)
Electricity to power the pumps (variable costs)
Labor (monitoring personnel) (fixed cost)
Слайд 36Application to oil pipelines
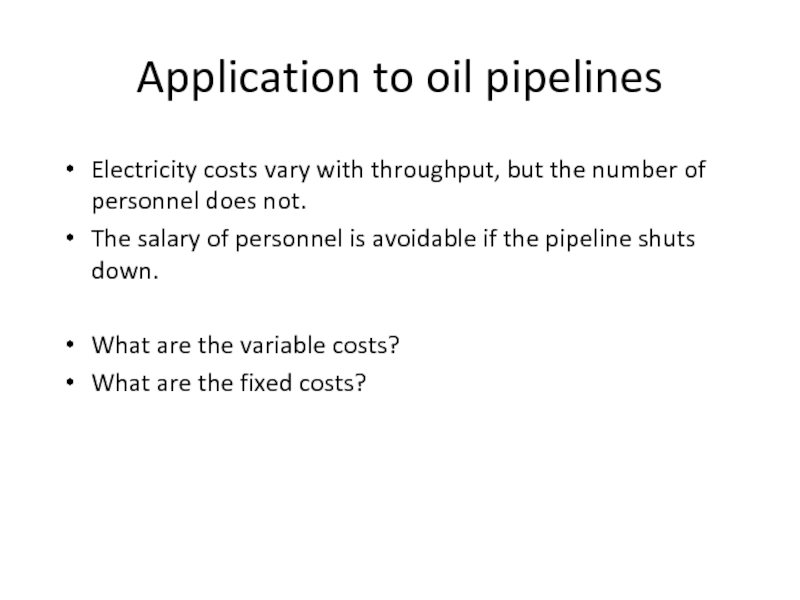
Electricity costs vary with throughput, but the number
The salary of personnel is avoidable if the pipeline shuts down.
What are the variable costs?
What are the fixed costs?
Слайд 37Economies of scale
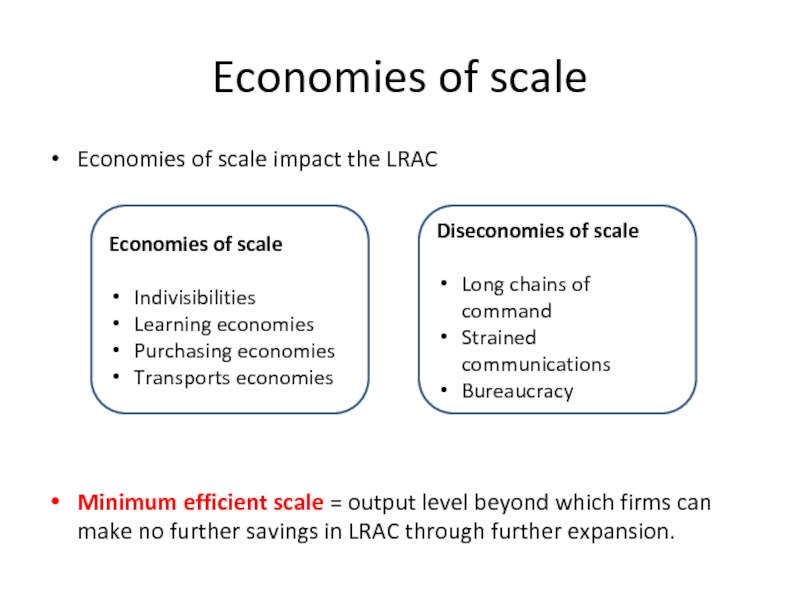
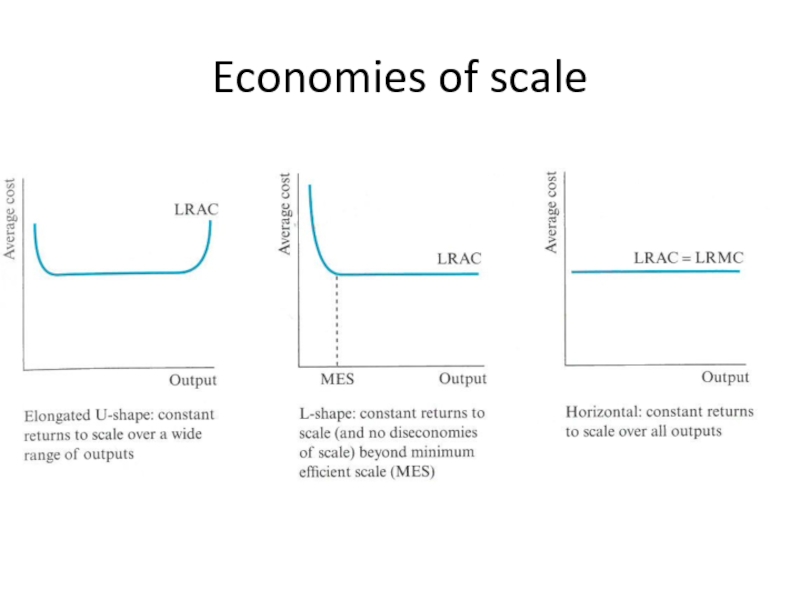
Economies of scale impact the LRAC
Minimum efficient scale =
Economies of scale
Indivisibilities
Learning economies
Purchasing economies
Transports economies
Diseconomies of scale
Long chains of command
Strained communications
Bureaucracy
Слайд 39Empirical studies of economies of scale
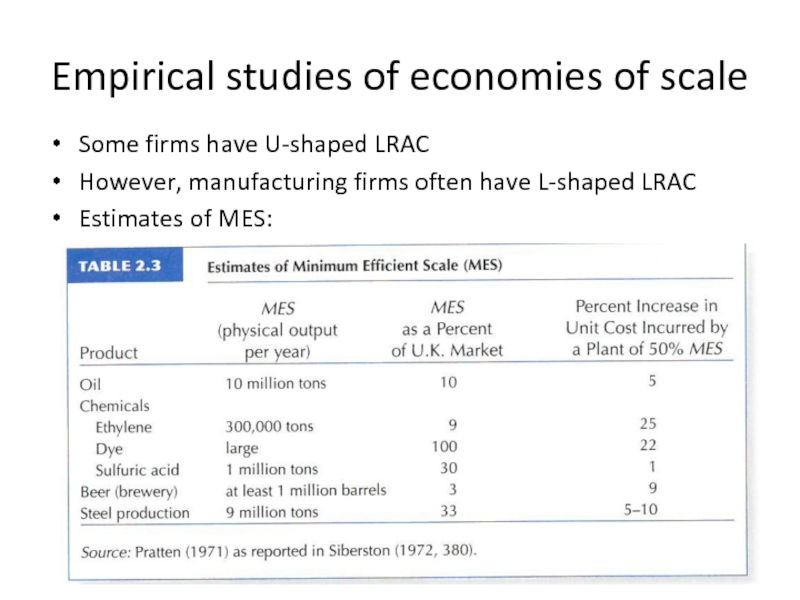
Some firms have U-shaped LRAC
However, manufacturing
Estimates of MES:
Слайд 40Empirical studies of economies of scale
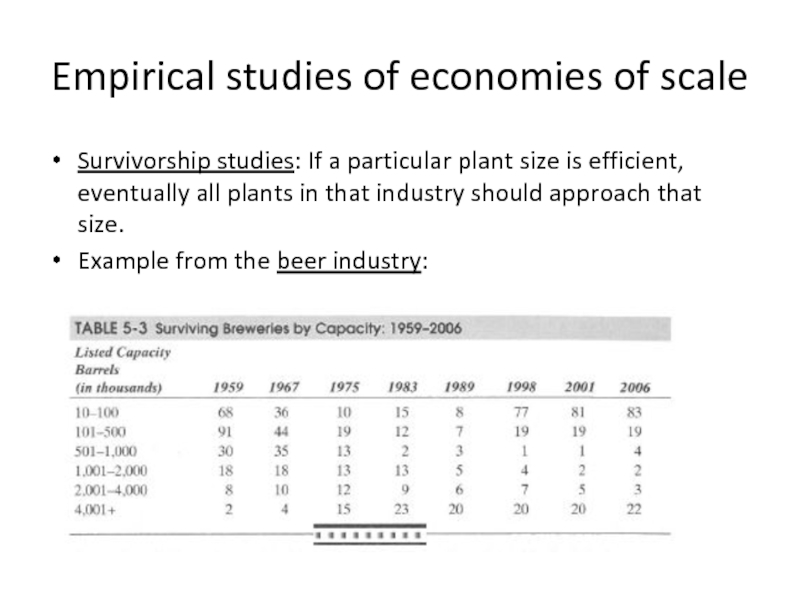
Survivorship studies: If a particular plant
Example from the beer industry:
Слайд 41Economies of scope
Economies of scope are the cost savings that arise
Example 1: Manufacturing process
Oil refineries produce gasoline and kerosene as part of the refining process
Example 2: Knowledge gained from developing, producing, or marketing one product can be applied to another product
R&D investment for a specific software can benefit other categories of softwares
Слайд 42Economies of scope
Example 3: Umbrella advertising
Advertising one Samsung product will lead
New products are easier to introduce when there is an established brand with the desired image.
Virgin: 400+ companies, active in railways, airlines, soda, mobile, media etc.
Слайд 47Cross-price elasticity of demand
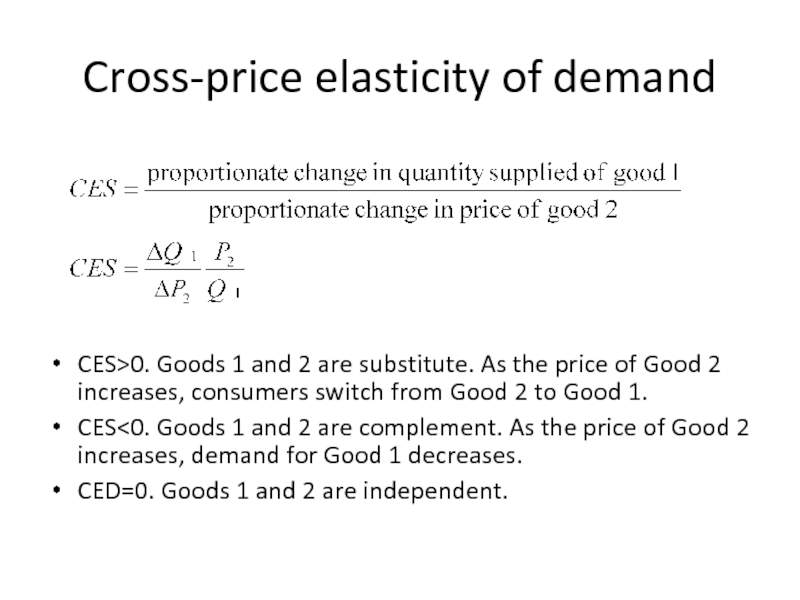
CES>0. Goods 1 and 2 are substitute. As
CES<0. Goods 1 and 2 are complement. As the price of Good 2 increases, demand for Good 1 decreases.
CED=0. Goods 1 and 2 are independent.
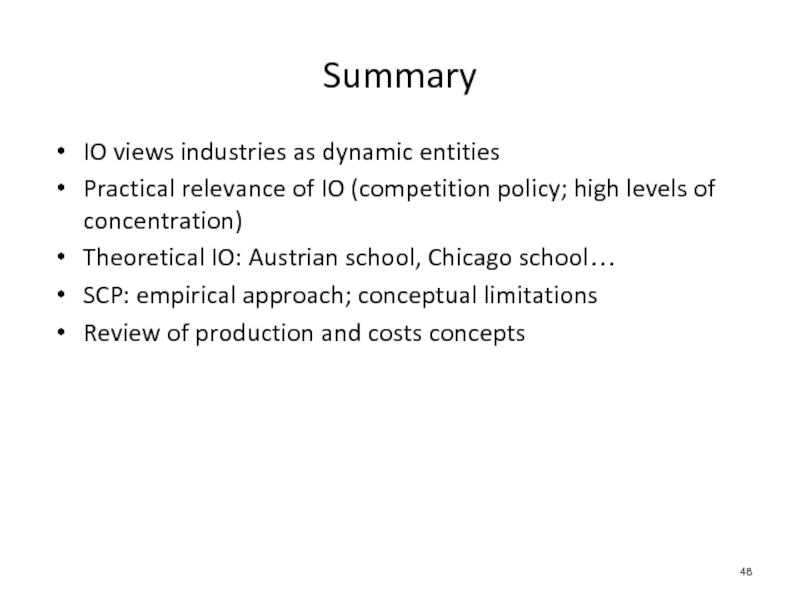
Слайд 48IO views industries as dynamic entities
Practical relevance of IO (competition policy;
Theoretical IO: Austrian school, Chicago school…
SCP: empirical approach; conceptual limitations
Review of production and costs concepts
Summary
