- Главная
- Разное
- Дизайн
- Бизнес и предпринимательство
- Аналитика
- Образование
- Развлечения
- Красота и здоровье
- Финансы
- Государство
- Путешествия
- Спорт
- Недвижимость
- Армия
- Графика
- Культурология
- Еда и кулинария
- Лингвистика
- Английский язык
- Астрономия
- Алгебра
- Биология
- География
- Детские презентации
- Информатика
- История
- Литература
- Маркетинг
- Математика
- Медицина
- Менеджмент
- Музыка
- МХК
- Немецкий язык
- ОБЖ
- Обществознание
- Окружающий мир
- Педагогика
- Русский язык
- Технология
- Физика
- Философия
- Химия
- Шаблоны, картинки для презентаций
- Экология
- Экономика
- Юриспруденция
Business statistics презентация
Содержание
- 1. Business statistics
- 2. LITERATURE 1. Siegel, Andrew F. Practical Business
- 3. 6.Сигел, Э. Практическая бизнес-статистика: Пер. с англ.
- 4. Business Statistics What and Why
- 5. Welcome to the world of statistics. This
- 6. The early chapters will introduce you to
- 7. Is knowledge of statistics really necessary to
- 8. Is statistics difficult? Statistics is no more
- 9. Although a few die-hard purists may
- 10. Does learning statistics decrease your decision-making flexibility?
- 11. Think of statistical methods as a
- 12. Introduction into Business Statistics
- 13. СHAPTER QUESTIONS Definition of the term ‘statistics’.
- 14. Statistics for Business and Economics, 6e ©
- 15. Introduction The word “statistics” is very popularly
- 16. Such statistics are quite commonly found
- 17. In addition to meaning numerical facts,
- 18. What is statistics? Statistics is the art
- 19. Definition There have been many definitions of
- 20. Statistics Looks at the Big Picture When
- 21. Statistics in Management What should a manager
- 22. To fulfill these roles, you do not
- 23. The five basic activities of statistics In
- 24. In the modeling phase, a system of
- 26. Designing a Plan for Data Collection -
- 27. Statistics is particularly useful when you have
- 28. The random sample is one
- 29. 1. You are guaranteed that the selection
- 30. Exploring the Data As soon as you
- 31. 1. By verifying that the expected relationships
- 32. Exploration is the first phase once you
- 33. Modeling the Data In statistics, a model
- 34. Here are some models that can be
- 35. 1. Consider a simple model that generates
- 36. Estimating an Unknown Quantity - produces
- 37. Estimating an Unknown Quantity Next period
- 38. Statistics can shed light on some of
- 39. Statistical estimation also provides an indication of
- 40. Hypothesis testing Statistical hypothesis testing is the
- 41. Here are some examples of hypothesis that
- 42. Note that each hypothesis makes a definite
- 44. What is “Statistics”? Statistics is the science
- 45. Statistical Methods The methods by which statistical
- 46. Statistical Methods There are five stages in
- 47. 2. Organization: Data from published sources
- 48. 3.Presentation: After the data have been
- 49. 5.Interpretation: Drawing conclusions from the data
- 50. Statistics: Science or Art Whether statistics is
- 51. Art, on the other hand, refers
- 52. Functions of Statistics Definiteness: To present general
- 53. Formulating and testing Hypothesis: Statistical methods are
- 54. Statistics for Business and Economics, 6e ©
- 55. Statistics for Business and Economics, 6e ©
- 56. Basic concepts of Statistics – Parameter
- 57. Basic concepts of Statistics
- 58. Basic concepts of Statistics
- 60. Statistics for Business and Economics, 6e ©
- 61. Key Definitions A parameter is a specific
- 62. Statistics for Business and Economics, 6e ©
- 63. Statistics for Business and Economics, 6e ©
- 64. Statistics for Business and Economics, 6e ©
- 65. Variables Traits or characteristics that can change
- 66. Types Of Variables In causal relationships: CAUSE
- 67. Types Of Variables •Discrete variables are measured
- 68. Statistics for Business and Economics, 6e ©
- 69. Descriptive Statistics Collect data e.g., Survey
- 70. Descriptive Statistics Summarize data e.g., Sample mean
- 71. Inferential Statistics •Take decision on overall population
- 72. Statistics for Business and Economics, 6e ©
- 73. Predictive Modeling The science of predicting future
- 74. Statistics for Business and Economics, 6e ©
- 75. Statistics for Managers Using Microsoft Excel, 4e
- 76. Statistics for Managers Using Microsoft Excel, 4e
- 77. Chap 1- Types of Data Examples: Marital
- 80. Problems associated with the collection
- 81. Problems associated with the collection of
- 82. How to design a questionnaire –
- 83. Appearance and layout of a questionnaire
- 84. Interview – Fieldworker completed questionnaire
- 85. Editing the data – Obvious
- 87. Levels of Measurement and Measurement Scales
- 88. Statistics for Managers Using Microsoft Excel, 4e
- 89. Chap 1- Types of Survey Errors Coverage
- 90. Chap 1- Types of Survey Errors Coverage
- 91. What do we expect from the statistical
Слайд 1BUSINESS STATISTICS
KOLESNIKOVA IRINA IVANOVNA
DEPARTMENT OF STATISTICS
2nd building, 217 room
(017) 209-88-51
KLSNK_A@TUT.BY
 209-88-51KLSNK_A@TUT.BY")
Слайд 2LITERATURE
1. Siegel, Andrew F. Practical Business Statistics. Sixth edition. Amsterdam: Academic
2. Andersen, T.G. Davis, R.A., Kreib, J.P., Mikosch, T. Handbook of Financial Time Series // Andersen T. et al. (Eds.). Springer, 2009. – 1024 p.
3. Box, G.E.P., Jenkins, J.M., Reinsel, G.C. Time Series Analysis: Forecasting and Control. – 4th ed. Wiley, 2008. – 756 p.
4. Krehbiel, Timothy C, Levin, David M, Berenson, Mark L, Basic Business Statistics. Concept and applications. 12th Edition, Prentice Hall, 2011. - 890p.
5. Lind, D. A., Marchal, W. G., Wathen, S. A.. Basic Statistics for Business & Economics. 8 edition. McGraw-Hill Higher Education – 2013.

Слайд 36.Сигел, Э. Практическая бизнес-статистика: Пер. с англ. / Э.Сигел. – М.:
7.Колесникова, И.И. Статистика. Практикум: учеб. пособие. / И.И. Колесникова, Г.В. Круглякова. – Минск.: Вышэйшая школа, 2011. – 285с.
8.Образцова, О.И. Статистика предприятий и бизнес-статистика: учеб. пособие / О.И. Образцова. - М.: Изд. дом Высшей школы экономики, 2011. – 704 с.


Слайд 5Welcome to the world of statistics. This is a world you
And even for small business, you will need to understand the larger business environmental of potential customers and competitors it operates within.

Слайд 6The early chapters will introduce you to the role of statistics

Слайд 7Is knowledge of statistics really necessary to be successful in business?

Слайд 8Is statistics difficult?
Statistics is no more difficult than any other field

Слайд 9
Although a few die-hard purists may bemoan the decline of technical

Слайд 10Does learning statistics decrease your decision-making flexibility?
Knowledge of decisions enhances

Слайд 11
Think of statistical methods as a component of decision making, but


Слайд 13СHAPTER QUESTIONS
Definition of the term ‘statistics’.
Statistical Methods
Functions of Statistics
Key Terms:
Descriptive аnd Inferential statistics
Data Sources
Worthiness Evaluating Survey

Слайд 14Statistics for Business and Economics, 6e © 2007 Pearson Education, Inc.
Chap
Chapter Goals
After completing this chapter, you should be able to:
Explain how decisions are often based on incomplete information
Explain key definitions:
♦ Population vs. Sample
♦ Parameter vs. Statistic
♦ Descriptive vs. Inferential Statistics
Describe random sampling
Explain the difference between Descriptive and Inferential statistics

Слайд 15Introduction
The word “statistics” is very popularly used in practice. It conveys
The average persons conceive of “statistics” as column of figures, zigzag graphs or tables like statistics of production, consumption, per capita income, imports, exports, crimes, divorce, share prices, etc.

Слайд 16
Such statistics are quite commonly found in newspapers, journals, reports and
For example, one may find statements like “the production of food grains is expected to decrease from 192.3 m tones in 1997-98 to 183.2 m tones in 2002-03.

Слайд 17
In addition to meaning numerical facts, “statistics” also refers to a
Thus, the word ‘statistics’ refers either to quantitative information or to a method of dealing with quantitative information.

Слайд 18What is statistics?
Statistics is the art and science of collecting and

Слайд 19Definition
There have been many definitions of the term ‘statistics’- indeed scholarly
Croxton and Cowden – “Statistics may be defined as a science of collection, presentation, analysis and interpretation of numerical data.”

Слайд 20Statistics Looks at the Big Picture
When you have a large, complex

Слайд 21Statistics in Management
What should a manager know about statistics? Your knowledge
1. Understand and use the results of statistical analysis as background information in your work.
2. Play the appropriate leadership role during the course of a statistical study if you are responsible for the actual data collection and/or analysis.

Слайд 22To fulfill these roles, you do not need to be able
Experience with actual analysis will also help you to lead other to sound results and to understand what they are going through. Moreover, there may be times when it will be most convenient for you to do some analysis on your own. Thus, we will concentrate on the ideas and concepts of statistics, reinforcing these with practical examples.

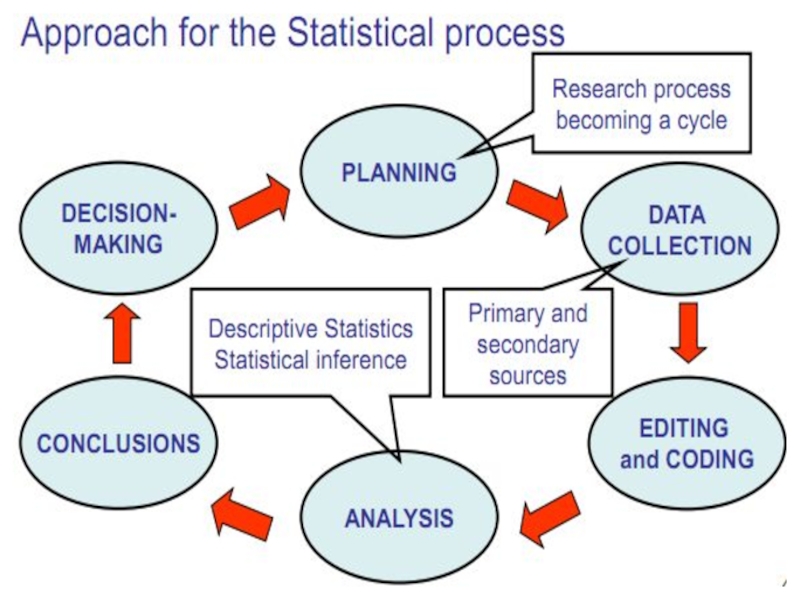
Слайд 23The five basic activities of statistics
In the beginning stages of a
The design phase will resolve these issues so that useful data will result.
Once data are available, an initial inspection is called for, provided by the exploratory phase.

Слайд 24In the modeling phase, a system of assumptions and equations is
A numerical summary of an unknown quantity, based on data, is the result of the estimation process.
The last of these basic activities is hypothesis testing, which uses the data to help you decide what the world is really like in some respect.
We will now consider these five activities in turn.

Слайд 26Designing a Plan for Data Collection -
might be called

Слайд 27Statistics is particularly useful when you have a large group of

Слайд 28
The random sample is one of the best ways to

Слайд 291. You are guaranteed that the selection process is fair and
2. The randomness, introduced in a controlled way during the design phase of the project, will help ensure validity of the statistical inferences drawn later.

Слайд 30Exploring the Data
As soon as you have a set of data,

Слайд 311. By verifying that the expected relationships actually exist in the
2. By finding some unexpected structure in the data that must be taken into account, thereby suggesting some changes in the planned analysis.
Exploration is the first phase once you have data to look at. It is often not enough to rely on a formal, automated analysis, which can be only as good as the data that go into the computer and which assumes that the data set is “well behaved”. Whenever possible, examine the data directly to make sure to look OK: That is, there are no large errors, and the relationships observable in the data are appropriate to the kind of analysis to be performed. This phase can help in (1) editing the data for errors, (2) selecting an appropriate analysis, (3) validating the statistical techniques that are to be used in further analysis.

Слайд 32Exploration is the first phase once you have data to look

Слайд 33Modeling the Data
In statistics, a model is a system of assumption

Слайд 34Here are some models that can be useful in analyzing data.

Слайд 351. Consider a simple model that generates artificial data consisting of
2. Consider a model that generates pairs of artificial noisy data values that are related to each other. Next we’ll show some useful models for describing the nature and extent of the relationship and the noise.
3. Consider a model that generates a series of noisy data values where the next one is related to the previous one.

Слайд 36Estimating an Unknown Quantity
- produces the best educated guess possible

Слайд 37Estimating an Unknown Quantity
Next period (quarter’s) sales.
What the government will
How the population of region will react to a new product.
How your portfolio of investment will fare next year.
The productivity gains of a change in strategy.
The defect rate in a manufacturing process.
 sales.What the government will do next to our")
Слайд 38Statistics can shed light on some of these situations by producing

Слайд 39Statistical estimation also provides an indication of the amount of uncertainty

Слайд 40Hypothesis testing
Statistical hypothesis testing is the use of data in deciding
")
Слайд 41Here are some examples of hypothesis that might be tested using
The average New Yorker plans to spend at least 10$ on your product next month.
You will win tomorrow’s election.
A new medical treatment is safe and effective.
Brand X produces a whiter, brighter wash.
The error in a financial statement is smaller than some material amount.
It is possible to predict the stock market based on careful analysis of the past.
The manufacturing defect rate is below that expected by customers.

Слайд 42Note that each hypothesis makes a definite statement, and it may


Слайд 44What is “Statistics”?
Statistics is the science of data that involves:
Collecting
Classifying
Summarizing
Organizing and
Interpretation

Слайд 45Statistical Methods
The methods by which statistical data are analyzed are called
Statistical methods are applicable to a very large number of fields- economics, sociology, anthropology, business, agriculture, psychology, medicine and education.
Statistical methods are used by governmental bodies, private business firms, and research agencies as an indispensable aid in i) forecasting ii) controlling and iii) exploring.

Слайд 46Statistical Methods
There are five stages in a statistical investigation:
1.Collection: Utmost

Слайд 47
2. Organization: Data from published sources are generally in organized form.

Слайд 48
3.Presentation: After the data have been collected and organized, they are
4. Analysis: Data are analyzed mostly in tabular form. Methods used are numerous ranging from simple observation of data to complicated, sophisticated and highly mathematical techniques.

Слайд 49
5.Interpretation: Drawing conclusions from the data collected and analyzed. It is

Слайд 50Statistics: Science or Art
Whether statistics is a science or an art
Science, in short, is like a lighthouse that gives light to the ships to find out their own way but does not indicate the direction in which they should go.

Слайд 51
Art, on the other hand, refers to the skill of handling
If science is knowledge, the art is action.

Слайд 52Functions of Statistics
Definiteness: To present general statements in a precise and
The sex ratio has gone up from 927 in 1991 to 933 in 2001.
Condensation: It simplifies mass of data into a few significant figures.
Comparison: It facilitates comparison.

Слайд 53Formulating and testing Hypothesis: Statistical methods are extremely useful in formulating
Prediction: Statistical methods provide helpful means of forecasting future events.
Formulation of policies: Statistics provide the basic material for framing suitable policies. How much oil a nation should import in 2005.

Слайд 54Statistics for Business and Economics, 6e © 2007 Pearson Education, Inc.
Chap
Dealing with Uncertainty
Everyday decisions are based on incomplete information
Consider:
The price of IBM stock will be higher in six months than it is now.
If the federal budget deficit is as high as predicted, interest rates will remain high for the rest of the year.

Слайд 55Statistics for Business and Economics, 6e © 2007 Pearson Education, Inc.
Chap
Dealing with Uncertainty
Because of uncertainty, the statements should be modified:
The price of IBM stock is likely to be higher in six months than it is now.
If the federal budget deficit is as high as predicted, it is probable that interest rates will remain high for the rest of the year.
(continued)

Слайд 56Basic concepts of Statistics
– Parameter
• Computed from the
– Statistic
• Computed from the subset taken from the universe.
– Variable
• Characteristic of the item being observed or measured.
– Data
• Collection of observations on one or more variable.

Слайд 57 Basic concepts of Statistics
– Population
– Sample
• The proportion of the population we actually examine.
• Representative and not biased.
• Random sampling.

Слайд 58Basic concepts of Statistics
– Census
Investigate the
Expensive
Time consuming
Sections of population is inaccessible
Units are destroyed
Inaccurate


Слайд 60Statistics for Business and Economics, 6e © 2007 Pearson Education, Inc.
Chap
Key Definitions
What is Data?
facts or information that is relevant or appropriate to a decision maker
A population is the collection of all items of interest or under investigation
N represents the population size
A sample is an observed subset of the population
n represents the sample size

Слайд 61Key Definitions
A parameter is a specific characteristic of a population
A statistic

Слайд 62Statistics for Business and Economics, 6e © 2007 Pearson Education, Inc.
Chap
Population vs. Sample
a b c d
ef gh i jk l m n
o p q rs t u v w
x y z
Population
Sample
b c
g i n
o r u
y
Values calculated using population data are called parameters
Values computed from sample data are called statistics

Слайд 63Statistics for Business and Economics, 6e © 2007 Pearson Education, Inc.
Chap
Examples of Populations
Names of all registered voters in the United States
Incomes of all families living in Belarus
Annual returns of all stocks traded on the New York Stock Exchange
Grade point averages of all the students in your university

Слайд 64Statistics for Business and Economics, 6e © 2007 Pearson Education, Inc.
Chap
Random Sampling
Simple random sampling is a procedure in which
each member of the population is chosen strictly by chance,
each member of the population is equally likely to be chosen,
and
every possible sample of n objects is equally likely to be chosen
The resulting sample is called a random sample

Слайд 65Variables
Traits or characteristics that can change values from case to case.
A variable is what is measured or manipulated in an experiment
•Examples:
•Age
•Gender
•Income
•Social class

Слайд 66Types Of Variables
In causal relationships:
CAUSE =>EFFECT
independent variable & dependent variable
•Independent variable:
An independent variable is the variable you have control over (dose of drug)
•Dependent variable: is a variable that cannot be controlled or manipulated. Its values are predicted from the independent variable ( effect on the condition)

Слайд 67Types Of Variables
•Discrete variables are measured in units that cannot be
•Continuous variables are measured in a unit that can be subdivided infinitely. Example: Height

Слайд 68Statistics for Business and Economics, 6e © 2007 Pearson Education, Inc.
Chap
Descriptive and Inferential Statistics
Two branches of statistics:
Descriptive statistics
Collecting, summarizing, and processing data to transform data into information
Inferential statistics
provide the bases for predictions, forecasts, and estimates that are used to transform information into knowledge

Слайд 69Descriptive Statistics
Collect data
e.g., Survey
Gives us the overall picture about data
•Presents data

Слайд 70Descriptive Statistics
Summarize data
e.g., Sample mean =
•Avoids inferences
Examples:
•Measures of central location
Mean,
•Measures of Variation
•Variance, Standard Deviation, z-scores

Слайд 71Inferential Statistics
•Take decision on overall population using a sample
“Sampled” data
•Permits the making of generalizations (inferences) about the data
Probability theory is a major tool used to analyze sampled data

Слайд 72Statistics for Business and Economics, 6e © 2007 Pearson Education, Inc.
Chap
Inferential Statistics
Estimation
e.g., Estimate the population mean weight using the sample mean weight
Hypothesis testing
e.g., Test the claim that the population mean weight is 120 pounds
Inference is the process of drawing conclusions or making decisions about a population based on sample results

Слайд 73Predictive Modeling
The science of predicting future outcomes based on historical events.
Model
Regression, logistic Regression, time series analysis etc.

Слайд 74Statistics for Business and Economics, 6e © 2007 Pearson Education, Inc.
Chap
The Decision Making Process
Begin Here:
Identify the
Problem
Data
Information
Knowledge
Decision
Descriptive Statistics,
Probability, Computers
Experience, Theory,
Literature, Inferential
Statistics, Computers

Слайд 75Statistics for Managers Using Microsoft Excel, 4e © 2004 Prentice-Hall, Inc.
Chap
Why We Need Data
To provide input to survey
To provide input to study
To measure performance of service or production process
To evaluate conformance to standards
To assist in formulating alternative courses of action
To satisfy curiosity

Слайд 76Statistics for Managers Using Microsoft Excel, 4e © 2004 Prentice-Hall, Inc.
Chap
Data Sources
Secondary
Data Compilation
Observation
Experimentation
Print or Electronic
Survey
Primary
Data Collection

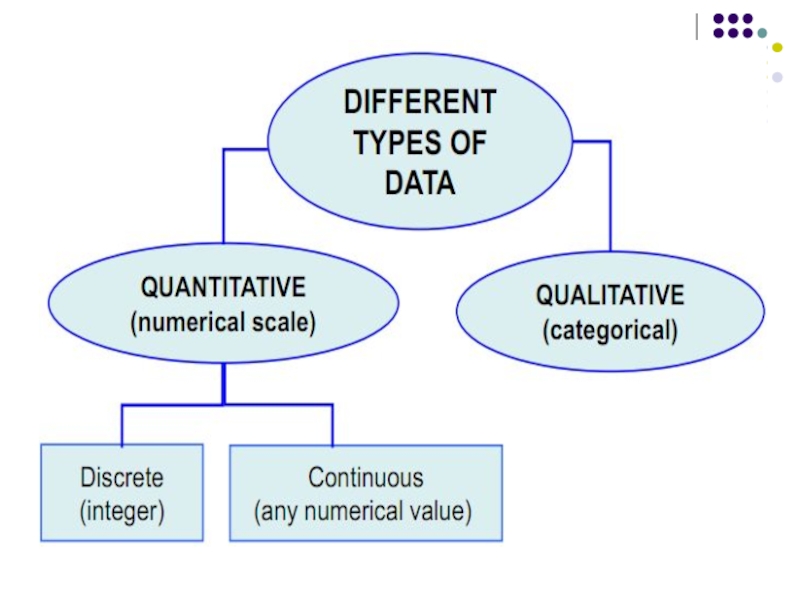
Слайд 77Chap 1-
Types of Data
Examples:
Marital Status
Political Party
Eye Color
(Defined categories)
Examples:
Number
Defects per hour
(Counted items)
Examples:
Weight
Voltage
(Measured characteristics)
Examples:Number of ChildrenDefects per hour")

Слайд 80Problems associated with the collection
of data:
– Measurements can be complicated.
– Measurements must be valid and accurate.
– Secondary data not easy to validate.
– Data can be incomplete, typographical errors, small sample.
– Biased or misleading responses.

Слайд 81Problems associated with the collection
of data:
– Make sure
• Who conducted the study?
• What data was collected?
• What sampling method was used?
• Sample size?
• Chance of bias?
• Is data relevant to the problem at hand?

Слайд 82How to design a questionnaire
– Questions should:
• Be simply
• Have no suggestion of a specific answer.
• Be specific and address only one issue.
• Carefully word sensitive issues.
• Not require calculations or a study to be answered.
– Types of questions:
• Closed
• Open
• Combined

Слайд 83 Appearance and layout of a questionnaire
– Attractive look.
–
– Clear instructions on how to complete.
– Reasonably short.
– Enough space to complete questions.
– Mother-tongue language.
– Interesting questions first.
– Simple questions first, controversial questions later.
– Complete one topic before starting the next.
– Important information first.

Слайд 84Interview
– Fieldworker completed questionnaire
• Higher response rate and data
– Mailed questionnaires
• When population is large or dispersed.
• Low response rate.
• Time consuming.
– Telephone interview
• Lower costs.
• Quicker contact with geographically dispersed respondents.

Слайд 85Editing the data
– Obvious errors should be eliminated.
– Questionnaires should be pre-tested on a small group of people.


Слайд 87
Levels of Measurement
and Measurement Scales
Interval Data
Ordinal Data
Nominal Data
Highest Level
Strongest forms
Higher Level
Lowest Level
Weakest form of measurement
Categories (no ordering or direction)
Ordered Categories (rankings, order, or scaling)
Differences between measurements but no true zero
Ratio Data
Differences between measurements, true zero exists

Слайд 88Statistics for Managers Using Microsoft Excel, 4e © 2004 Prentice-Hall, Inc.
Chap
Evaluating Survey Worthiness
What is the purpose of the survey?
Is the survey based on a probability sample?
Coverage error – appropriate frame?
Non-response error – follow up
Measurement error – good questions elicit good responses
Sampling error – always exists

Слайд 89Chap 1-
Types of Survey Errors
Coverage error or selection bias
Exists if some
Non response error or bias
People who do not respond may be different from those who do respond
Sampling error
Variation from sample to sample will always exist
Measurement error
Due to weaknesses in question design, respondent error, and interviewer’s effects on the respondent

Слайд 90Chap 1-
Types of Survey Errors
Coverage error
Non response error
Sampling error
Measurement error
Excluded from
Follow up on nonresponses
Random differences from sample to sample
Bad or leading question
(continued)

Слайд 91What do we expect from the statistical analysis?
To find out whether
and general population