- Главная
- Разное
- Дизайн
- Бизнес и предпринимательство
- Аналитика
- Образование
- Развлечения
- Красота и здоровье
- Финансы
- Государство
- Путешествия
- Спорт
- Недвижимость
- Армия
- Графика
- Культурология
- Еда и кулинария
- Лингвистика
- Английский язык
- Астрономия
- Алгебра
- Биология
- География
- Детские презентации
- Информатика
- История
- Литература
- Маркетинг
- Математика
- Медицина
- Менеджмент
- Музыка
- МХК
- Немецкий язык
- ОБЖ
- Обществознание
- Окружающий мир
- Педагогика
- Русский язык
- Технология
- Физика
- Философия
- Химия
- Шаблоны, картинки для презентаций
- Экология
- Экономика
- Юриспруденция
Armenian Energy Sector Overview and Development Outlook презентация
Содержание
- 1. Armenian Energy Sector Overview and Development Outlook
- 2. Armenia: Country Overview
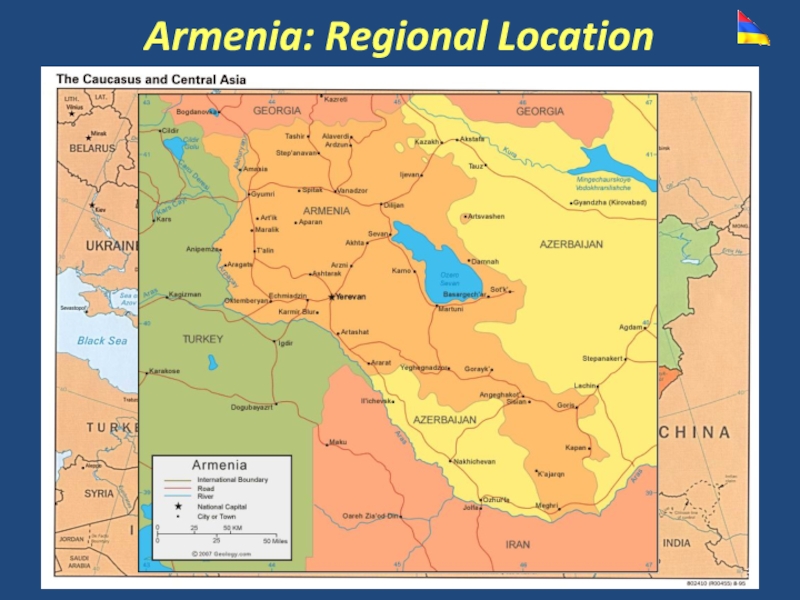
- 3. Armenia: Regional Location
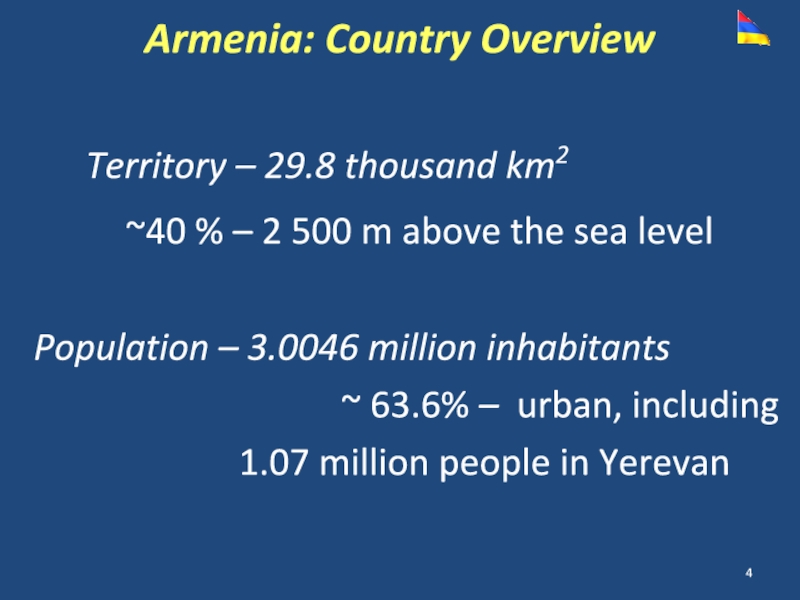
- 4. Territory – 29.8 thousand km2 ~40 %
- 5. Main macroeconomic indicators (2015 / 2014)
- 6. Armenia: Energy System Overview
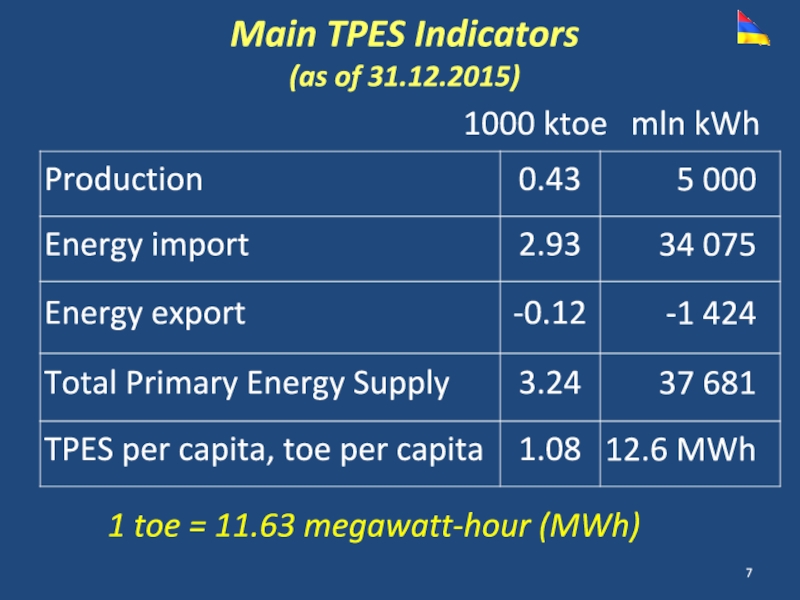
- 7. Main TPES Indicators (as of 31.12.2015) 1000
- 8. Tons of oil equivalent 1 toe =
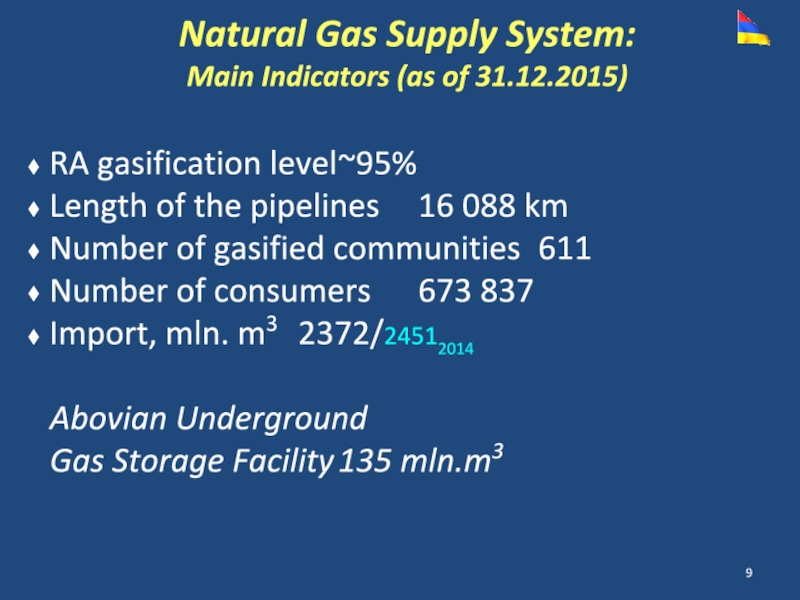
- 9. RA gasification level ~95% Length of the pipelines 16
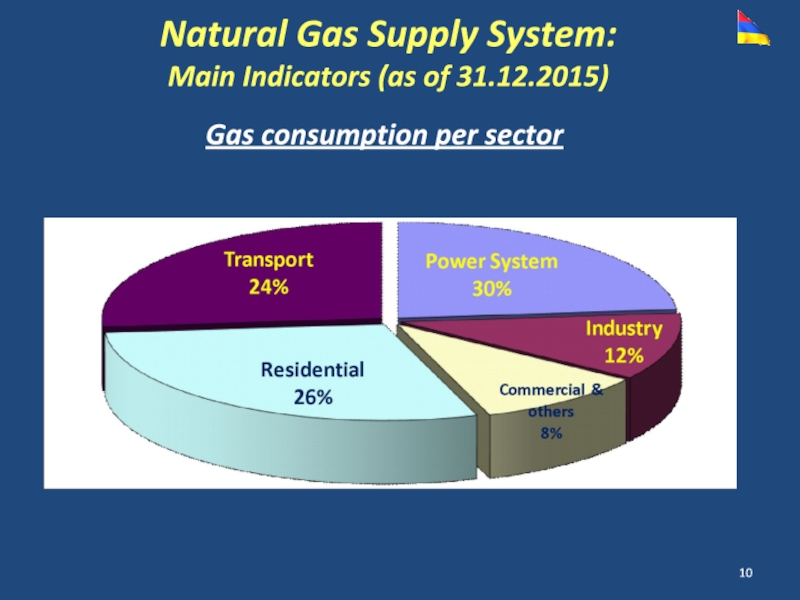
- 10. Natural Gas Supply System: Main Indicators (as of 31.12.2015) Gas consumption per sector
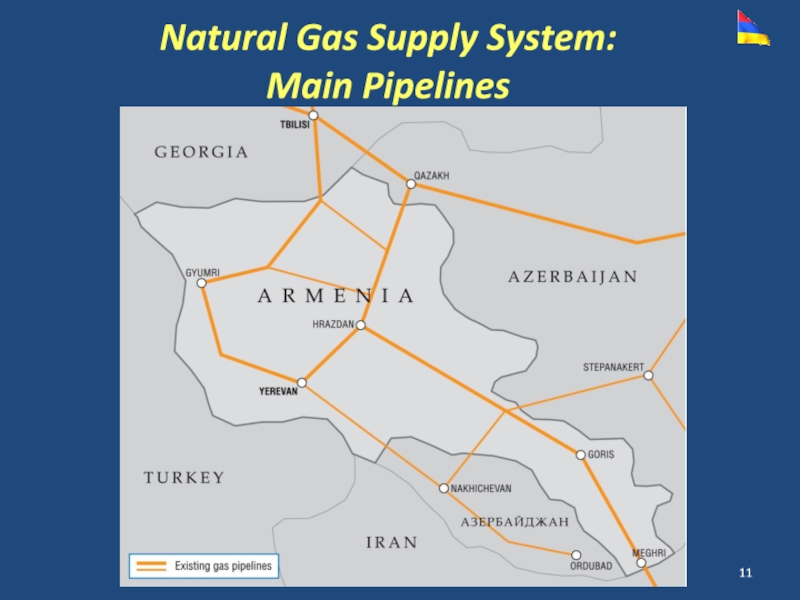
- 11. Natural Gas Supply System: Main Pipelines
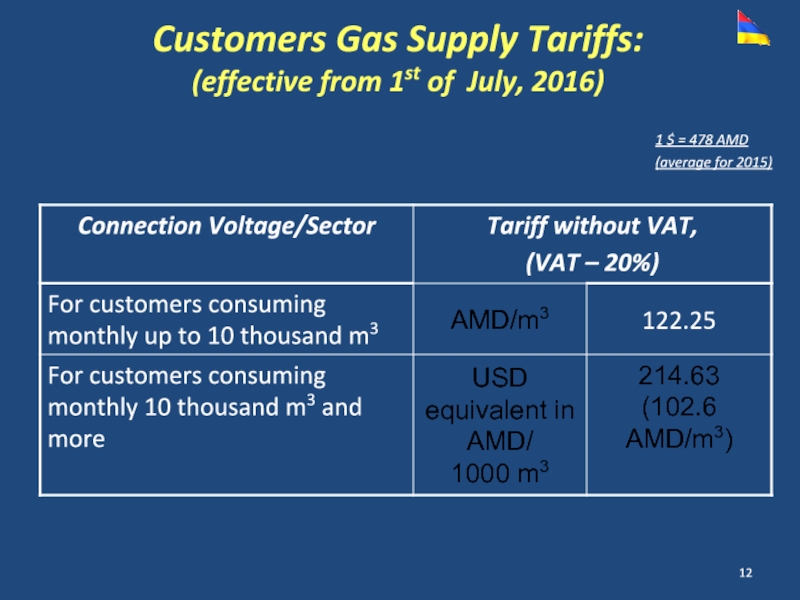
- 12. Customers Gas Supply Tariffs: (effective from 1st
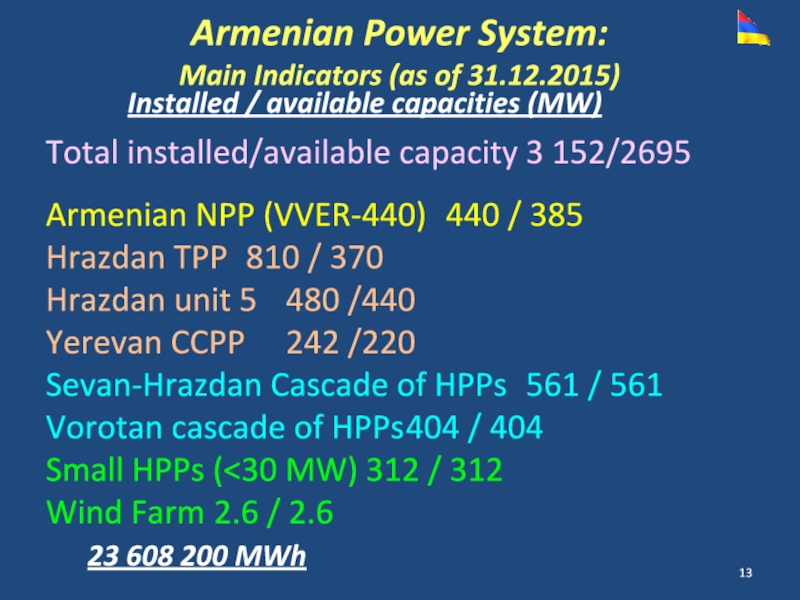
- 13. Installed / available capacities (MW) Total installed/available
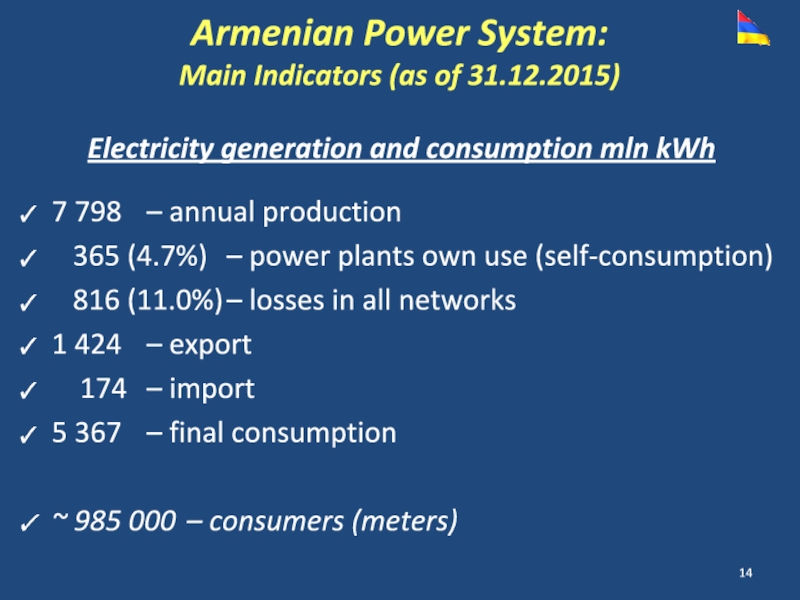
- 14. 7 798 – annual production 365
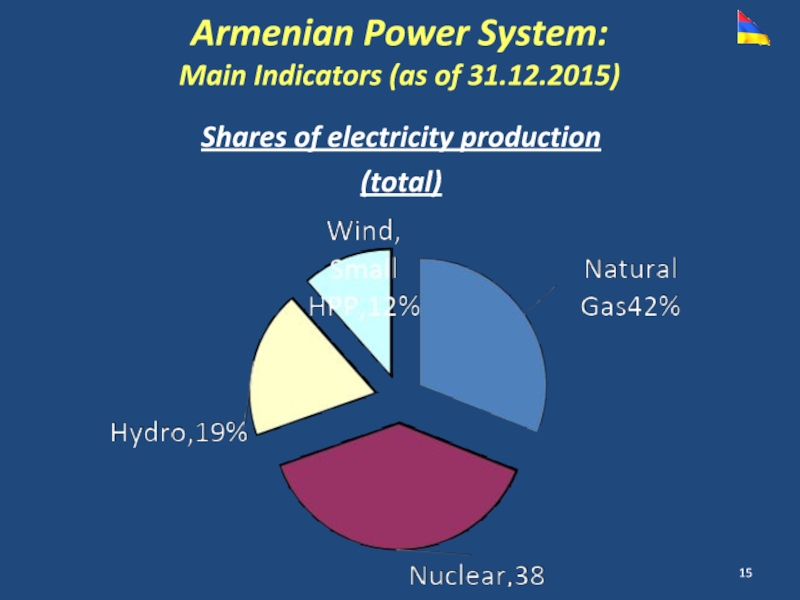
- 15. Shares of electricity production (total) Armenian Power System: Main Indicators (as of 31.12.2015)
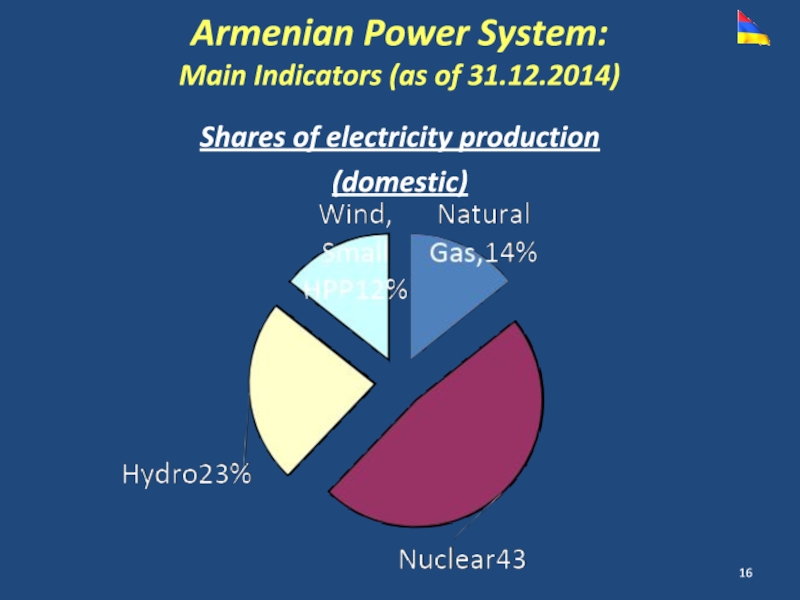
- 16. Shares of electricity production (domestic) Armenian Power System: Main Indicators (as of 31.12.2014)
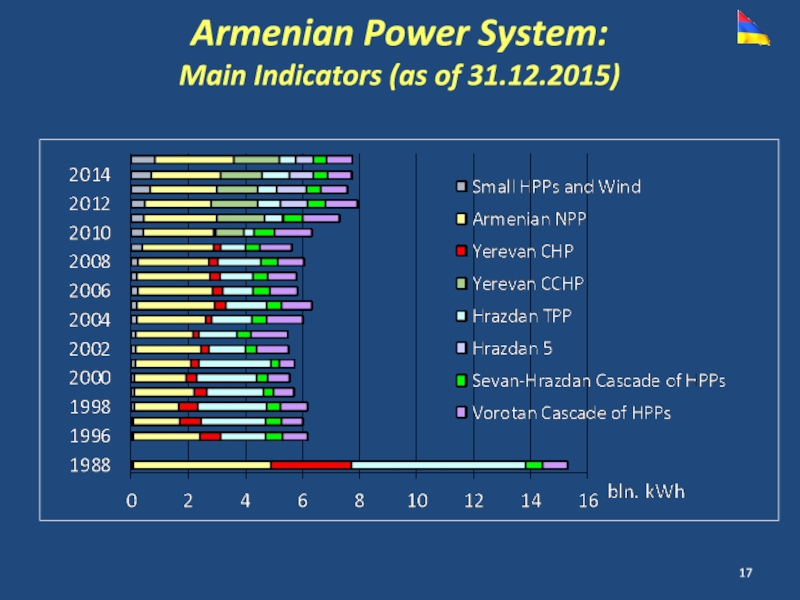
- 17. Armenian Power System: Main Indicators (as of 31.12.2015)
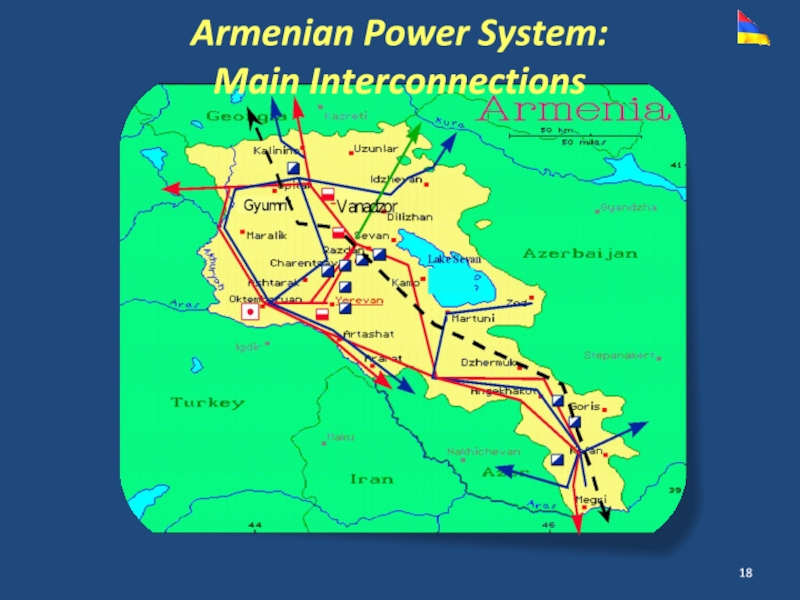
- 18. Armenian Power System: Main Interconnections
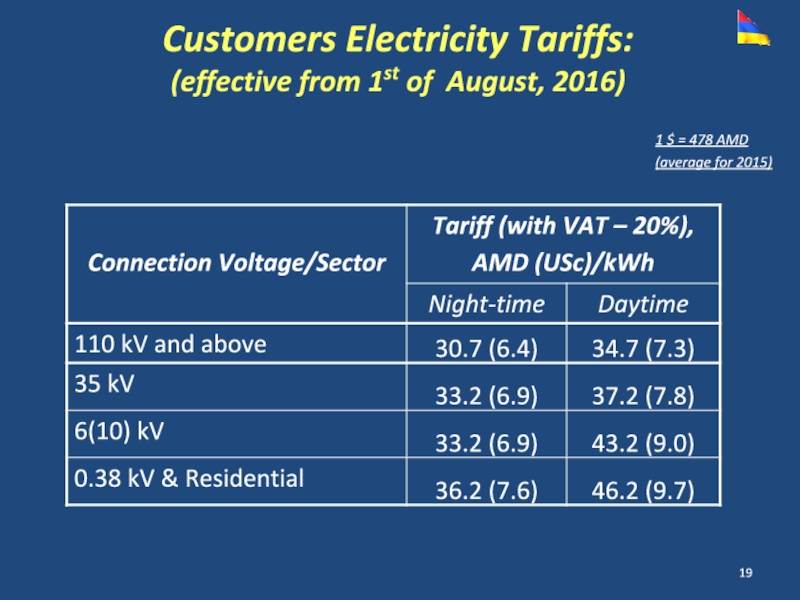
- 19. Customers Electricity Tariffs: (effective from 1st of
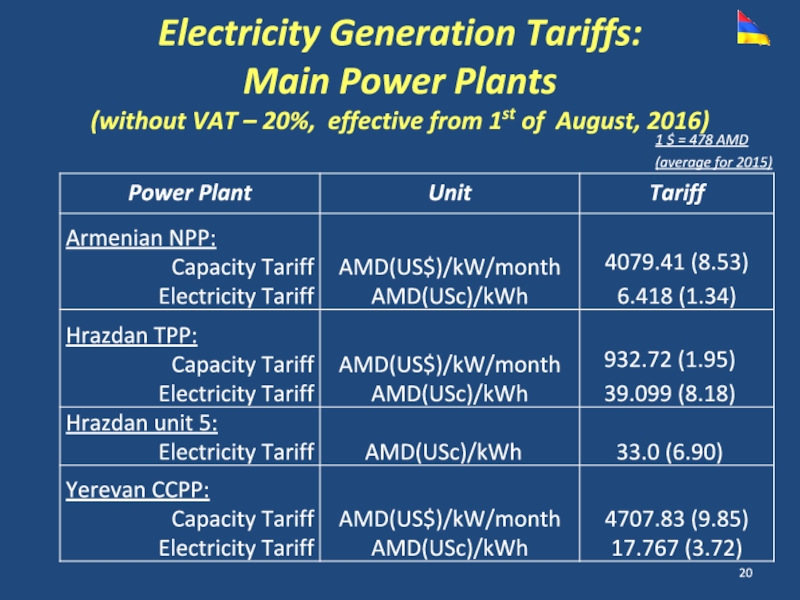
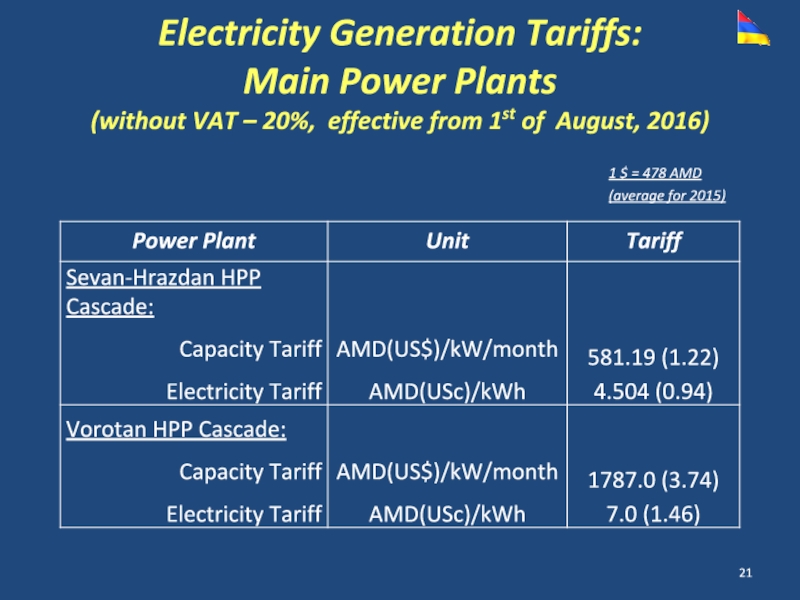
- 20. Electricity Generation Tariffs: Main Power Plants (without
- 21. 1 $ = 478 AMD (average
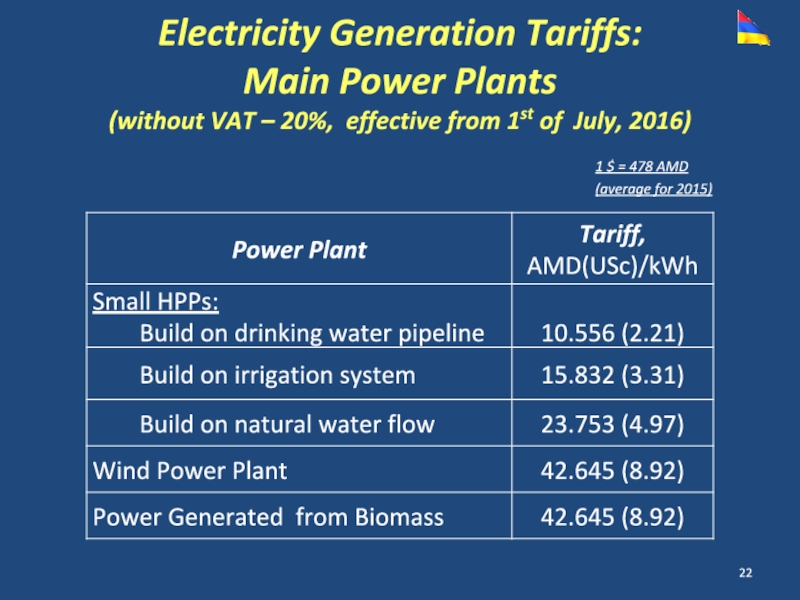
- 22. 1 $ = 478 AMD (average
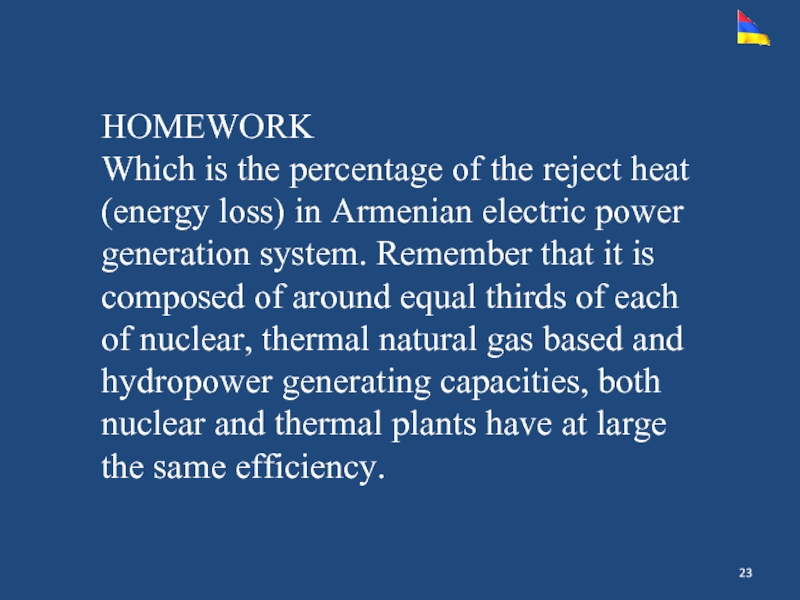
- 23. HOMEWORK Which is the percentage of the
- 24. Thank you
Слайд 1
Armenian Energy Sector Overview
and Development Outlook
Vahan Sargsyan
Energy Strategy Center of
Scientific
Слайд 4Territory – 29.8 thousand km2
~40 % – 2 500 m above
Population – 3.0046 million inhabitants
~ 63.6% – urban, including
1.07 million people in Yerevan
Armenia: Country Overview
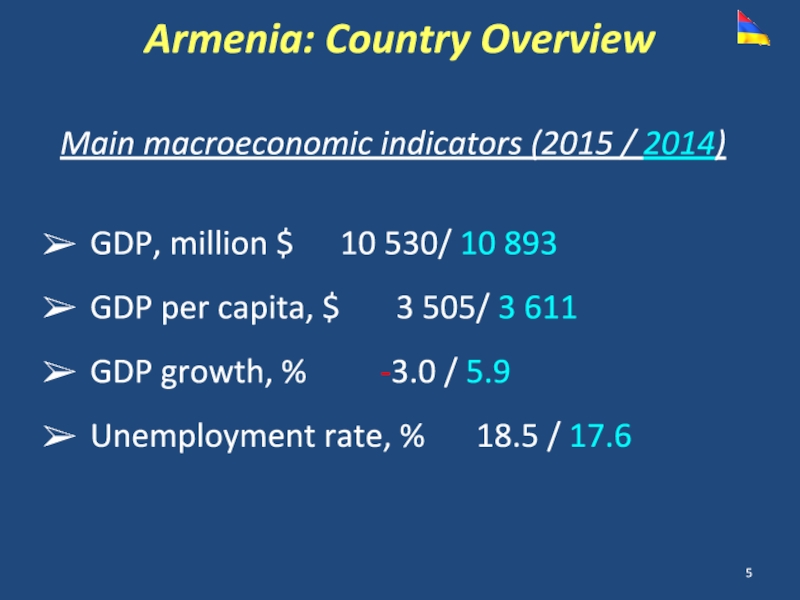
Слайд 5Main macroeconomic indicators (2015 / 2014)
GDP, million $ 10 530/ 10
GDP per capita, $ 3 505/ 3 611
GDP growth, % -3.0 / 5.9
Unemployment rate, % 18.5 / 17.6
Armenia: Country Overview
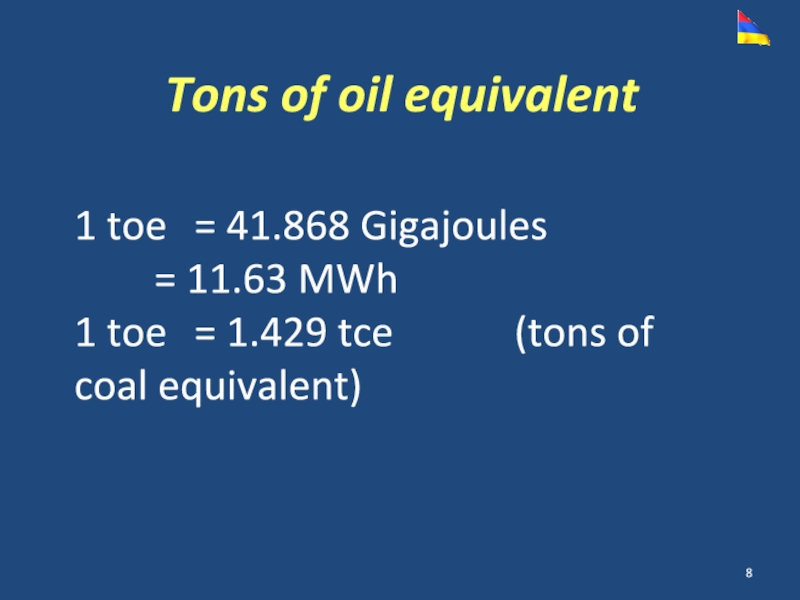
Слайд 8Tons of oil equivalent
1 toe = 41.868 Gigajoules
= 11.63 MWh
1
Слайд 9RA gasification level ~95%
Length of the pipelines 16 088 km
Number of gasified communities 611
Number
Import, mln. m3 2372/24512014
Abovian Underground Gas Storage Facility 135 mln.m3
Natural Gas Supply System:
Main Indicators (as of 31.12.2015)
Слайд 12Customers Gas Supply Tariffs:
(effective from 1st of July, 2016)
1 $ =
(average for 2015)
Слайд 13Installed / available capacities (MW)
Total installed/available capacity 3 152/2695
Armenian NPP (VVER-440) 440 /
Hrazdan TPP 810 / 370
Hrazdan unit 5 480 /440
Yerevan CCPP 242 /220
Sevan-Hrazdan Cascade of HPPs 561 / 561
Vorotan cascade of HPPs 404 / 404
Small HPPs (<30 MW) 312 / 312
Wind Farm 2.6 / 2.6
Armenian Power System:
Main Indicators (as of 31.12.2015)
23 608 200 MWh
Слайд 147 798 – annual production
365 (4.7%) – power plants own use
816 (11.0%) – losses in all networks
1 424 – export
174 – import
5 367 – final consumption
~ 985 000 – consumers (meters)
Electricity generation and consumption mln kWh
Armenian Power System:
Main Indicators (as of 31.12.2015)
Слайд 15Shares of electricity production
(total)
Armenian Power System:
Main Indicators (as of 31.12.2015)
Слайд 16Shares of electricity production
(domestic)
Armenian Power System:
Main Indicators (as of 31.12.2014)
Слайд 19Customers Electricity Tariffs:
(effective from 1st of August, 2016)
1 $ = 478
(average for 2015)
Слайд 20Electricity Generation Tariffs: Main Power Plants (without VAT – 20%, effective from 1st
1 $ = 478 AMD
(average for 2015)
