- Главная
- Разное
- Дизайн
- Бизнес и предпринимательство
- Аналитика
- Образование
- Развлечения
- Красота и здоровье
- Финансы
- Государство
- Путешествия
- Спорт
- Недвижимость
- Армия
- Графика
- Культурология
- Еда и кулинария
- Лингвистика
- Английский язык
- Астрономия
- Алгебра
- Биология
- География
- Детские презентации
- Информатика
- История
- Литература
- Маркетинг
- Математика
- Медицина
- Менеджмент
- Музыка
- МХК
- Немецкий язык
- ОБЖ
- Обществознание
- Окружающий мир
- Педагогика
- Русский язык
- Технология
- Физика
- Философия
- Химия
- Шаблоны, картинки для презентаций
- Экология
- Экономика
- Юриспруденция
A Tour of the World презентация
Содержание
- 1. A Tour of the World
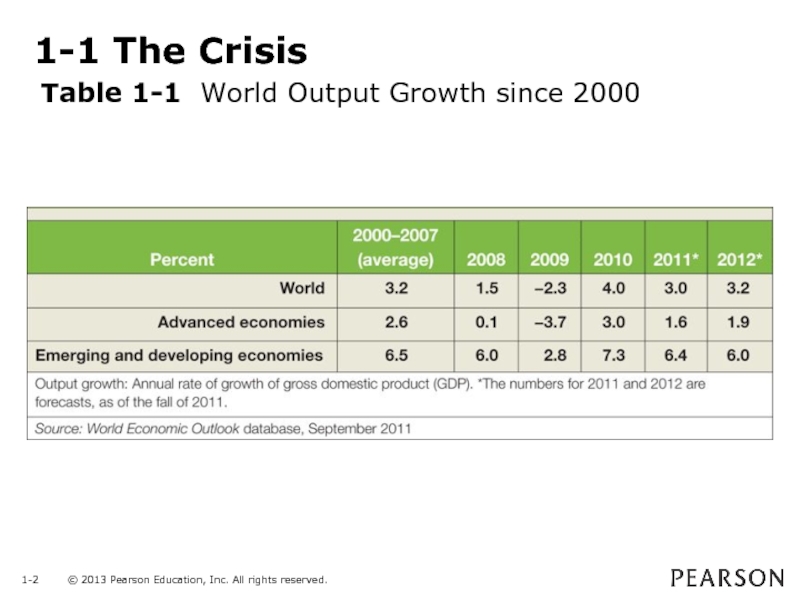
- 2. 1-1 The Crisis Table 1-1 World Output Growth since 2000
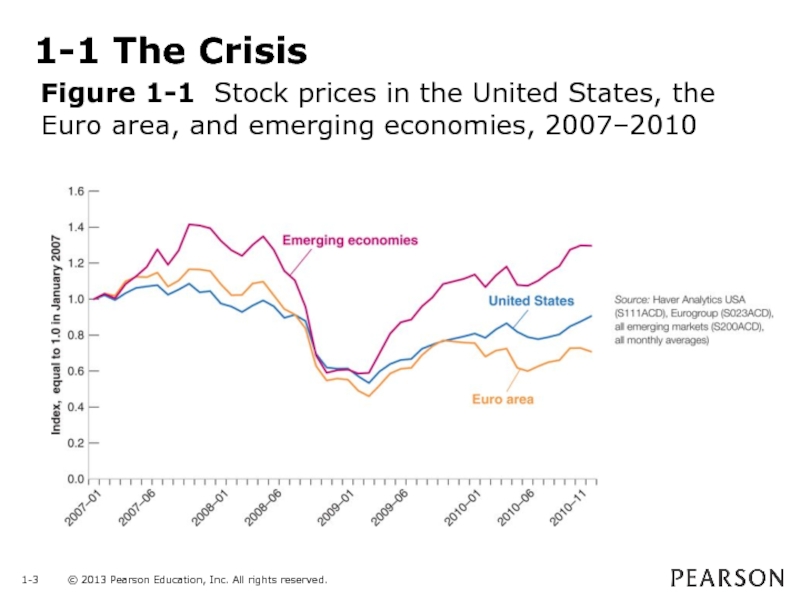
- 3. 1-1 The Crisis Figure 1-1 Stock prices
- 4. 1-1 The Crisis Figure 1-2 Unemployment rates
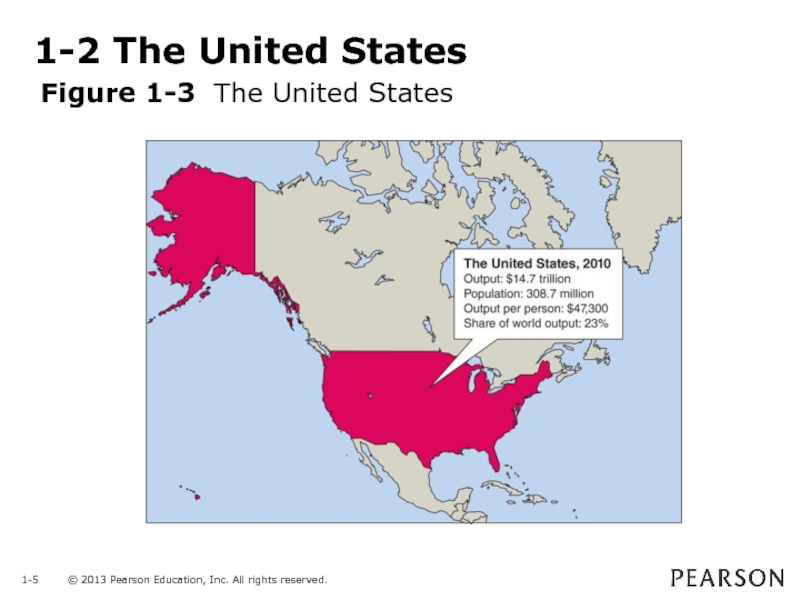
- 5. 1-2 The United States Figure 1-3 The United States
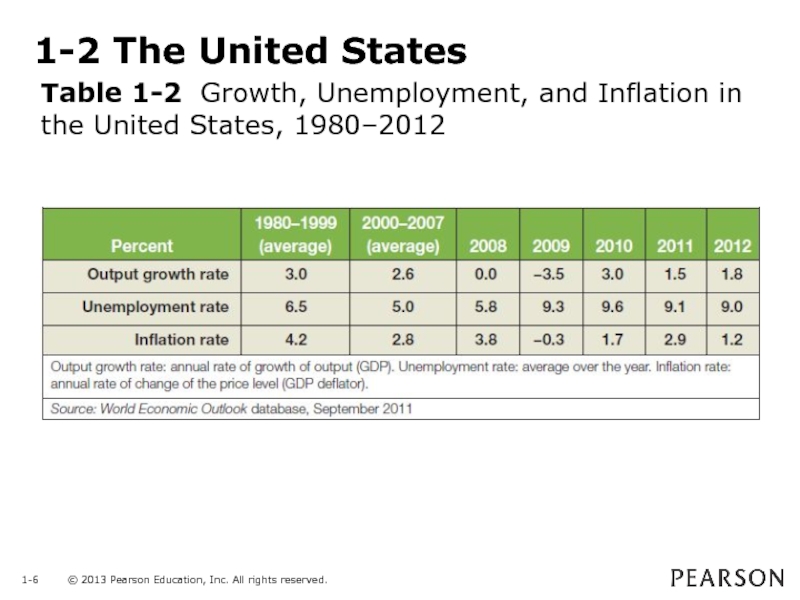
- 6. 1-2 The United States Table 1-2 Growth, Unemployment, and Inflation in the United States, 1980–2012
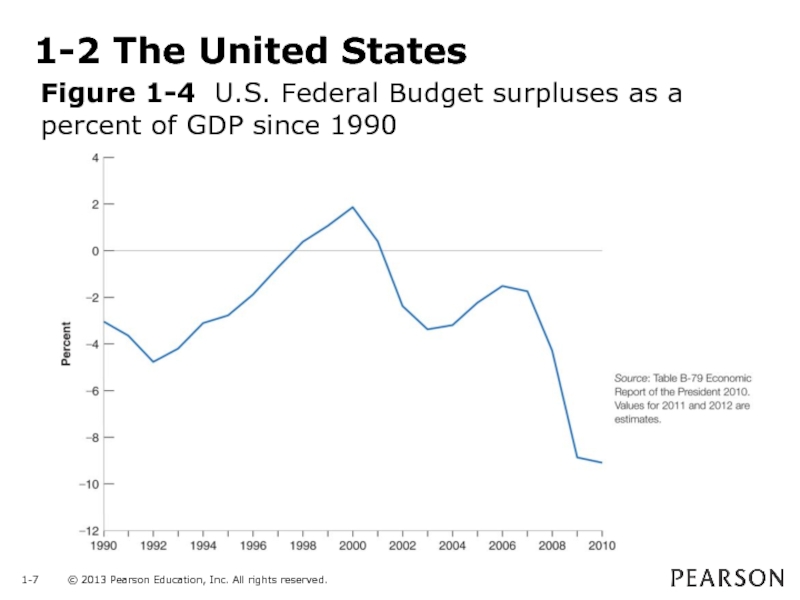
- 7. 1-2 The United States Figure 1-4 U.S.
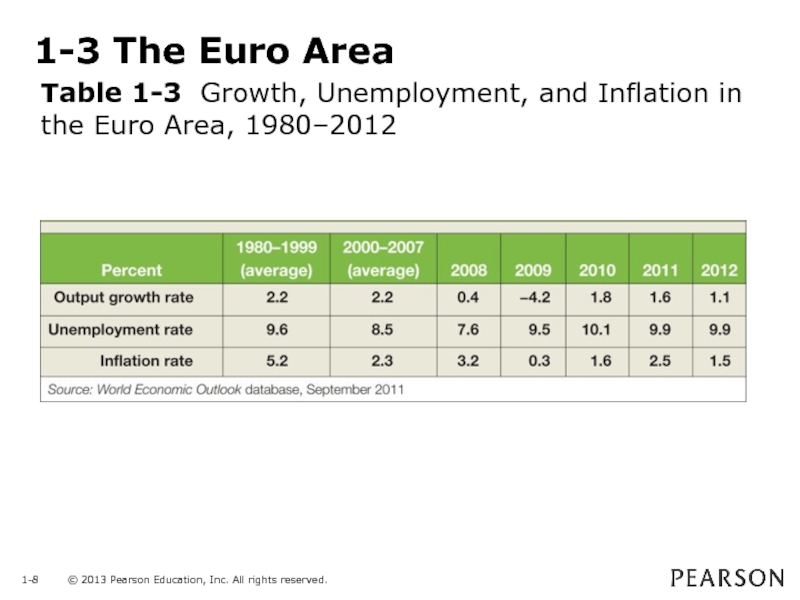
- 8. 1-3 The Euro Area Table 1-3 Growth, Unemployment, and Inflation in the Euro Area, 1980–2012
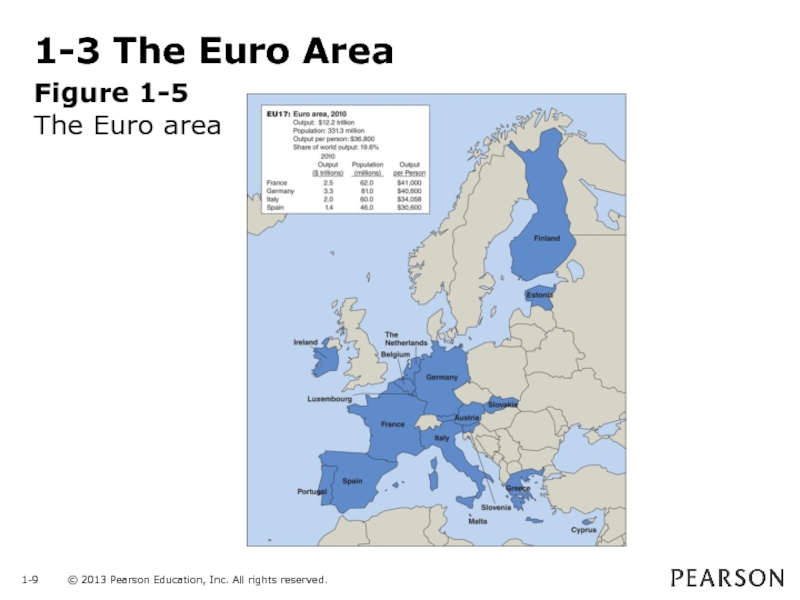
- 9. 1-3 The Euro Area Figure 1-5 The Euro area
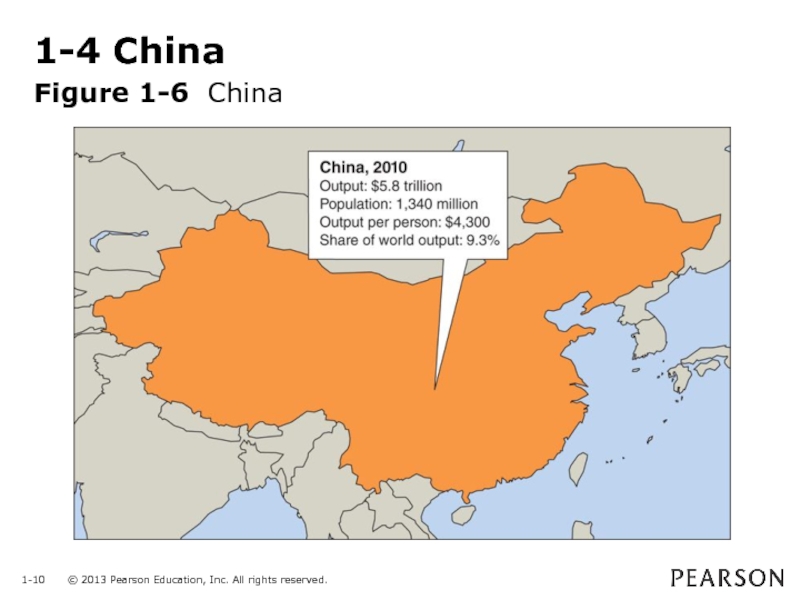
- 10. 1-4 China Figure 1-6 China
- 11. 1-4 China Table 1-4 Growth and Inflation in China, 1980–2012
Слайд 31-1 The Crisis
Figure 1-1 Stock prices in the United States, the
Euro area, and emerging economies, 2007–2010
Слайд 41-1 The Crisis
Figure 1-2 Unemployment rates in the United States and
the Euro area, 2000–2012
Слайд 61-2 The United States
Table 1-2 Growth, Unemployment, and Inflation in the
United States, 1980–2012

