- Главная
- Разное
- Дизайн
- Бизнес и предпринимательство
- Аналитика
- Образование
- Развлечения
- Красота и здоровье
- Финансы
- Государство
- Путешествия
- Спорт
- Недвижимость
- Армия
- Графика
- Культурология
- Еда и кулинария
- Лингвистика
- Английский язык
- Астрономия
- Алгебра
- Биология
- География
- Детские презентации
- Информатика
- История
- Литература
- Маркетинг
- Математика
- Медицина
- Менеджмент
- Музыка
- МХК
- Немецкий язык
- ОБЖ
- Обществознание
- Окружающий мир
- Педагогика
- Русский язык
- Технология
- Физика
- Философия
- Химия
- Шаблоны, картинки для презентаций
- Экология
- Экономика
- Юриспруденция
Best Practices for Developing Real-Time Dashboards презентация
Содержание
- 1. Best Practices for Developing Real-Time Dashboards
- 2. Additional Contributors Abhishek Lal Dan Rosanova David
- 3. Real-world, real-time dashboard and alerting use cases
- 4. Real-Time Analytics in the Real World
- 5. Transformative opportunity 1. IDC. 2. Josh Waldo
- 6. The ROI of Data Source: IDC Study:
- 7. Real-Time: all processing (from event reception to
- 8. Where is Real-Time Analytics Today Smart grid
- 9. Who is using Real-Time Analytics Source: http://tdwi.org/research/2014/09/best-practices-report-real-time-data-bi-and-analytics/asset.aspx?tc=assetpg
- 11. The world is inundated with data,
- 12. Real-Time Social Analytics SignalR http://tweetdashboard.azurewebsites.net/
- 13. With more pressure than ever on financial
- 14. Your sales team needs a competitive
- 15. Sports …. Digital data delivery play-by-play game
- 16. Botnet architecture is processing 200M+ transactions per
- 17. Trustworthy Computing Public Sector
- 19. Real-Time Analytics at Microsoft Microsoft Xbox
- 20. Challenges
- 21. Most Common Barriers Source: http://tdwi.org/research/2014/09/best-practices-report-real-time-data-bi-and-analytics/asset.aspx?tc=assetpg
- 22. What do you need to handle this?
- 23. Variable rates Predictable and unpredictable bursts
- 24. Big Data Analytics ≠ Traditional BI with
- 25. Design Patterns
- 26. Key technologies in use today
- 27. Evolving Approaches to Analytics ETL Tool
- 28. Changes in Data Warehousing Patterns Big Data
- 29. Changes in Data Warehousing Patterns Modern MPP,
- 30. Hadoop: Move Compute to the Data
- 31. Hadoop: Move Compute to the Data Source: Datameer Another way to think about this shift…
- 32. Source: Tom White’s Hadoop: The Definitive Guide Hadoop: Move Compute to the Data
- 33. Shift from Schema First to Schema Later
- 34. Changes in Data Warehousing Patterns Results
- 35. Event Hub : Data Ingestion - Hyper
- 36. What: Canonical Architecture
- 37. Presentation and action Transformation Broker How:
- 38. Commonly Used Technologies
- 39. Use real-time operational data stores (RT ODSs)
- 40. Continuous data stream mining Managing a stream
- 41. Lamda Architecture
- 42. Analytics Data Pipeline BI Tools Data Marts
- 43. Data Pipeline at Microsoft Azure Service Bus
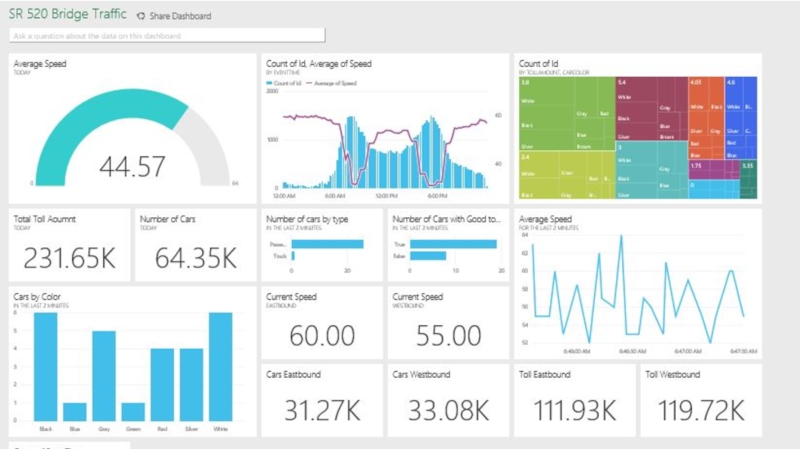
- 44. Building the Dashboard
- 45. Temporal query functions Tumbling Windows Repeating, non-overlapping,
- 46. Stream Processing Query Language DML Statements SELECT
- 47. Querying Events and Time Every event that
- 48. Tumbling Windows SELECT TimeZone, COUNT(*) AS Count
- 49. Hopping Windows SELECT Topic, COUNT(*) AS TotalTweets,
- 50. Sliding Windows SELECT Topic, COUNT(*) FROM TwitterStream
- 51. Joining multiple streams SELECT TS1.UserName, TS1.Topic FROM
- 52. Pushing Data with REST APIs
- 53. Today’s easy visual analytics tools empower the
- 54. Demos
- 55. Key Takeaways Real-world use cases
- 56. © 2014 Microsoft Corporation. All rights reserved.
Слайд 1
Best Practices for Developing Real-Time Dashboards
Jen Underwood
Microsoft Sr. Program Manager
www.jenunderwood.com
@idigdata

Слайд 2Additional Contributors
Abhishek Lal
Dan Rosanova
David Liu
Shane Zhang
Santosh Balasubramanian
Josh Caplan
Kasper de Songe
Simon
Lidberg
Benjamin Wright-Jones
Brent Stineman
Dan Manrique
Benjamin Wright-Jones
Brent Stineman
Dan Manrique

Слайд 3Real-world, real-time dashboard and alerting use cases
Challenges
Design patterns
Best practices
Build a
real-rime dashboard using REST API
Lessons learned
Lessons learned
Best Practices for Developing Real-Time Dashboards


Слайд 5Transformative opportunity
1. IDC. 2. Josh Waldo Senior Director, Cloud Partner Strategy,
Microsoft. 3. Bain & Company, The Value of Big Data: How Analytics Differentiates Winners, 2013.

Слайд 6The ROI of Data
Source: IDC Study: Realizing the Data Dividend, 2014.
The
formula
[data + analytics + people ]
@
speed
[data + analytics + people ]
@
speed
Key Opportunity Areas
Organizations can realize Return on Data in several key areas…
Productivity
Includes strategic planning, human capital management, IT optimization
Operations
Includes demand
and supply chain management, logistics
Return
on Data
$674 billion
Return
on Data
$486billion
Return
on Data
$158
billion
$235
billion
$1.6 trillion
Return on Data
Return
on Data
Customer
Facing
Includes customer acquisition, retention, support and pricing
Innovations
Includes service, research and development innovation

Слайд 7Real-Time: all processing (from event reception to system response) executes within
seconds, milliseconds or nanoseconds
Near Real-Time: one minute to several minutes
Right-Time: available when needed
On Demand: push or pull data movement unscheduled refreshes of reports
Near Real-Time: one minute to several minutes
Right-Time: available when needed
On Demand: push or pull data movement unscheduled refreshes of reports
Flavors of
Real-Time Analytics
 executes within seconds, milliseconds or nanosecondsNear")
Слайд 8Where is Real-Time Analytics Today
Smart grid
CRM alerting sales with customer scenario
Data
and identity protection services
Sales tracking
Fraud detection
Click-stream analysis
Financial portfolio alerts
Connected car scenario

Слайд 9
Who is using Real-Time Analytics
Source: http://tdwi.org/research/2014/09/best-practices-report-real-time-data-bi-and-analytics/asset.aspx?tc=assetpg

Слайд 11The world is inundated with data, but can marketing access the
data
they need? Can they use it effectively?
Right message, right customer, right moment
Marketing


Слайд 13With more pressure than ever on financial leaders, you need to
control costs, reduce risk, monitor financial performance, and quickly assess the impact of business decisions.
The need for speed
& transparency
Finance

Слайд 14Your sales team needs
a competitive edge
You have lots of data
about customers and prospects. What if you could easily combine it with external data to gain a viewpoint your competitors don’t have?
Sales

Слайд 15Sports ….
Digital data delivery play-by-play game tracking, drive summaries and game
stats for teams and players.
Sports
Source: http://www.forbes.com/sites/jasonbelzer/2015/01/30/
super-bowl-xlix-ushering-in-the-next-age-of-sports-analytics-thanks-to-numberfire/

Слайд 16Botnet architecture is processing 200M+ transactions per day and growing
566,773,255 calls
a day into the sinkhole from over 25 million distinct IP address
Fight against cybercrime
IoT

Слайд 17
Trustworthy Computing
Public Sector
Digital Crimes Unit
Government Affairs
Microsoft Consulting Services
Cybercrime Center
Proactive Disruption
We work
with our customers and partners to proactively target online criminals
MALICIOUS
SOFTWARE CRIMES
Viruses
Trojans
IP CRIMES
Counterfeiting
End-User Piracy
CHILD EXPLOITATION
Child Abuse Images
Trafficking
Worms
Botnets
Security, Reliability, Privacy
Solutions, Initiatives, Innovations
Policy, Legislation
Risk Assessment, Cybersecurity Services
Microsoft
A new era in the fight against cybercrime

Слайд 18
Partners / Subscribers
Botnet Analytics – Architecture
Processing 200M+ transactions per day and
growing
566,773,255 calls a day from over 25 million distinct IP address
Query results returned in under 2 seconds
566,773,255 calls a day from over 25 million distinct IP address
Query results returned in under 2 seconds
[Sinkhole]
SQL Server
Internet with
billions of devices
Microsoft
Analytics
Platform System
Visualizations
& insights
Certs
ISPs
Others
Excel & Power BI
Azure
HDInsight
Azure
Machine Learning
Internet with
billions of devices

Слайд 19Real-Time Analytics at Microsoft Microsoft Xbox team enhances game for HALO
customers
The situation
The HALO contest promotion team wanted to use data to create a better gamer experience for customers playing the new HALO 4.
The solution
Non-technical employees processed & analyzed raw data in real time to answer their questions, using familiar and powerful tools
The benefits
The team quickly uncovered and addressed the unexpected (cheating), while also using insights to update and improve gamer experience.
The process
Analyze raw data
?
Identify trends
?
Make updates
?
Improve CSAT
The tools


Слайд 21
Most Common Barriers
Source: http://tdwi.org/research/2014/09/best-practices-report-real-time-data-bi-and-analytics/asset.aspx?tc=assetpg

Слайд 22What do you need to handle this?
An ingestor service that can
Support variety (> million concurrent devices)
Support velocity (> million events/s)
Support volume (> 100s of TB)
with
Buffering to handle variability
Durability
Low latency
Security
and is affordable!

Слайд 23Variable rates
Predictable and
unpredictable bursts
Event volume
t
Inactivity
Period
On and off
On and off
workloads (e.g. batch job)
Over provisioned capacity is wasted.
Over provisioned capacity is wasted.
t
Bursts
Peaks due to periodic increased demand
IT complexity and wasted capacity.
Halo 4 game data (1 week starting Monday PST)
Over")
Слайд 24Big Data Analytics ≠ Traditional BI with More Data
Big Data is
redefining the processes of managing master data, data quality, and information lifecycle management
Big Data is NOT replacing EDW and OLAP, it supplements those investments
Big Data ecosystem includes variety of analytic technologies
Columnar databases, JSON, and unstructured file stores
Hadoop and NoSQL platforms adding SQL, search, and streaming capabilities, while NoSQL platforms are adding MPP and transactional support
Data tiering that aggressively leverages SSD (Flash) and DRAM
Source: Gartner


Слайд 26Key technologies in use today
Data federation, replication, data sync, message
buses, and micro batches
Functions designed for high performance include change data capture, columnar databases, in-memory processing, and solid state drives
True real-time using complex event processing (CEP) and continuous stream mining
Functions designed for high performance include change data capture, columnar databases, in-memory processing, and solid state drives
True real-time using complex event processing (CEP) and continuous stream mining
Enabling Real-Time Analytics

Слайд 27Evolving Approaches to Analytics
ETL Tool
(SSIS, etc)
EDW
(SQL Svr, Teradata, etc)
Extract
Original Data
Load
Transformed Data
Transform
OLTP
ERP
LOB
…
BI
Tools
Data Marts
Data Lake(s)
Dashboards
Apps
EDW(SQL Svr, Teradata, etc)ExtractOriginal DataLoadTransformed DataTransformOLTPERPLOB…BI ToolsData MartsData Lake(s)DashboardsApps")
Слайд 28Changes in Data Warehousing Patterns
Big Data storage aka Data Lake is
characterized by three key attributes:
Collect everything A data lake contains all data, both raw sources over extended periods of time as well as any processed data
Dive in anywhere A data lake enables users across multiple business units to refine, explore and enrich data on their terms
Flexible access A data lake enables multiple data access patterns across a shared infrastructure: batch, interactive, online, search, in-memory and other processing engine

Слайд 29Changes in Data Warehousing Patterns
Modern MPP, Columnar and Visual Analytics Innovations:
Nature
of Hadoop data access Historically querying Hadoop entailed complex Java, results were slow and batch processes thus improved tools made to expedite Hadoop data access
External tables, compression, HDFS, Hive, other means Easy visual analytics tools use business user friendly means to access Hadoop data and often brings that data into an in-memory cache for rapid data analysis
Materialized Views “v2” and analytic functions Big data visual analytic tools improve upon traditional view techniques to bring bid data into memory or chip and intelligently, automatically re-use and refresh those views

Слайд 30
Hadoop: Move Compute to the Data
Inspired by Google’s Map Reduce
Infrastructure
to automatically scale-out storage and distributed data processing on commodity hardware
Hadoop system components
HDFS – Distributed file system
MapReduce – Programming model
Others: HBase, R, Pig, Hive, Flume, Mahout, Avro, Zookeeper
Hadoop system components
HDFS – Distributed file system
MapReduce – Programming model
Others: HBase, R, Pig, Hive, Flume, Mahout, Avro, Zookeeper


Слайд 33Shift from Schema First to Schema Later
Data arrives
Derive schema
Cleanse data
Transform
Load
to EDW
Analyze
Analyze
Data arrives
Load to Hadoop
Analyze
Subsets of data loaded to EDW
SLOW VALUE
FROM DATA
RAPID VALUE
FROM DATA

Слайд 34Changes in Data Warehousing Patterns
Results
Relational and OLAP data
Traditional schema-based data warehouse
applications
EDW
HDFS bridge
Enhanced query engine
External data
source
External file
format
Regular
T-SQL
Basically adding a “bridge” to Big Data

Слайд 35Event Hub : Data Ingestion
- Hyper Scale -
- Fully Managed -
-
Interoperable -
- Secure -
- Cost Effective -
- Secure -
- Cost Effective -


Слайд 37
Presentation and action
Transformation
Broker
How: Canonical Architecture
Long term storage
Collection
Producers
Field gateway (Raspberry PI/
Galileo)
(Embedded .Net/
ThreadX)
Event
Hub
Legacy IOT
(Custom protocols)
Custom Cloud
gateway
AMQP/HTTP
C, .NET, Java…
MQTT/COAP/Custom
Time based data retention,
Consumer groups,
Partitioned receivers,
Check-pointing,
Partition distribution APIs
Low end-to-end latency
Easy integration with
analytics frameworks
and services
Custom code (Storm/Orleans)
Storage adapters
Configurable adapters
for storage devices
AMQP/HTTP, C, .NET, Java…
Scale on throughput (GB/s)
and concurrent senders
(1M with auth./flow control)
(Embedded .Net/ThreadX)Event HubLegacy IOT (Custom")

Слайд 39Use real-time operational data stores (RT ODSs)
Use real-time data warehouses
Implement changed
data capture (CDC)
Present real-time data and historic data side by side
Define acceptable thresholds and business rules for all entities tracked in real-time
Present real-time data and historic data side by side
Define acceptable thresholds and business rules for all entities tracked in real-time
Best Practices for Real-Time Data
Use real-time data warehousesImplement changed data capture (CDC)Present real-time")
Слайд 40Continuous data stream mining
Managing a stream as if it were a
queue
Time windows
Hadoop and Lambda data architecture
Enrich streaming data with other enterprise data
Store stream data to build up a useful history
Time windows
Hadoop and Lambda data architecture
Enrich streaming data with other enterprise data
Store stream data to build up a useful history
Best Practices for Streaming Data


Слайд 42Analytics Data Pipeline
BI Tools
Data Marts
Data Lake(s)
Dashboards
Apps
Data Hub
(Storage & Compute)
Data Sources
(Import From)
Data
Connector:
Import from source to Hub
Import from source to Hub
Data Connector:
Import/Export among Hubs
Data Hub
(Storage & Compute)
Data Sources
(Import From)
Data Connector:
Import from source to Hub
Data Connector:
Export from Hub to data store
Pipeline
Pipeline
Transform & Enrich
Collect & Prepare
Publish
Information Production:
Move
DashboardsAppsData Hub(Storage & Compute)Data Sources(Import From)Data Connector:Import from source to")
Слайд 43Data Pipeline at Microsoft
Azure Service Bus
Relay
Queue
Topic
Notification Hub
Event Hub
NAT and Firewall Traversal
Service
Request/Response Services
Unbuffered with TCP Throttling
Transactional Cloud AMQP/HTTP Broker
High-Scale, High-Reliability Messaging
Sessions, Scheduled Delivery, etc.
Transactional Message Distribution
Up to 2000 subscriptions per Topic
Up to 2K/100K filter rules per subscription
High-scale notification distribution
Most mobile push notification services
Millions of notification targets


Слайд 45Temporal query functions
Tumbling Windows
Repeating, non-overlapping, fixed interval windows
Hopping Windows
Generic window, overlapping,
fixed size
Sliding Windows
Slides by an epsilon and produces output at the occurrence of an event
Manage out-of-order events
Manage actions on late arriving events
Sliding Windows
Slides by an epsilon and produces output at the occurrence of an event
Manage out-of-order events
Manage actions on late arriving events
Working with
Data Streams

Слайд 46Stream Processing Query Language
DML Statements
SELECT
FROM
WHERE
GROUP BY
HAVING
CASE
JOINS
UNION
Scaling Functions
WITH
PARTITION BY
Date and Time Functions
DATENAME
DATEPART
DAY
MONTH
YEAR
DATETIMEFROMPARTS
DATEDIFF
DATADD
Windowing
Extensions
Tumbling Window
Hopping Window
Sliding Window
Tumbling Window
Hopping Window
Sliding Window
Aggregate Functions
SUM
COUNT
AVG
MIN
MAX
String Functions
LEN
CONCAT
CHARINDEX
SUBSTRING
PATINDEX

Слайд 47Querying Events and Time
Every event that flows through the system has
a timestamp
User can pick it from the payload
SELECT * FROM TwitterStream TIMESTAMP BY CreatedAt
Or the system can assign timestamps automatically based on the event arrival time
SELECT * FROM TwitterStream
Projecting timestamp into payload
SELECT System.Timestamp AS Time, Text FROM TwitterStream
Note: System.Timestamp is a reserved property that exposes the timestamp of an event.

Слайд 48Tumbling Windows
SELECT TimeZone, COUNT(*) AS Count
FROM TwitterStream TIMESTAMP BY CreatedAt
GROUP BY TimeZone, TumblingWindow(second,10)
Tell me the count of tweets per time zone every 10 seconds
Repeating, non-overlapping, fixed interval windows
 AS Count FROM TwitterStream TIMESTAMP BY CreatedAt GROUP BY TimeZone, TumblingWindow(second,10)")
Слайд 49Hopping Windows
SELECT Topic, COUNT(*) AS TotalTweets, AVG(SentimentScore)
FROM TwitterStream TIMESTAMP BY
CreatedAt
GROUP BY Topic, HoppingWindow(second, 10 , 5)
GROUP BY Topic, HoppingWindow(second, 10 , 5)
Every 5 seconds give me the count of tweets and the average sentiment score over the last 10 seconds
1
5
4
2
6
8
7
0
5
20
10
15
Time
(secs)
25
A 10-second Hopping Window with a 5-second “Hop”
30
4
2
6
8
6
5
3
6
1
1
5
4
2
6
8
6
5
3
6
1
5
3
Generic window, overlapping, fixed size
 AS TotalTweets, AVG(SentimentScore) FROM TwitterStream TIMESTAMP BY CreatedAtGROUP BY Topic, HoppingWindow(second,")
Слайд 50Sliding Windows
SELECT Topic, COUNT(*) FROM TwitterStream
TIMESTAMP BY CreatedAt
GROUP BY Topic,
SlidingWindow(second, 10)
HAVING COUNT(*) > 10
HAVING COUNT(*) > 10
Give me the count of tweets for all topics which are tweeted more than 10 times in the last 10 seconds
1
5
0
5
20
10
15
Time
(secs)
25
A 10-second Sliding Window
8
8
5
1
9
1
Slides by an epsilon and produces output at the occurrence of an event
 FROM TwitterStream TIMESTAMP BY CreatedAtGROUP BY Topic, SlidingWindow(second, 10)HAVING COUNT(*) >")
Слайд 51Joining multiple streams
SELECT TS1.UserName, TS1.Topic
FROM TwitterStream TS1 TIMESTAMP BY CreatedAt
JOIN
TwitterStream TS2 TIMESTAMP BY CreatedAt
ON TS1.UserName = TS2.UserName AND TS1.Topic = TS2.Topic AND DATEDIFF(second, TS1, TS2) BETWEEN 1 AND 60
WHERE TS1.SentimentScore != TS2.SentimentScore
ON TS1.UserName = TS2.UserName AND TS1.Topic = TS2.Topic AND DATEDIFF(second, TS1, TS2) BETWEEN 1 AND 60
WHERE TS1.SentimentScore != TS2.SentimentScore
time
List all users and the topics on which they switched their sentiment within a minute


Слайд 53Today’s easy visual analytics tools empower the business to make smarter
decisions and generate more business value
Fast, direct, agile access to big data to analyze in-place, blend with EDW, OLAP and personal data sources, decreasing long backlogs for faster actionable insight
Less need to move large volumes of data between platforms to ask new questions or perform analytics
Fast, direct, agile access to big data to analyze in-place, blend with EDW, OLAP and personal data sources, decreasing long backlogs for faster actionable insight
Less need to move large volumes of data between platforms to ask new questions or perform analytics
Unlocking the Value of Data


Слайд 55Key Takeaways
Real-world use cases
Common design patterns
Best practices
Popular real-time analytics tools

Слайд 56© 2014 Microsoft Corporation. All rights reserved. Microsoft, Windows, and other
product names are or may be registered trademarks and/or trademarks in the U.S. and/or other countries.
The information herein is for informational purposes only and represents the current view of Microsoft Corporation as of the date of this presentation. Because Microsoft must respond to changing market conditions, it should not be interpreted to be a commitment on the part of Microsoft, and Microsoft cannot guarantee the accuracy of any information provided after the date of this presentation. MICROSOFT MAKES NO WARRANTIES, EXPRESS, IMPLIED OR STATUTORY, AS TO THE INFORMATION IN THIS PRESENTATION.
The information herein is for informational purposes only and represents the current view of Microsoft Corporation as of the date of this presentation. Because Microsoft must respond to changing market conditions, it should not be interpreted to be a commitment on the part of Microsoft, and Microsoft cannot guarantee the accuracy of any information provided after the date of this presentation. MICROSOFT MAKES NO WARRANTIES, EXPRESS, IMPLIED OR STATUTORY, AS TO THE INFORMATION IN THIS PRESENTATION.